OPEN-SOURCE SCRIPT
Cập nhật Hyperbolic Tangent Volatility Stop [InvestorUnknown]
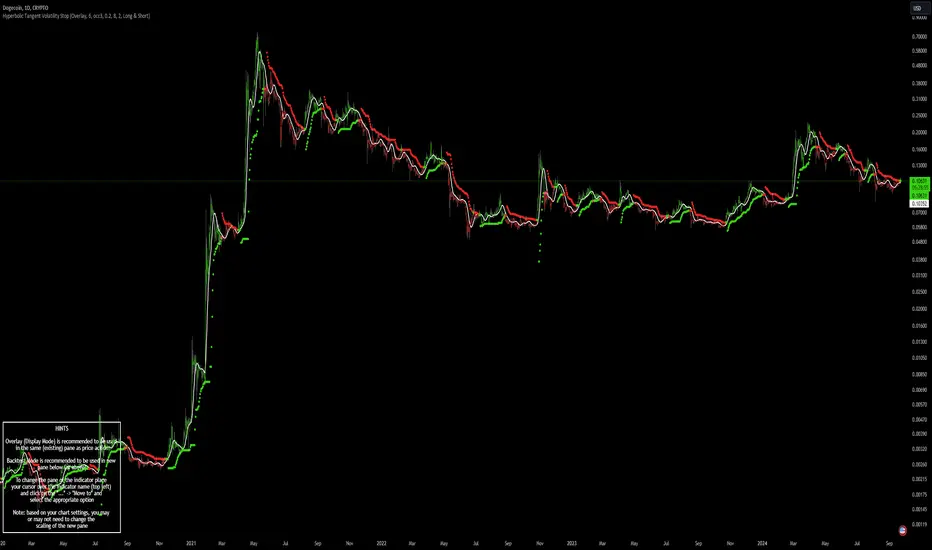
The Hyperbolic Tangent Volatility Stop (HTVS) is an advanced technical analysis tool that combines the smoothing capabilities of the Hyperbolic Tangent Moving Average (HTMA) with a volatility-based stop mechanism. This indicator is designed to identify trends and reversals while accounting for market volatility.
Hyperbolic Tangent Moving Average (HTMA):

Pine Script®
The HTMA is calculated by applying a non-linear transformation to the difference between the source price and its simple moving average, then adjusting it using the standard deviation of the price data. The result is a moving average that better tracks the real market direction.
Pine Script®
Important Note: The Hyperbolic Tangent function becomes less accurate with very high prices. For assets priced above 100,000, the results may deteriorate, and for prices exceeding 1 million, the function may stop functioning properly. Therefore, this indicator is better suited for assets with lower prices or lower price ratios.
Volatility Stop (VolStop):
Pine Script®
Backtest Mode:


The indicator includes a Hints Table, which provides useful recommendations on how to best display the indicator for different use cases. For example, when using the overlay mode, it suggests displaying the indicator in the same pane as price action, while backtest mode is recommended to be used in a separate pane for better clarity.
The Hyperbolic Tangent Volatility Stop offers traders a balanced approach to trend-following, using the robustness of the HTMA for smoothing and the adaptability of the Volatility Stop to avoid whipsaw trades during volatile periods. With its backtesting features and alert system, this indicator provides a comprehensive toolkit for active traders.
Hyperbolic Tangent Moving Average (HTMA):
- The HTMA is at the heart of the HTVS. This custom moving average uses a hyperbolic tangent transformation to smooth out price fluctuations, focusing on significant trends while ignoring minor noise. The transformation reduces the sensitivity to sharp price movements, providing a clearer view of the underlying market direction.
- The hyperbolic tangent function (tanh) is commonly used in mathematical fields like calculus, machine learning and signal processing due to its properties of “squashing” inputs into a range between -1 and 1. The function provides a non-linear transformation that can reduce the impact of extreme values while retaining a certain level of smoothness.
tanh(x) =>
e_x = math.exp(x)
e_neg_x = math.exp(-x)
(e_x - e_neg_x) / (e_x + e_neg_x)
The HTMA is calculated by applying a non-linear transformation to the difference between the source price and its simple moving average, then adjusting it using the standard deviation of the price data. The result is a moving average that better tracks the real market direction.
htma(src, len, mul) =>
tanh_src = tanh((src - ta.sma(src, len)) * mul) * ta.stdev(src, len) + ta.sma(src, len)
htma = ta.sma(tanh_src, len)
Important Note: The Hyperbolic Tangent function becomes less accurate with very high prices. For assets priced above 100,000, the results may deteriorate, and for prices exceeding 1 million, the function may stop functioning properly. Therefore, this indicator is better suited for assets with lower prices or lower price ratios.
Volatility Stop (VolStop):
- HTVS employs a Volatility Stop mechanism based on the Average True Range (ATR). This stop dynamically adjusts based on market volatility, ensuring that the indicator adapts to changing conditions and avoids false signals in choppy markets.
- The VolStop follows the price, with a higher ATR pushing the stop farther away to avoid premature exits during volatile periods. Conversely, when volatility is low, the stop tightens to lock in profits as the trend progresses.
- The ATR Length and ATR Multiplier are customizable, allowing traders to control how tightly or loosely the stop follows the price.
pine_volStop(src, atrlen, atrfactor) =>
if not na(src)
var max = src
var min = src
var uptrend = true
var float stop = na
atrM = nz(ta.atr(atrlen) * atrfactor, ta.tr)
max := math.max(max, src)
min := math.min(min, src)
stop := nz(uptrend ? math.max(stop, max - atrM) : math.min(stop, min + atrM), src)
uptrend := src - stop >= 0.0
if uptrend != nz(uptrend[1], true)
max := src
min := src
stop := uptrend ? max - atrM : min + atrM
[stop, uptrend]
Backtest Mode:
- HTVS includes a built-in backtest mode, allowing traders to evaluate the indicator's performance on historical data. In backtest mode, it calculates the cumulative equity curve and compares it to a simple buy and hold strategy.
- Backtesting features can be adjusted to focus on specific signal types, such as Long Only, Short Only, or Long & Short.
- An optional Buy and Hold Equity plot provides insight into how the indicator performs relative to simply holding the asset over time.
The indicator includes a Hints Table, which provides useful recommendations on how to best display the indicator for different use cases. For example, when using the overlay mode, it suggests displaying the indicator in the same pane as price action, while backtest mode is recommended to be used in a separate pane for better clarity.
The Hyperbolic Tangent Volatility Stop offers traders a balanced approach to trend-following, using the robustness of the HTMA for smoothing and the adaptability of the Volatility Stop to avoid whipsaw trades during volatile periods. With its backtesting features and alert system, this indicator provides a comprehensive toolkit for active traders.
Phát hành các Ghi chú
Updated the code to pinescript v6, added backtesting library v2 with more backtesting functions and removed old backtesting functions from the codeMã nguồn mở
Theo đúng tinh thần TradingView, tác giả của tập lệnh này đã công bố nó dưới dạng mã nguồn mở, để các nhà giao dịch có thể xem xét và xác minh chức năng. Chúc mừng tác giả! Mặc dù bạn có thể sử dụng miễn phí, hãy nhớ rằng việc công bố lại mã phải tuân theo Nội quy.
Thông báo miễn trừ trách nhiệm
Thông tin và các ấn phẩm này không nhằm mục đích, và không cấu thành, lời khuyên hoặc khuyến nghị về tài chính, đầu tư, giao dịch hay các loại khác do TradingView cung cấp hoặc xác nhận. Đọc thêm tại Điều khoản Sử dụng.
Mã nguồn mở
Theo đúng tinh thần TradingView, tác giả của tập lệnh này đã công bố nó dưới dạng mã nguồn mở, để các nhà giao dịch có thể xem xét và xác minh chức năng. Chúc mừng tác giả! Mặc dù bạn có thể sử dụng miễn phí, hãy nhớ rằng việc công bố lại mã phải tuân theo Nội quy.
Thông báo miễn trừ trách nhiệm
Thông tin và các ấn phẩm này không nhằm mục đích, và không cấu thành, lời khuyên hoặc khuyến nghị về tài chính, đầu tư, giao dịch hay các loại khác do TradingView cung cấp hoặc xác nhận. Đọc thêm tại Điều khoản Sử dụng.