Đường Trung bình trượt Hàm mũ (EMA)

EMA Crossover StrategyHow It Works
Long Entry: When EMA 5 crosses above EMA 20 and the close is above EMA 20, the strategy enters a long position with 1 contract.
Short Entry: When EMA 5 crosses below EMA 20 and the close is below EMA 20, the strategy enters a short position with 1 contract.
Position Reversal: If already in a long position and a sell signal occurs, the long position closes, and a short position opens (and vice versa).
Visualization: The chart shows EMA lines, buy/sell signals, and a colored background reflecting the current position.

Crypto Futures Day Trading StrategySummary of the Strategy
Chart: 15-minute
Buy Signal:
5 SMA > 20 SMA
RSI < 70
Price not above upper BB
Sell Signal:
5 SMA < 20 SMA
RSI > 30
Price not below lower BB
Stop-Loss: 2 ATR from entry
Take-Profit: 4 ATR from entry
Risk: 1% of account per trade


budget cydynamic fib + ma cloud for trend spotting
auto retraced dynamic fib using SMA or EMA
adjustable ma cloud

EMA Civic Signal V2This is a trend-following trading system using three EMAs, effective on M15 and M30 timeframes.

Trading in the Zone - 6 Indicator System🔹 Version: Pine Script v6
🔹 Category: All-in-One Trading Indicator
🔹 Best For: Stocks, Indices, Crypto
🔹 Timeframe: Optimized for 5-Min, 15-Min, 1H
🔥 Features:
✅ Strong Buy/Sell Signals → Detects high-probability trades
✅ Adaptive Moving Averages (AMA) → Trend confirmation with precision
✅ Auto-Updated Dashboard → Displays Entry, Stop-Loss, & Take-Profits
✅ Multi-Timeframe Support & Resistance → Key levels auto-detected
✅ Trend Filtering → Eliminates fake signals & enhances accuracy
✅ Movable Dashboard → Position it anywhere: Top-Right, Left, Bottom, Center
📊 How to Use?
1️⃣ Go Long → When 🚀 BUY signal appears above support & AMA confirms
2️⃣ Go Short → When 🔻 SELL signal appears near resistance & AMA confirms
3️⃣ Exit with Confidence → Follow the Dashboard’s TP1, TP2, TP3 & SL levels
📌 Best used with Nifty50, BankNifty, & major stocks for intraday trading!
🔔 Follow for more game-changing indicators! 🚀🔥

MA 21, 50, 100, 200 (Moving Averages, simple and exponential)MA 21, 50, 100, 200 (Moving Averages, simple and exponential)

MA 21, 50, 100, 200 (Moving Averages, simple and exponential)MA 21, 50, 100, 200 (Moving Averages, simple and exponential)

Fibonacci VWAP Trend Strategy🔥 Fibonacci VWAP Trend Strategy 🔥
📌 Overview
The Fibonacci VWAP Trend Strategy is a powerful trading tool that combines Fibonacci retracement levels with VWAP (Volume Weighted Average Price) to identify high-probability trade setups. By filtering signals with RSI, moving averages, and volume analysis, this strategy helps traders capture optimal entry and exit points while avoiding false signals.
🚀 Key Features
✅ Fibonacci Levels Detection – Auto-plots key Fibonacci levels (50%, 61.8%, 78.6%, and 161.8%)
✅ VWAP Trend Filter – Determines overall market direction & dynamic support/resistance
✅ Multi-Factor Confirmation – Uses RSI, moving averages, and volume for stronger signals
✅ Anti-Whipsaw Protection – Requires multiple candle confirmation to filter market noise
✅ Volume Analysis – Filters signals based on liquidity conditions
✅ Clear Visual Signals – Buy/Sell labels with a clean, non-cluttered design
✅ Real-Time Fibonacci Dashboard – Displays key Fibonacci levels dynamically
📊 How It Works
The strategy identifies potential entries when price interacts with Fibonacci retracement levels while respecting the VWAP trend direction. Trade signals are generated when multiple confirmations align.
🔹 Long Entry Conditions
✔ Price above VWAP (bullish trend)
✔ Price between 50% & 61.8% Fibonacci levels
✔ RSI confirms bullish momentum (40-70 range)
✔ Price above moving average (optional)
✔ Volume exceeds threshold (optional)
✔ Multiple consecutive bullish candles for confirmation
🔻 Short Entry Conditions
✔ Price below VWAP (bearish trend)
✔ Price between 50% & 61.8% Fibonacci levels
✔ RSI confirms bearish momentum (30-60 range)
✔ Price below moving average (optional)
✔ Volume exceeds threshold (optional)
✔ Multiple consecutive bearish candles for confirmation
⚙️ Customization Options
🔘 Toggle VWAP trend filter ON/OFF
🔘 Adjust RSI settings & thresholds
🔘 Set volume filters for better signal validation
🔘 Modify consecutive candle confirmation requirements
🔘 Enable/disable moving average filter
🔘 Customize Fibonacci dashboard placement
🔘 Set lookback period for swing point detection
✅ Best Practices
📌 Works best on higher timeframes (1H, 4H, Daily)
📌 Highly effective in trending markets
📌 Use Fibonacci extension levels for Take Profit targets
📌 Place Stop-Loss at recent swing highs/lows
📌 Adjust volume filter based on the asset's liquidity profile
🔹 This strategy blends classic Fibonacci principles with modern filtering techniques to create a robust, high-probability trading system. Whether you're a beginner or an advanced trader, this tool provides clear entry/exit signals and helps you stay on the right side of the trend! 🚀📈

EMA Selectable Crossing TriggerEMA Crossover Signal Indicator
This Pine Script creates a customizable Exponential Moving Average (EMA) crossover indicator designed for traders to identify potential "call" or "put" signals on a chart. The script plots four adjustable EMA lines and generates a signal when two specific EMAs—the "Target" and "Trigger" lines—cross each other. The direction of the crossover determines whether a "call" (bullish) or "put" (bearish) signal is displayed.
Features:
Target EMA (EMA 5):
A fast-moving EMA with a default length of 5 periods.
This line serves as the primary signal generator when it crosses the Trigger EMA.
Fully adjustable via input settings.
Trigger EMA (EMA 15):
A slightly slower EMA with a default length of 15 periods.
Acts as the reference line for the Target EMA crossover.
Fully adjustable via input settings.
Support/Resistance EMA (EMA 90):
A medium-term EMA with a default length of 90 periods.
Provides a visual guide for potential support or resistance levels on the chart.
Fully adjustable via input settings.
Support/Resistance EMA (EMA 180):
A long-term EMA with a default length of 180 periods.
Offers additional context for major support or resistance zones.
Fully adjustable via input settings.
Signal Logic:
Call Signal: Generated when the Target EMA (e.g., EMA 5) crosses above the Trigger EMA (e.g., EMA 15), indicating potential bullish momentum.
Put Signal: Generated when the Target EMA crosses below the Trigger EMA, signaling potential bearish momentum.
Signals are plotted directly on the chart at the point of crossover for easy identification.
Customization:
All four EMA lengths (Target, Trigger, EMA 90, and EMA 180) are user-adjustable through the script’s input settings, allowing flexibility to adapt the indicator to different timeframes or trading strategies.
The script plots each EMA line in distinct colors for clear visualization.
Usage:
This indicator is ideal for traders using EMA crossovers to spot entry points for options trading (calls or puts) or trend-following strategies. The additional EMA 90 and EMA 180 lines provide context for key support and resistance levels, enhancing decision-making. Adjust the EMA lengths based on your preferred trading style or asset volatility.


EMA Clouds with Strict Buy/Sell SignalsEMA Clouds with Strict Buy/Sell Signals - Precision Trading Unleashed
Unlock the power of trend-following precision with the EMA Clouds with Strict Buy/Sell Signals indicator, a sophisticated tool built for traders who demand reliability and clarity in their decision-making. Inspired by the legendary Ripster EMA Clouds, this indicator takes the classic cloud concept to the next level by incorporating stricter, high-confidence signals—perfect for navigating the markets on 15-minute or higher timeframes.
Why You’ll Want This on Your Chart:
Dual EMA Clouds for Crystal-Clear Trends: Watch as two dynamic clouds—formed by carefully paired Exponential Moving Averages (8/21 and 34/50)—paint a vivid picture of market momentum. The green short-term cloud and red long-term cloud provide an intuitive, at-a-glance view of trend direction and strength.
Stricter Signals, Fewer False Moves: Tired of chasing weak signals? This indicator only triggers buy and sell signals when the stars align: a cloud crossover (short-term crossing above or below long-term) and price confirmation above or below both clouds. The result? Fewer trades, higher conviction, and a cleaner chart.
Customizable Timeframe Power: Whether you’re a scalper on the 15-minute chart or a swing trader on the daily, tailor the clouds to your preferred higher timeframe (15min, 30min, 1hr, 4hr, or daily) for seamless integration into your strategy.
Visual Mastery Meets Actionable Alerts: Green buy triangles below the bars and red sell triangles above them make spotting opportunities effortless. Pair this with built-in alerts, and you’ll never miss a high-probability trade again.
How It Works:
Buy Signal: Triggers when the short-term cloud crosses above the long-term cloud and the price surges above both, signaling a robust bullish breakout.
Sell Signal: Activates when the short-term cloud dips below the long-term cloud and the price falls beneath both, confirming bearish dominance.
Cloud Visualization: The green cloud (8/21 EMA) tracks fast-moving trends, while the red cloud (34/50 EMA) anchors the broader market direction—together, they filter noise and spotlight tradable moves.
Why Traders Will Love It:
Designed for those who value precision over guesswork, this indicator cuts through market clutter to deliver signals you can trust. Whether you’re trading stocks, forex, crypto, or futures, its adaptability and strict logic make it a must-have tool for serious traders. Customize the EMA lengths, tweak the timeframe, and watch your edge sharpen.
Add EMA Clouds with Strict Buy/Sell Signals to your chart today and experience the confidence of trading with a tool that’s as disciplined as you are. Your next big move is waiting—don’t let it slip away.


Boyen_Multi EMA LTF HTFMultiple EMAs & Mas
Low Time Frame
Ema 13
Ema 21
Ema 25
High Time Frame
Sma 100
Ema 200
Sma 300

200D EMA/SMA Cloud200D EMA/SMA Cloud that plots the daily time frame moving averages on all time frames.

EGBO ZONE VERSION 2EGBO ZONE VERSION 2 is an indicator that identifies bullish and bearish engulfing patterns while considering trend direction. It uses EMA 25 as a filter, only showing buy signals when price is above the EMA and sell signals when price is below. The indicator marks engulfing patterns with labels on the chart and tracks their high and low zones for potential support and resistance. It also includes a table displaying engulfing signals and trend direction for M5, M15, and H1 timeframes. This helps traders confirm setups and align trades with the market trend.

EMA 24HIGH-24LOW with Volume and VWAP5 EMAs (High, Low, and three Close-based)
Volume histogram
Volume Moving Average
VWAP line

Dual Moving Averages Crossover// © Pineify Daksh Adhyaru
// Dual Moving Averages Crossover + Supertrend Indicator
// 🔹 Strategy Overview:
// This indicator combines the **Exponential Moving Averages (EMAs) crossover** with the **Supertrend** indicator to identify trend direction and generate reliable buy/sell signals.
// 📌 When to BUY (Long Entry):
// ✅ The **fast EMA (20) crosses above the slow EMA (50)** (bullish crossover).
// ✅ Supertrend flips **to green** (indicating an uptrend).
// ✅ Price is above both EMAs, confirming bullish momentum.
// 📌 When to SELL (Short Entry):
// ✅ The **fast EMA (20) crosses below the slow EMA (50)** (bearish crossover).
// ✅ Supertrend flips **to red** (indicating a downtrend).
// ✅ Price is below both EMAs, confirming bearish momentum.
// ⚠️ When to AVOID Trading:
// ❌ When the EMAs **are flat** or moving sideways, signaling a choppy market.
// ❌ If Supertrend frequently **flips colors** without a clear direction.
// ❌ During major news events that create sudden price spikes.
// 🔧 Additional Features:
// - **Plots Supertrend with background color** for better visualization.
// - **Buy & Sell arrows** appear when both EMA crossover and Supertrend confirmation align.
// - **Customizable EMA lengths & Supertrend factor** for fine-tuning.
// - **Alerts for Buy & Sell signals** to never miss a trade.
// 🚀 Use this indicator for **trend trading** and **breakout confirmation**. Adjust settings based on market conditions!

Pro Buy-Sell Indicator// ©
// Pro Buy-Sell Indicator
// 🔹 Strategy Overview:
// The Pro Buy-Sell Indicator helps identify high-probability trade setups by combining moving averages, candlestick patterns, support & resistance levels, and trend confirmation filters.
// 📌 When to BUY (Long Entry):
// ✅ A **bullish engulfing candlestick** appears.
// ✅ The **20-period moving average (MA) crosses above the 50-period MA**.
// ✅ The price is in an **uptrend** (above the 20 MA & near support levels).
// 📌 When to SELL (Short Entry):
// ✅ A **bearish engulfing candlestick** appears.
// ✅ The **20-period MA crosses below the 50-period MA**.
// ✅ The price is in a **downtrend** (below the 20 MA & near resistance levels).
// ⚠️ When to AVOID Trading:
// ❌ When the market is **ranging or choppy** (price moving sideways without clear direction).
// ❌ If there is **low volatility** (ATR is low), as breakouts may fail.
// ❌ During major news events that cause **sudden price spikes**.
// 🔧 Additional Features:
// - **Plots support & resistance zones** dynamically.
// - **Displays trade statistics (win rate, losses, total trades, accuracy)** in a table.
// - **Labels buy & sell signals** directly on the chart.
// 🚀 Use this indicator for better trade decisions! Optimize settings based on market conditions.

EMA 24UP/24LOWThe script remains an overlay indicator that plots four EMAs:
24-period EMA of the high price (green).
24-period EMA of the low price (red).
100-period EMA of the close price (aqua).
200-period EMA of the close price (blue).

AI Scalping ORB (Sandip) V2✅ Overview
The AI Scalping ORB (Opening Range Breakout) script is a custom indicator for TradingView designed to detect potential breakout trading opportunities. It focuses on the Opening Range Breakout (ORB) strategy, a popular technique used by traders to capitalize on market volatility after the market opens. The script includes various configurable settings, trading signals, and visual enhancements to aid in trading decisions.
⚙️ Key Features
Opening Range Calculation:
The script defines the opening range using the high and low price within a specified time window.
It calculates:
ORB High: The highest price during the range.
ORB Low: The lowest price during the range.
Midpoint: The midpoint between the high and low.
This range serves as the base for breakout signals.
Trade Signal Generation:
Buy Signal: Triggered when the price breaks above the ORB high.
Sell Signal: Triggered when the price breaks below the ORB low.
The script dynamically generates entry signals and stop-loss levels based on the range breakout.
Multiple take-profit targets (TP1, TP2, TP3) are calculated using risk-reward ratios.
Risk-Reward and Stop-Loss Logic:
The script includes stop-loss (SL) and take-profit (TP) levels.
Risk-reward ratios can be customized by the user.
TP levels are visualized on the chart, helping traders manage their trades effectively.
Multiple Timeframe (MTF) Support:
The indicator can display ORB levels across multiple timeframes.
This allows traders to assess the breakout potential based on higher or lower timeframes.
🎯 Inputs and Configuration Options
Time Settings:
ORB Start Time: Defines the start time of the opening range.
ORB End Time: Defines the end time of the opening range.
Timeframe: Allows switching between different timeframes.
Risk Management Settings:
Risk/Reward Ratio: Configurable ratio for stop-loss and take-profit levels.
Stop Loss Buffer: Additional buffer added to SL levels.
Style and Visual Customization:
Color settings for ORB lines, breakout signals, and TP levels.
Line styles and opacities for better chart visualization.
Custom labels for buy/sell signals and target prices.
📊 Visual Representation
The script provides a clean and informative visual display, including:
ORB range plotted with clear high, low, and midpoint levels.
Dynamic trade signals with buy/sell markers.
Clear TP and SL lines with customizable colors and styles.
Labeling of entry, stop-loss, and multiple take-profit targets.
⚡️ How to Use
Configuration:
Customize the ORB time window, risk/reward ratio, and visual preferences through the input settings.
Identify Breakouts:
Watch for price breaking above or below the ORB range.
Enter trades based on the breakout direction.
Manage Risk:
Use the SL and TP lines to manage risk and set profit targets.
Multi-Timeframe Analysis:
Utilize MTF mode to evaluate ORB performance across different timeframes.
✅ Practical Application
Suitable for scalping strategies, especially in highly volatile markets.
Can be applied to forex, crypto, or stock markets.
Helps traders quickly visualize potential breakout zones and place trades with predefined risk management.
🚀 Enhancement Suggestions
To further improve the script:
Add dynamic alerts when price breaks ORB levels.
Implement trailing stop-loss logic for better trade management.
Include volume confirmation filters to enhance signal reliability.
✅ This script offers a comprehensive solution for ORB-based scalping strategies, providing clear visual cues, risk management settings, and flexible customization for better trading decisions.

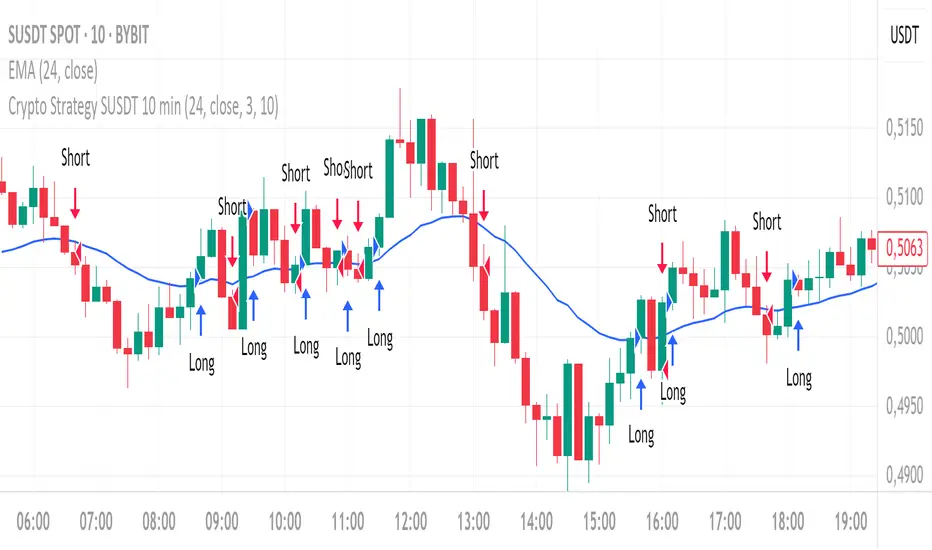
Crypto Strategy SUSDT 10 minThis strategy is designed to trade the **SUSDT** pair on a **10-minute time frame**, using a combination of an Exponential Moving Average (EMA) and percentage-based Stop Loss (SL) and Take Profit (TP) levels.
### How the strategy works:
1. **EMA Calculation**:
- The strategy calculates a 24-period Exponential Moving Average (EMA) based on the closing price.
- This EMA serves as the primary trend indicator.
2. **Entry Conditions**:
- **Long Position**: A long position is entered when the closing price is above the EMA and the opening price is below the EMA. This indicates a potential upward trend.
- **Short Position**: A short position is entered when the closing price is below the EMA and the opening price is above the EMA. This indicates a potential downward trend.
3. **Stop Loss and Take Profit**:
- Both Stop Loss (SL) and Take Profit (TP) are calculated based on the entry price of the position.
- **For Long Positions**:
- Stop Loss is set as a percentage below the entry price.
- Take Profit is set as a percentage above the entry price.
- **For Short Positions**:
- Stop Loss is set as a percentage above the entry price.
- Take Profit is set as a percentage below the entry price.
- The percentage values for SL and TP can be adjusted in the strategy's settings (default: SL = 2%, TP = 4%).
4. **Exit Conditions**:
- The position is closed automatically when either the Stop Loss or Take Profit level is reached.
5. **Visualization**:
- The 24-period EMA is plotted on the chart as a blue line, helping visualize the trend direction.
### Key Features:
- **Pair and Time Frame**: The strategy is optimized for the SUSDT pair on a 10-minute time frame.
- **Customizable Parameters**: Users can adjust the Stop Loss and Take Profit percentages to suit their risk tolerance and trading style.
- **Trend-Following Approach**: The strategy uses the EMA to identify and follow the current market trend.
This strategy is simple yet effective for capturing trends while managing risk through predefined Stop Loss and Take Profit levels.
Price Near 200 EMAIn this strategy, it is considered uptrend when the 20 EMA is above the 200 EMA and opposite for downtrend. (I use 250 EMA as default, but you can change it.)
Long entry is only taken when the price comes near the 200 EMA and Short entry is only taken when the price comes near the 200 EMA.
When the price is far away from the 200 EMA, no entry is taken.
The entry is taken based on MACD crossover.
