Volume Forecasting [LuxAlgo]The Volume Forecasting indicator provides a forecast of volume by capturing and extrapolating periodic fluctuations. Historical forecasts are also provided to compare the method against volume at time t .
This script will not work on tickers that do not have volume data.
🔶 SETTINGS
Median Memory: Number of days used to compute the median and first/third quartiles.
Forecast Window: Number of bars forecasted in the future.
Auto Forecast Window: Set the forecast window so that the forecast length completes an interval.
🔶 USAGE
The periodic nature of volume on certain securities allows users to more easily forecast using historical volume. The forecast can highlight intervals where volume tends to be more important, that is where most trading activity takes place.
More pronounced periodicity will tend to return more accurate forecasts.
The historical forecast can also highlight intervals where high/low volume is not expected.
The interquartile range is also highlighted, giving an area where we can expect the volume to lie.
🔶 DETAILS
This forecasting method is similar to the time series decomposition method used to obtain the seasonal component.
We first segment the chart over equidistant intervals. Each interval is delimited by a change in the daily timeframe.
To forecast volume at time t+1 we see where the current bar lies in the interval, if the bar is the 78th in interval then the forecast on the next bar is made by taking the median of the 79th bar over N intervals, where N is the median memory.
This method ensures capturing the periodic fluctuation of volume.
Forecastingtechniques

Price & Time SquaredHi Traders..
This is one of Gann's trading method, called Price & Time Squared. When price & time meets, price will reverse."
as you see, those lines (past & future) represent the forecast of 'potential' swing (swing high/low or turning up/ down)
here are some examples:
Weekly
Daily
H1
M30
M15
M5
How to trade (very simple):
- if the trend is down and tomorrow there is a 'Price & Time Squared Line', we can prepare to take long position (combine with your favorite price action)
- if the trend is up and tomorrow there is a 'Price & Time Squared Line', we can prepare to take short position (combine with your favorite price action)
- stop loss if the chart makes Lower Low (for Long Position)
- stop loss if the chart makes Higher High (for Short Position)
you can use those lines as guidance in your trading (just like Traffic Light)
PS:
-if you see 2 or 3 lines close together, or 2 or 3 lines stack in 1 line (cluster), it means the Time Factor is 'Strong'
the stronger the cluster the stronger the Time Factor
- due to time delay & time lag, the turning can be +/- 1 bar
- PM for trial access
“Time is the most important factor of all and not until sufficient time has expired does any big move start up or down. The time factor will overbalance both space and volume. When time is up, space movement will start and large volume will begin, either up or down.

Gann Square of 144This indicator will create lines on the chart based on W.D. Gann's Square of 144. All the inputs will be detailed below
Why create this indicator?
I didn't find it on Tradingview (at least with open source). But the main reason is to study the strategy and be able to draw it fast. Manually drawing the square is not hard, but moving all together to the right spots and scale was time-consuming.
It has a lot of inputs...
Yes, each square point divisible by 6 has information with some options, so the user can create any configuration he wants. Also, it has the advantage of having the square built in seconds and adjusting itself on each new calculation.
About the inputs
Starting Date
This input will be used when the "Set Upper/Lower Prices and Start Bar Automatically" checkbox is not selected. The indicator will calculate all the line locations on the chart using the selected start date. When selecting this input, change the Manual Max and Min Prices to the better calculation
Manual Max/Min Price
This input will be used when the "Set Upper/Lower Prices and Start Bar Automatically" checkbox is not selected. The indicator will calculate all the line's locations on the chart using these prices
Set Upper/Lower Prices and Start Bar Automatically
Selects if the starting date will be automatically selected by the system or based on the input data. When it's set, the indicator will use the most recent bar as the middle point of the square, using the higher price as the Upper Price and the lowest price as the Lower Price in the latest 72 bars (or more based on the Candles Per Division parameter)
Update at a new bar
When this option is market, the indicator will update all created lines to match the new bar position, together with all the possible new Upper/Lower prices. Let it unchecked to watch the progression of the price while the square remains fixed in the chart.
Top X-Axis
When checked, it will display the labels on the Top of the square
Bottom X-Axis
When checked, it will display the labels on the Bottom of the square
Left X-Axis
When checked, it will display the labels on the left of the square
Right X-Axis
When checked, it will display the labels on the right of the square
Show Prices on the Right Y-Axis
When checked, it will display the prices together with the labels on the right of the square
Show Vertical Divisions
Show the lines that will divide the square into 9 equal parts
Show Extra Lines
Show unique lines that will come from the Top and bottom middle of the square, connecting the center to the 36 and 108 levels
Show Grid
When selected, it will display a grid in the square
Line Patterns
A selector with some options of built-in lines configuration. When any option besides None is selected, it will override the lines inputs below
Numbers Color
Select the color of each number on the Axis
Vertical Lines Color
Select the color of the vertical lines
Grid Color
Select the grid line color
Connections from corners to N
Each corner is represented by 2 characters, so they all fit in a single line
It will indicate where the line starts and where it ends
┏ ↓ = Top Left to Bottom
┏ → = Top Left to Right
┗ ↑ = Bottom Left to Top
┗ → = Bottom Left to Right
┓ ← = Top Right to Left
┓ ↓ = Top Right to Bottom
┛ ← = Bottom Right to Left
┛ ↑ = Bottom Right to Top
Besides selecting what line will be created, it's possible to select the color, the style, and the extension
How to use this indicator
When you dig into Gann's books for more information about the square of 144, you find that it was part of his setup with multiple indicators (technical and fundamental, and astrological). It is not a "one indicator" setup, so it's hard to say that you will find entries, exits, stop loss, and take profit in this. Still, it will help see trendiness, support, and resistance levels.
Mixing this with other indicators is probably a good idea, but some may find this indicator the only one needed.
Some aspects of the square
The end of the square is important, so where it starts is crucial. The end is important because it is where the price and time expire. The other parts of the square are defined based on their start and end, so placing them right is essential.
So, where to set the start of the square?
The last major low is the most indicated. The minimum price will be the lowest, and the max price will be the last major Top. Note that the indicator uses 1 candle on each point.
After finding the start, the minimum, and the maximum prices for the square, it will draw all lines. Another essential part of the square is The Midpoint.
The midpoint is the most crucial part of the square and is the best way to see if you positioned the square correctly. When the price is inside the square, using the starting candle as the start, a second higher low or a lower high occurs in that spot. When using the Vertical lines in the indicator, it's the middle square inside Gann's square.
The other divisions will be opposing each other most of the time. So if the price is rising in the 1/3 of the square, it's common to see the price fall in the 3/3 of the square.
More information about these aspects here
Considerations
This indicator was meant for price targets and a time calculator for possible support/resistances in the chart. It was created by William Delbert Gann and was part of his setup for trading almost a century ago. The lines will form geometric figures, which Gann used with high accuracy to predict tops/bottoms and when they would occur.

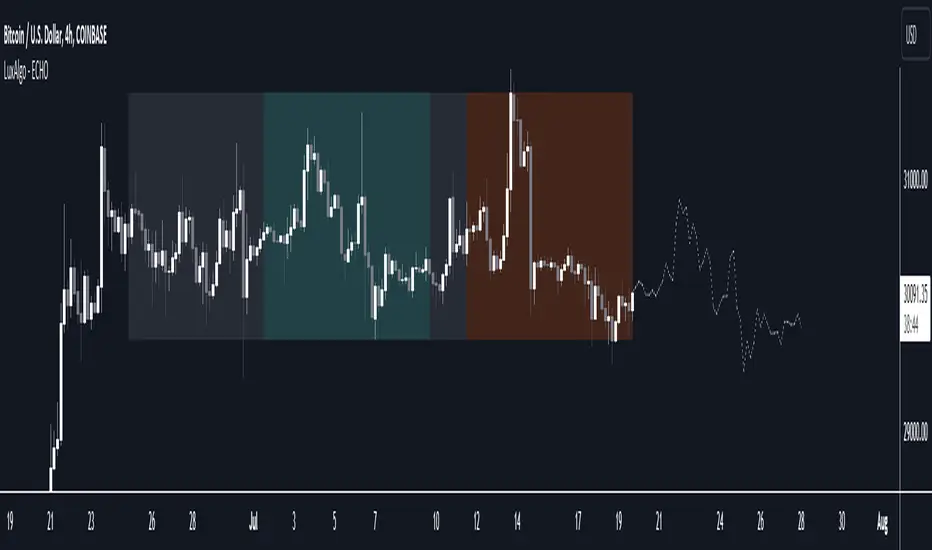
The Echo Forecast [LuxAlgo]This indicator uses a simple time series forecasting method derived from the similarity between recent prices and similar/dissimilar historical prices. We named this method "ECHO".
This method originally assumes that future prices can be estimated from a historical series of observations that are most similar to the most recent price variations. This similarity is quantified using the correlation coefficient. Such an assumption can prove to be relatively effective with the forecasting of a periodic time series. We later introduced the ability to select dissimilar series of observations for further experimentation.
This forecasting technique is closely inspired by the analogue method introduced by Lorenz for the prediction of atmospheric data.
1. Settings
Evaluation Window: Window size used for finding historical observations similar/dissimilar to recent observations. The total evaluation window is equal to "Forecast Window" + "Evaluation Window"
Forecast Window: Determines the forecasting horizon.
Forecast Mode: Determines whether to choose historical series similar or dissimilar to the recent price observations.
Forecast Construction: Determines how the forecast is constructed. See "Usage" below.
Src: Source input of the forecast
Other style settings are self-explanatory.
2. Usage
This tool can be used to forecast future trends but also to indicate which historical variations have the highest degree of similarity/dissimilarity between the observations in the orange zone.
The forecasting window determines the prices segment (in orange) to be used as a reference for the search of the most similar/dissimilar historical price segment (in green) within the gray area.
Most forecasting techniques highly benefit from a detrended series. Due to the nature of this method, we highly recommend applying it to a detrended and periodic series.
You can see above the method is applied on a smooth periodic oscillator and a momentum oscillator.
The construction of the forecast is made from the price changes obtained in the green area, denoted as w(t) . Using the "Cumulative" options we construct the forecast from the cumulative sum of w(t) . Finally, we add the most recent price value to this cumulated series.
Using the "Mean" options will add the series w(t) with the mean of the prices within the orange segment.
Finally the "Linreg" will add the series w(t) to an extrapolated linear regression fit to the prices within the orange segment.
Pivot High/Low Analysis & Forecast [LuxAlgo]Returns pivot points high/low alongside the percentage change between one pivot and the previous one (Δ%) and the distance between the same type of pivots in bars (Δt). The trailing mean for each of these metrics is returned on a dashboard on the chart. The indicator also returns an estimate of the future time position of the pivot points.
This indicator by its very nature is not real-time and is meant for descriptive analysis alongside other components of the script. This is normal behavior for scripts detecting pivots as a part of a system and it is important you are aware the pivot labels are not designed to be traded in real-time themselves
🔶 USAGE
The indicator can provide information helping the user to infer the position of future pivot points. This information is directly used in the indicator to provide such forecasting. Note that each metric is calculated relative to the same type of pivot points.
It is also common for analysts to use pivot points for the construction of various figures, getting the percentage change and distance for each pivot point can allow them to eventually filter out points of non-interest.
🔹 Forecast
We use the trailing mean of the distance between respective pivots to estimate the time position of future pivot points, this can be useful to estimate the location of future tops/bottoms. The time position of the forecasted pivot is given by a vertical dashed line on the chart.
We can see a successful application of this method below:
Above we see the forecasted pivots for BTCUSD15. The forecast of interest being the pivot high. We highlight the forecast position with a blue dotted line for reference.
After some time we obtain a new pivot high with a new forecast. However, we can see that the time location of this new pivot high matches perfectly with the prior forecast.
The position in time for the forecast is given by:
x1_ph + E
x1_pl + E
where x1_ph denotes the position in time of the most recent pivot high. x1_pl denotes the position in time of the most recent pivot low and E the average distance between respective pivot points.
🔶 SETTINGS
Length: Window size for the detection of pivot points.
Show Forecasted Pivots: Display forecast of future pivot points.
🔹 Dashboard
Dashboard Location: Location of the dashboard on the chart
Dashboard Size: Size of the dashboard on the chart
Text/Frame Color: Determines the color of the frame grid as well as the text color

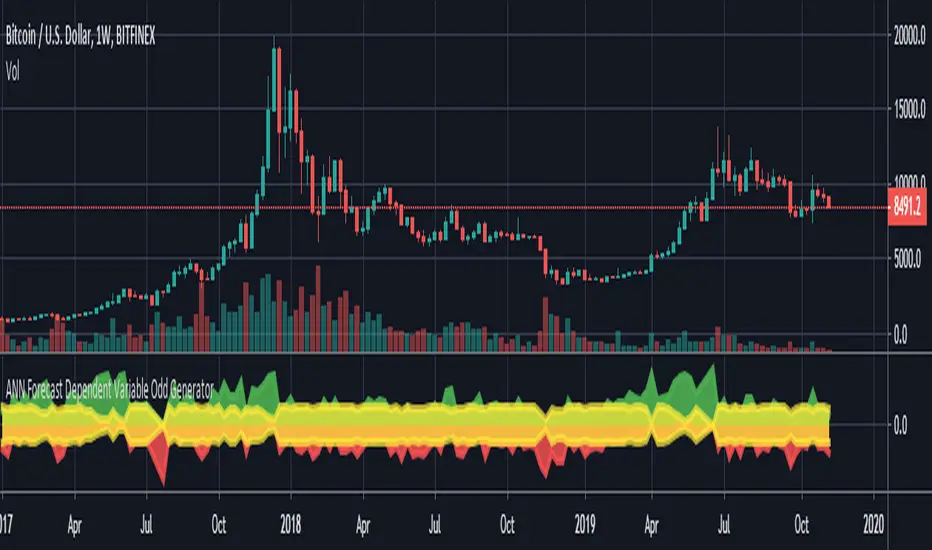
ANN Forecast Dependent Variable Odd GeneratorHello , this script is the ANN Forecast version of my "Dependent Variable Odd Generator " script.
I went to simplify a bit because the deep learning calculations are too much for this command.
The latest instruments included:
WTI : West Texas Intermediate (WTICOUSD , USOIL , CL1! ) Average error : 0.007593
BRENT : Brent Crude Oil ( BCOUSD , UKOIL , BB1! ) Average error : 0.006591
GOLD : XAUUSD , GOLD , GC1! Average error : 0.012767
SP500 : S&P 500 Index ( SPX500USD , SP1! ) Average error : 0.011650
EURUSD : Eurodollar ( EURUSD , 6E1! , FCEU1!) Average error : 0.005500
ETHUSD : Ethereum ( ETHUSD , ETHUSDT ) Average error : 0.009378
BTCUSD : Bitcoin ( BTCUSD , BTCUSDT , XBTUSD , BTC1! ) Average error : 0.01050
GBPUSD : British Pound ( GBPUSD , 6B1! , GBP1!) Average error : 0.009999
USDJPY : US Dollar / Japanese Yen ( USDJPY , FCUY1!) Average error : 0.009198
USDCHF : US Dollar / Swiss Franc ( USDCHF , FCUF1! ) Average error : 0.009999
USDCAD : Us Dollar / Canadian Dollar ( USDCAD ) Average error : 0.012162
VIX : S & P 500 Volatility Index (VX1! , VIX ) Average error : 0.009999
ES : S&P 500 E-Mini Futures ( ES1! ) Average error : 0.010709
SSE : Shangai Stock Exchange Composite (Index ) ( 000001 ) Average error : 0.011287
XRPUSD : Ripple (XRPUSD , XRPUSDT ) Average error : 0.009803
Simply select the required instrument from the tradingview analysis screen, then add this command and select the same instrument from the settings section.
The codes are not open-source because they contain forecast algorithm codes a little that I will use commercially in the future.
However, I will never remove this script, and you can use it for free unlimitedly.
For more information about my artificial neural network forecast series:
For more information about my dependent variable odd generator :
For more information about simple artificial neural networks :
(detailed information about ANN )
(25 in 1 version )
I hope it helps in your analysis. Regards , Noldo .
NOTE : In the first pass bar of the definite positive and negative zone, alerts are added for both conditions.
ANN Forecast Stochastic Oscillator [Noldo] In this script, I tried to integrate ANN Forecast Algorithm on Stochastic Oscillator.
It took me quite a while, but i guess it worth.
After selecting the ticker, select the instrument from the menu and the system will automatically turn on the appropriate Forecast Stoch system.
The system is trained with ANN values of ANN MACD 25 in 1.
The Forecast algorithm is not open-source.
But I'm never remove this script.
You can use it forever for free.
As you can see in the presentation, although it is in the same period, it is more accurate and agile than standard Stochastic Oscillator .
I think even a bar is important in trade.
For those who don't see that command,listed instruments with alternative tickers and error rates:
WTI : West Texas Intermediate (WTICOUSD , USOIL , CL1! ) Average error : 0.007593
BRENT : Brent Crude Oil ( BCOUSD , UKOIL , BB1! ) Average error : 0.006591
GOLD : XAUUSD , GOLD , GC1! Average error : 0.012767
SP500 : S&P 500 Index ( SPX500USD , SP1! ) Average error : 0.011650
EURUSD : Eurodollar ( EURUSD , 6E1! , FCEU1!) Average error : 0.005500
ETHUSD : Ethereum ( ETHUSD , ETHUSDT ) Average error : 0.009378
BTCUSD : Bitcoin ( BTCUSD , BTCUSDT , XBTUSD , BTC1! ) Average error : 0.01050
GBPUSD : British Pound ( GBPUSD , 6B1! , GBP1!) Average error : 0.009999
USDJPY : US Dollar / Japanese Yen ( USDJPY , FCUY1!) Average error : 0.009198
USDCHF : US Dollar / Swiss Franc ( USDCHF , FCUF1! ) Average error : 0.009999
USDCAD : Us Dollar / Canadian Dollar ( USDCAD ) Average error : 0.012162
SOYBNUSD : Soybean ( SOYBNUSD , ZS1! ) Average error : 0.010000
CORNUSD : Corn ( ZC1! ) Average error : 0.007574
NATGASUSD : Natural Gas ( NATGASUSD , NG1! ) Average error : 0.010000
SUGARUSD : Sugar ( SUGARUSD , SB1! ) Average error : 0.011081
WHEATUSD : Wheat ( WHEATUSD , ZW1! ) Average error : 0.009980
XPTUSD : Platinum ( XPTUSD , PL1! ) Average error : 0.009964
XU030 : Borsa Istanbul 30 Futures ( XU030 , XU030D1! ) Average error : 0.010727
VIX : S & P 500 Volatility Index (VX1! , VIX ) Average error : 0.009999
ES : S&P 500 E-Mini Futures ( ES1! ) Average error : 0.010709
SSE : Shangai Stock Exchange Composite (Index ) ( 000001 ) Average error : 0.011287
XRPUSD : Ripple (XRPUSD , XRPUSDT ) Average error : 0.009803
Extras :
- Crossover and crossunder alerts
- Switchable barcolor
NOTE :
Australian Dollar / US Dollar ( AUDUSD ) removed due to high average error. (Average error > 0.013 )
Timeframe advice :
I suggest you to use that system TF >= 1D
My favorite is 1 week bars. (1W)
More info about forecast series (My last forecast example ) :
Special thanks :
Special thanks to dear wroclai for his great effort .
NOTE : I decided to build Autonomous LSTM on Stochastic Oscillator , i think Stochastic Oscillator one of the best and it contains naturally high-lows.

ANN Forecast MACD [Noldo] In this script, I tried to convert ANN MACD to MACD Forecast.
It took me quite a while, but it was fun.
After selecting the ticker, select the instrument from the menu and the system will automatically turn on the appropriate Forecast MACD system.
The system is trained with ANN values of ANN MACD 25 in 1.
But because the system is overloaded, only the most popular instruments are left.
The others were unfortunately eliminated.
The only difference is that it was built on the forecast algorithm of my own creation.
The Forecast algorithm is not open-source.
The codes are a nice framework for some of my most valuable systems about ANN . (Working on them. )
But I'm never remove this script.
You can use it forever for free.
As you can see in the presentation, although it is in the same period, it is more accurate and agile than normal MACD.
I think even a bar is important in trade.
For those who don't see that command,listed instruments with alternative tickers and error rates:
WTI : West Texas Intermediate (WTICOUSD , USOIL , CL1! ) Average error : 0.007593
BRENT : Brent Crude Oil ( BCOUSD , UKOIL , BB1! ) Average error : 0.006591
GOLD : XAUUSD , GOLD , GC1! Average error : 0.012767
SP500 : S&P 500 Index ( SPX500USD , SP1! ) Average error : 0.011650
EURUSD : Eurodollar ( EURUSD , 6E1! , FCEU1!) Average error : 0.005500
ETHUSD : Ethereum ( ETHUSD , ETHUSDT ) Average error : 0.009378
BTCUSD : Bitcoin ( BTCUSD , BTCUSDT , XBTUSD , BTC1! ) Average error : 0.01050
GBPUSD : British Pound ( GBPUSD , 6B1! , GBP1!) Average error : 0.009999
USDJPY : US Dollar / Japanese Yen ( USDJPY , FCUY1!) Average error : 0.009198
USDCHF : US Dollar / Swiss Franc ( USDCHF , FCUF1! ) Average error : 0.009999
USDCAD : Us Dollar / Canadian Dollar ( USDCAD ) Average error : 0.012162
SOYBNUSD : Soybean ( SOYBNUSD , ZS1! ) Average error : 0.010000
CORNUSD : Corn ( ZC1! ) Average error : 0.007574
NATGASUSD : Natural Gas ( NATGASUSD , NG1! ) Average error : 0.010000
SUGARUSD : Sugar ( SUGARUSD , SB1! ) Average error : 0.011081
WHEATUSD : Wheat ( WHEATUSD , ZW1! ) Average error : 0.009980
XPTUSD : Platinum ( XPTUSD , PL1! ) Average error : 0.009964
XU030 : Borsa Istanbul 30 Futures ( XU030 , XU030D1! ) Average error : 0.010727
VIX : S & P 500 Volatility Index (VX1! , VIX ) Average error : 0.009999
ES : S&P 500 E-Mini Futures ( ES1! ) Average error : 0.010709
SSE : Shangai Stock Exchange Composite (Index ) ( 000001 ) Average error : 0.011287
XRPUSD : Ripple (XRPUSD , XRPUSDT ) Average error : 0.009803
Extras :
- Crossover and crossunder alerts
- Switchable barcolor
NOTE :
Australian Dollar / US Dollar (AUDUSD ) removed due to high average error. (Average error > 0.013 )
Timeframe advice :
I suggest you to use that system TF >= 1D
My favorite is 1 week bars. (1W)
Info about forecast series :
www.sciencedirect.com
Special thanks :
Special thanks to dear wroclai for his great effort .

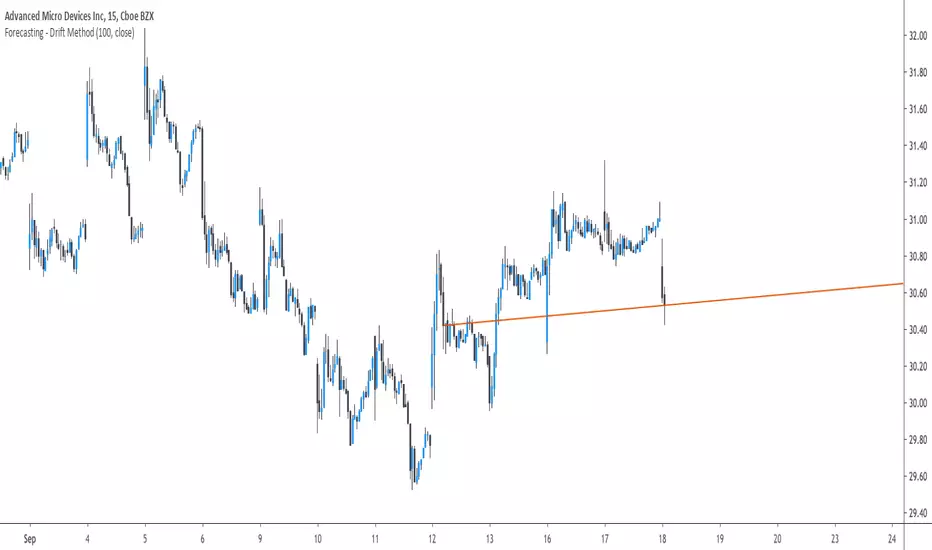
Forecasting - Drift MethodIntroduction
Nothing fancy in terms of code, take this post as an educational post where i provide information rather than an useful tool.
Time-Series Forecasting And The Drift Method
In time-series analysis one can use many many forecasting methods, some share similarities but they can all by classified in groups and sub-groups, the drift method is a forecasting method that unlike averages/naive methods does not have a constant (flat) forecast, instead the drift method can increase or decrease over time, this is why its a great method when it comes to forecasting linear trends.
Basically a drift forecast is like a linear extrapolation, first you take the first and last point of your data and draw a line between those points, extend this line into the future and you have a forecast, thats pretty much it.
One of the advantage of this method is first its simplicity, everyone could do it by hand without any mathematical calculations, then its ability to be non-conservative, conservative methods involve methods that fit the data very well such as linear/non-linear regression that best fit a curve to the data using the method of least-squares, those methods take into consideration all the data points, however the drift method only care about the first and last point.
Understanding Bias And Variance
In order to follow with the ability of methods to be non-conservative i want to introduce the concept of bias and variance, which are essentials in time-series analysis and machine learning.
First lets talk about training a model, when forecasting a time-series we can divide our data set in two, the first part being the training set and the second one the testing set. In the training set we fit a model to the training data, for example :
We use 200 data points, we split this set in two sets, the first one is for training which is in blue, and the other one for testing which is in green.
Basically the Bias is related to how well a forecasting model fit the training set, while the variance is related to how well the model fit the testing set. In our case we can see that the drift line does not fit the training set very well, it is then said to have high bias. If we check the testing set :
We can see that it does not fit the testing set very well, so the model is said to have high variance. It can be better to talk of bias and variance when using regression, but i think you get it. This is an important concept in machine learning, you'll often see the term "overfitting" which relate to a model fitting the training set really well, those models have a low to no bias, however when it comes to testing they don't fit well at all, they have high variance.
Conclusion On The Drift Method
The drift method is good at forecasting linear trends, and thats all...you see, when forecasting financial data you need models that are able to capture the complexity of the price structure as well as being robust to noise and outliers, the drift method isn't able to capture such complexity, its not a super smart method, same goes for linear regression. This is why more peoples are switching to more advanced models such a neural networks that can sometimes capture such complexity and return decent results.
So this method might not be the best but if you like lines then here you go.
Alpha-Sutte ModelThe Alpha-Sutte model is an ongoing project run by Ansari Saleh Ahmar, a lecturer and researcher at Universitas Negeri Makassar in Indonesia, that attempts to make forecasts for time series like how Arima and Holt-Winters models do. Currently Ahmar and his team have conducted research and published papers comparing the efficacy of the Alpha-Sutte and other models, such as Arima and Holt-Winters, on topics ranging from forecasting Turkey's CPI data, Bitcoin prices, Apple's stock prices, primary energy supply of Indonesia, to infant mortality rates in China.
The Alpha-Sutte model in comparison to the other two models listed above shows promise in providing a more accurate forecast, and the project has been able to receive some of its funding from organizations such as the US Agency for International Development, which is a part of the US Federal Government, so maybe the project has some actual merit.
How it works:
In this model there are four values presented at the top of the window.
1) The first value in blue is the value of the Alpha-Sutte model whose purpose is to forecast the price of the current bar.
2) The second value in yellow is an adaptive version of the Alpha-Sutte model that I made. The purpose of the adaptive Alpha-Sutte model is to expand upon the Alpha-Sutte by allowing new information to be introduced, causing the value to change during the current period, hence the adaptiveness of it.
3) The third value in aqua is the moving average of the low% Sutte line which is a predictive line that is based off of the close and low of the current and previous periods.
4) The fourth value in red is the moving average of the high% Sutte line which is a predictive line that is based off of the close and high of the current and previous periods.
Trend signals:
If low% Sutte (aqua value/line) is greater than high% Sutte (red value/line) then this is a buy signal.
If high% Sutte (red value/line) is greater than low% Sutte (aqua value/line) then this is a sell signal.
Caveat:
Even though this model's purpose is to forecast the future, will it be able to predict periods of large movements? No, of course not, but it will adjust quickly to try to make more accurate forecasts for the next period. This was also a reason why I made an adaptive version of this model to try to reduce some of the discrepancies between the Alpha Sutte and price when there is a large unexpected move.
*WARNING before using this I would highly recommend that you look up "Sutte Indicator" online and read some of the papers about this model before you use this , even though this model has shown merit when compared to Arima and Holt-Winter models this is still an ongoing project.*
Hopefully this project will actually come to something in the near future as the calculation for this time series predictive model is much easier to calculate and program in pine editor than something like an Arima model.
*Also, if you know how to use R language there is a package for the "Alpha-Sutte model".*

Linear ExtrapolationBasic extrapolator for forecast a time-series, all forecasts are mades length periods ahead.
This is not a estimation of the exact price
This should only be used for forecasting direction, dont expect the price to be at the same value of its forecast.
Bias, Mean absolute error, Mean percentage error...etc look useless here, its better to use correlation as a accuracy measurement.
Correlation(Forecast ,close,period)
Rescaling for a better forecast ?
Transforming a non-stationary signal to a stationary signal can increase the forecasting accuracy, this can be done by detrending. Here is a list of somes detrending methods:
Auto-Bias : price - price
Mean-Bias : price - price moving average
Log transform : log(price/price moving average)
Correlation : correlation(price,n,period)
