Robust Scaled Dema | OquantOverview
The Robust Scaled DEMA indicator is a tool designed for traders seeking to identify potential trend directions in financial markets. It combines the smoothing capabilities of a Double Exponential Moving Average (DEMA) with a robust scaling mechanism to normalize the data, making it more resilient to outliers and extreme price movements. This scaling helps in generating long and short signals based on predefined thresholds, visualized through color-coded plots and bars. The indicator aims to provide a balanced view of market momentum, reducing the impact of noise while highlighting significant shifts in price behavior.
Key Factors/Components
DEMA (Double Exponential Moving Average): Serves as the core smoothing component, reducing lag compared to simple averages by emphasizing recent price action more effectively.
Robust Scaling Mechanism: Utilizes statistical measures like median and interquartile range to normalize the DEMA values, ensuring the indicator is less sensitive to extreme values or price spikes.
Thresholds: User-defined upper and lower levels that trigger long or short signals when the scaled DEMA crosses them.
Visual Elements: Includes plotted lines for the scaled DEMA and thresholds, plus color-coded candlestick bars for intuitive interpretation.
Alerts: Built-in conditions for notifying users of potential entry points for long or short positions.
How It Works
The indicator starts by applying a DEMA to the chosen price source to create a smoothed representation of the market's direction. This smoothed value is then scaled using a robust statistical approach that accounts for the distribution of recent DEMA values, centering it around a median and adjusting for variability to minimize the influence of outliers. The resulting scaled metric is compared against user-set upper and lower thresholds: crossing above the upper suggests a bullish momentum (long signal), while dipping below the lower indicates bearish conditions (short signal). A state variable tracks these conditions to color the chart accordingly, helping traders visualize regime changes. Optional alerts fire on transitions.
For Who Is Best/Recommended Use Cases
This indicator is ideal for traders who employ trend-following or momentum-based strategies and need tools that perform well in non-normal market conditions, such as during high volatility or in assets prone to spikes. Use cases include identifying entry/exit points in trending environments, confirming breakouts, or integrating into multi-indicator systems for added confirmation. Quantitative traders or those backtesting strategies will appreciate its customizable parameters for optimization.
Settings and Default Settings
Source: The price data input for calculations, such as close, open, high, or low. Default: close.
DEMA Length: Controls the period for the DEMA smoothing; shorter values increase responsiveness but may add noise, longer ones provide more lag but smoother signals. Default: 25.
Robust Scaling Length: Defines the lookback period for the scaling statistics; affects how adaptive the normalization is to recent data distributions. Default: 40.
Upper Threshold: The level above which a long signal is triggered; higher values make signals rarer but potentially more reliable. Default: 0.5.
Lower Threshold: The level below which a short signal is triggered; lower values allow for more aggressive bearish detection. Default: 0.
Conclusion
The Robust Scaled DEMA offers an outlier-resistant alternative to traditional moving average indicators, empowering traders to navigate volatile markets. By blending exponential smoothing with statistical robustness, it provides actionable insights into trend shifts while minimizing false positives from extreme events..
⚠️ Disclaimer: This indicator is intended for educational and informational purposes only. Trading/investing involves risk, and past performance does not guarantee future results. Always test and evaluate indicators/strategies before applying them in live markets. Use at your own risk.
Robust

Scalper's Volatility Filter [QuantraSystems]Scalpers Volatility Filter
Introduction
The 𝒮𝒸𝒶𝓁𝓅𝑒𝓇'𝓈 𝒱𝑜𝓁𝒶𝓉𝒾𝓁𝒾𝓉𝓎 𝐹𝒾𝓁𝓉𝑒𝓇 (𝒮𝒱𝐹) is a sophisticated technical indicator, designed to increase the profitability of lower timeframe trading.
Due to the inherent decrease in the signal-to-noise ratio when trading on lower timeframes, it is critical to develop analysis methods to inform traders of the optimal market periods to trade - and more importantly, when you shouldn’t trade.
The 𝒮𝒱𝐹 uses a blend of volatility and momentum measurements, to signal the dominant market condition - trending or ranging.
Legend
The 𝒮𝒱𝐹 consists of a signal line that moves above and below a central zero line, serving as the indication of market regime.
When the signal line is positioned above zero, it indicates a period of elevated volatility. These periods are more profitable for trading, as an asset will experience larger price swings, and by design, trend-following indicators will give less false signals.
Conversely, when the signal line moves below zero, a low volatility or mean-reverting market regime dominates.
This distinction is critical for traders in order to align strategies with the prevailing market behaviors - leveraging trends in volatile markets and exercising caution or implementing mean-reversion systems in periods of lower volatility.
Case Study
Here we can see the indicator's unique edge in action.
Out of the four potential long entries seen on the chart - displayed via bar coloring, two would result in losses.
However, with the power of the 𝒮𝒱𝐹 a trader can effectively filter false signals by only entering momentum-trades when the signal line is above zero.
In this small sample of four trades, the 𝒮𝒱𝐹 increased the win rate from 50% to 100%
Methodology
The methodology behind the 𝒮𝒱𝐹 is based upon three components:
By calculating and contrasting two ATR’s, the immediate market momentum relative to the broader, established trend is calculated. The original method for this can be credited to the user @xinolia
A modified and smoothed ADX indicator is calculated to further assess the strength and sustainability of trends.
The ‘Linear Regression Dispersion’ measures price deviations from a fitted regression line, adding further confluence to the signals representation of market conditions.
Together, these components synthesize a robust, balanced view of market conditions, enabling traders to help align strategies with the prevailing market environment, in order to potentially increase expected value and win rates.

RSI Volatility Bands [QuantraSystems]RSI Volatility Bands
Introduction
The RSI Volatility Bands indicator introduces a unique approach to market analysis by combining the traditional Relative Strength Index (RSI) with dynamic, volatility adjusted deviation bands. It is designed to provide a highly customizable method of trend analysis, enabling investors to analyze potential entry and exit points in a new and profound way.
The deviation bands are calculated and drawn in a manner which allows investors to view them as areas of dynamic support and resistance.
Legend
Upper and Lower Bands - A dynamic plot of the volatility-adjusted range around the current price.
Signals - Generated when the RSI volatility bands indicate a trend shift.
Case Study
The chart highlights the occurrence of false signals, emphasizing the need for caution when the bands are contracted and market volatility is low.
Juxtaposing this, during volatile market phases as shown, the indicator can effectively adapt to strong trends. This keeps an investor in a position even through a minor drawdown in order to exploit the entire price movement.
Recommended Settings
The RSI Volatility Bands are highly customisable and can be adapted to many assets with diverse behaviors.
The calibrations used in the above screenshots are as follows:
Source = close
RSI Length = 8
RSI Smoothing MA = DEMA
Bandwidth Type = DEMA
Bandwidth Length = 24
Bandwidth Smooth = 25
Methodology
The indicator first calculates the RSI of the price data, and applies a custom moving average.
The deviation bands are then calculated based upon the absolute difference between the RSI and its moving average - providing a unique volatility insight.
The deviation bands are then adjusted with another smoothing function, providing clear visuals of the RSI’s trend within a volatility-adjusted context.
rsiVal = ta.rsi(close, rsiLength)
rsiEma = ma(rsiMA, rsiVal, bandLength)
bandwidth = ma(bandMA, math.abs(rsiVal - rsiEma), bandLength)
upperBand = ma(bandMA, rsiEma + bandwidth, smooth)
lowerBand = ma(bandMA, rsiEma - bandwidth, smooth)
long = upperBand > 50 and not (lowerBand < lowerBand and lowerBand < 50)
short= not (upperBand > 50 and not (lowerBand < lowerBand and lowerBand < 50))
By dynamically adjusting to market conditions, the RSI trend bands offer a unique perspective on market trends, and reversal zones.

Least Median of Squares Regression | ymxbThe Least Median of Squares (LMedS) is a robust statistical method predominantly used in the context of regression analysis. This technique is designed to fit a model to a dataset in a way that is resistant to outliers. Developed as an alternative to more traditional methods like Ordinary Least Squares (OLS) regression, LMedS is distinguished by its focus on minimizing the median of the squares of the residuals rather than their mean. Residuals are the differences between observed and predicted values.
The key advantage of LMedS is its robustness against outliers. In contrast to methods that minimize the mean squared residuals, the median is less influenced by extreme values, making LMedS more reliable in datasets where outliers are present. This is particularly useful in linear regression, where it identifies the line that minimizes the median of the squared residuals, ensuring that the line is not overly influenced by anomalies.
STATISTICAL PROPERTIES
A critical feature of the LMedS method is its robustness, particularly its resilience to outliers. The method boasts a high breakdown point, which is a measure of an estimator's capacity to handle outliers. In the context of LMedS, this breakdown point is approximately 50%, indicating that it can tolerate corruption of up to half of the input data points without a significant degradation in accuracy. This robustness makes LMedS particularly valuable in real-world data analysis scenarios, where outliers are common and can severely skew the results of less robust methods.
Rousseeuw, Peter J.. “Least Median of Squares Regression.” Journal of the American Statistical Association 79 (1984): 871-880.
The LMedS estimator is also characterized by its equivariance under linear transformations of the response variable. This means that whether you transform the data first and then apply LMedS, or apply LMedS first and then transform the data, the end result remains consistent. However, it's important to note that LMedS is not equivariant under affine transformations of both the predictor and response variables.
ALGORITHM
The algorithm randomly selects pairs of points, calculates the slope (m) and intercept (b) of the line, and then evaluates the median squared deviation (mr2) from this line. The line minimizing this median squared deviation is considered the best fit.
DISCLAIMER
In the LMedS approach, a subset of the data is randomly selected to compute potential models (e.g., lines in linear regression). The method then evaluates these models based on the median of the squared residuals. Since the selection of data points is random, different runs may select different subsets, leading to variability in the computed models.
Simple Neural Network Transformed RSI [QuantraSystems]Simple Neural Network Transformed RSI
Introduction
The Simple Neural Network Transformed RSI (ɴɴᴛ ʀsɪ) stands out as a formidable tool for traders who specialize in lower timeframe trading.
It is an innovative enhancement of the traditional RSI readings with simple neural network smoothing techniques.
This unique blend results in fairly accurate signals, tailored for swift market movements. The ɴɴᴛ ʀsɪ is particularly resistant to the usual market noise found in lower timeframes, ensuring a clearer view of short-term trends.
Furthermore, its diverse range of visualization options adds versatility, making it a valuable tool for traders seeking to capitalize on short-duration market dynamics.
Legend
In the Image you can see the BTCUSD 1D Chart with the ɴɴᴛ ʀsɪ in Trend Following Mode to display the current trend. This is visualized with the barcoloring.
Its Overbought and Oversold zones start at 50% and end at 100% of the selected Standard Deviation (default σ = 2), which can indicate extremely rare situations which can lead to either a softening momentum in the trend or even a mean reversion situation.
Here you can also see the original Indicator line and the Heikin Ashi transformed Indicator bars - more on that now.
Notes
Quantra Standard Value Contents:
To draw out all the information from the indicator calculation we have added a Heikin-Ashi (HA) Candle Visualization.
This HA transformation smoothens out the indicator values and gives a more informative look into Momentum and Trend of the Indicator itself.
This allows early entries and exits by observing the HA transformed Indicator values.
To diversify, different visualization options are available, either a classic line, HA transformed or Hybrid, which contains both of the previous.
To make Quantra's Indicators as useful and versatile as possible we have created options
to change the barcoloring and thus the derived signal from the indicator based on different modes.
Option to choose different Modes:
Trend Following (Indicator above mid line counts as uptrend, below is downtrend)
Extremities (Everything going beyond the Deviation Bands in a Mean Reversion manner is highlighted)
Candles (Color of HA candles as barcolor)
Reversion (HA ONLY) (Reversion Signals via the triangles if HA candles change state outside of the Deviation Bands)
- Reversion Signals are indicated by the triangles in the Heikin-Ashi or Hybrid visualization when the HA Candles revert
from downwards to upwards or the other way around OUTSIDE of the SD Bands.
Depending on the Indicator they signal OB/OS areas and can either work as high probability entries and exits for Mean Reversion trades or
indicate Momentum slow downs and potential ranges.
Please use another indicator to confirm this.
Case Study
To effectively utilize the NNT-RSI, traders should know their style and familiarize themselves with the available options.
As stated above, you have multiple modes available that you can combine as you need and see fit.
In the given example mostly only the mode was used in an isolated fashion.
Trend Following:
Purely relied on State Change - Midline crossover
Could be combined with Momentum or Reversion analysis for better entries/exits.
Extremities:
Ideal entry/exit is in the accordingly colored OS/OB Area, the Reversion signaled the latest possible entry/exit.
HA Candles:
Specifically applicable for strong trends. Powerful and fast tool.
Can whip if used as sole condition.
Reversions:
Shows the single entry and exit bars which have a positive expected value outcome.
Can also be used as confirmation or as last signal.
Please note that we always advise to find more confluence by additional indicators.
Traders are encouraged to test and determine the most suitable settings for their specific trading strategies and timeframes.
In the showcased trades the default settings were used.
Methodology
The Simple Neural Network Transformed RSI uses a simple neural network logic to process RSI values, smoothing them for more accurate trend analysis.
This is achieved through a linear combination of RSI values over a specified input length, weighted evenly to produce a neural network output.
// Simple neural network logic (linear combination with weighted aggregation)
var float inputs = array.new_float(nnLength, na)
for i = 0 to nnLength - 1
array.set(inputs, i, rsi1 )
nnOutput = 0.0
for i = 0 to nnLength - 1
nnOutput := nnOutput + array.get(inputs, i) * (1 / nnLength)
nnOutput
This output is then compared against a standard or dynamic mean line to generate trend following signals.
Mean = ta.sma(nnOutput, sdLook)
cross = useMean? 50 : Mean
The indicator also incorporates Heikin Ashi candlestick calculations to provide additional insights into market dynamics, such as trend strength and potential reversals.
// Calculate Heikin Ashi representation
ha = ha(
na(nnOutput ) ? nnOutput : nnOutput ,
math.max(nnOutput, nnOutput ),
math.min(nnOutput, nnOutput ),
nnOutput)
Standard deviation bands are used to create dynamic overbought and oversold zones, further enhancing the tool's analytical capabilities.
// Calculate Dynamic OB/OS Zones
stdv_bands(_src, _length, _mult) =>
float basis = ta.sma(_src, _length)
float dev = _mult * ta.stdev(_src, _length)
= stdv_bands(nnOutput, sdLook,sdMult/2)
= stdv_bands(nnOutput, sdLook, sdMult)
The Standard Deviation bands take defined parameters from the user, in this case sigma of ideally between 2 to 3,
to help the indicator detect extremely improbable conditions and thus take an inversely probable signal from it to forward to the user.
The parameter settings and also the visualizations allow for ample customizations by the trader.
For questions or recommendations, please feel free to seek contact in the comments.

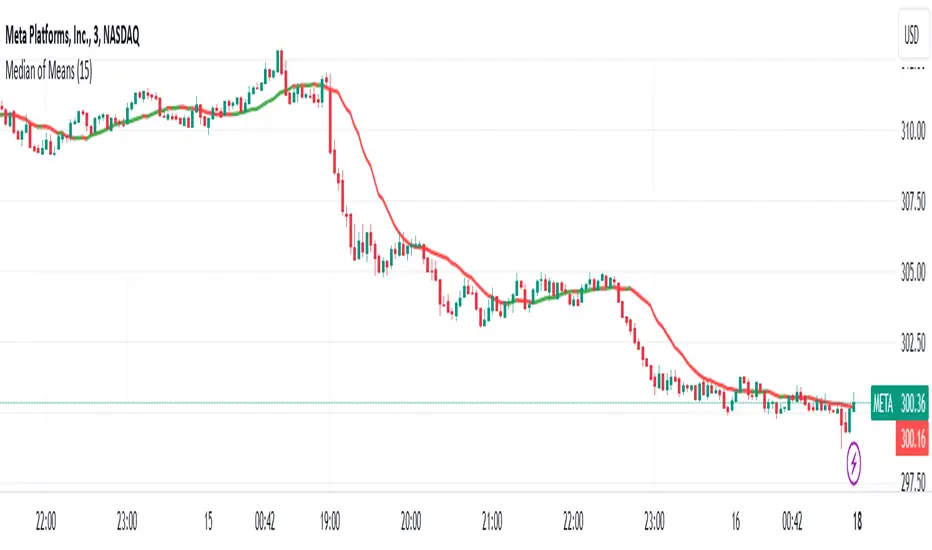
Median of Means Estimator Median of Means (MoM) is a measure of central tendency like mean (average) and median. However, it could be a better and robust estimator of central tendency when the data is not normal, asymmetric, have fat tails (like stock price data) and have outliers. The MoM can be used as a robust trend following tool and in other derived indicators.
Median of means (MoM) is calculated as follows, the MoM estimator shuffles the "n" data points and then splits them into k groups of m data points (n= k*m). It then computes the Arithmetic Mean of each group (k). Finally, it calculate the median over the resulting k Arithmetic Means. This technique diminishes the effect that outliers have on the final estimation by splitting the data and only considering the median of the resulting sub-estimations. This preserves the overall trend despite the data shuffle.
Below is an example to illustrate the advantages of MoM
Set A Set B Set C
3 4 4
3 4 4
3 5 5
3 5 5
4 5 5
4 5 5
5 5 5
5 5 5
6 6 8
6 6 8
7 7 10
7 7 15
8 8 40
9 9 50
10 100 100
Median 5 5 5
Mean 5.5 12.1 17.9
MoM 5.7 6.0 17.3
For all three sets the median is the same, though set A and B are the same except for one outlier in set B (100) it skews the mean but the median is resilient. However, in set C the group has several high values despite that the median is not responsive and still give 5 as the central tendency of the group, but the median of means is a value of 17.3 which is very close to the group mean 17.9. In all three cases (set A, B and C) the MoM provides a better snapshot of the central tendency of the group. Note: The MoM is dependent on the way we split the data initially and the value might slightly vary when the randomization is done sevral time and the resulting value can give the confidence interval of the MoM estimator.
Setting-Less Trend-Step FilteringIntroduction
Indicators settings have been a major concern in trading strategies, in order to provide the best results each indicators involved in the strategy must have its settings optimized, when using only 1 indicator this task can easily be achieved, but an increasing number of indicators involve more slower computations, lot of softwares will use brute force for indicators settings optimization, this involve testing each indicator settings and see which setting/combination maximize the equity, in order to fasten this process softwares can use a user defined range for the indicator settings. Nonetheless the combination that maximize the equity at time t might be different at time t+1...n .
Therefore i propose an indicator without any numerical setting that aim to filter small price variations using the architecture of the T-step lsma, such indicator can provide robust filtering and can therefore be used as input for other indicators.
Robustness Vs Non Robustness
Robustness is often defined as the ability of certain statistical tools to be less affected by outliers, outliers are defined as huge variations in a data-set, high volatility movements and large gaps might be considered as outliers. However here we define robustness as the ability of an indicator to be non affected by price variations that are not correlated with the main trend, which can be defined in technical analysis as pullbacks.
Some small pullbacks in INTEL, the indicator is not affected by them, which allow the indicator to filter the price in a "smart" way.
This effect is made possible by using exponential averaging in the indicator, exponential averaging is defined as y = sc*x + (1-sc)*y , with 1 > sc > 0 . Here sc is calculated in a similar way as the kalman gain, which is in the form of a/(a + b) , in our case this is done with :
sc = abs(input - nz(b ))/(abs(input - nz(b )) + nz(a ))
Non Robust Version Of The Indicator
The user is allowed to use the non robust version of the indicator by unchecking "robust" in the setting panel, this allow a better fit with the price at the cost of less filtering.
robust checked
robust unchecked
Conclusion
I proposed a technical indicator that aim to filter short frequencies without the use of parameters, the indicator proven to be robust to various pullbacks and therefore was able to follow the main trend, although using the term trend for such small price variations might be wrong. Removing high frequencies is always beneficial in trading, noisy series are harder to manipulate, this is why you'll see a lot of indicators using median price often defined as hl2 instead of the closing price.
Like previous settings-less indicators i published this one can behave differently depending on the time frame selected by the user, lower time frames will make the indicator filter more. I'll try to make more setting-less indicators that will correct this effect.
Acknowledgements
The support and interest of the community is only thing that allowed me to be where i'am today, i'am thankful. Special thanks to the tv staff, LucF, and my family who may not have believed in this project but are still proud of their son.

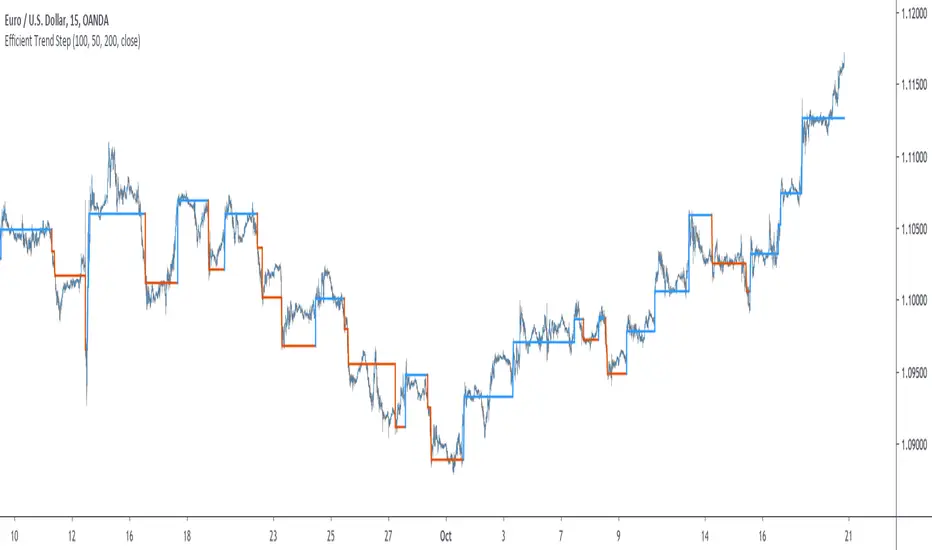
Efficient Trend Step - Spotting Trends EfficientlyIntroduction
The trend-step indicator (or auto-line) was based on volatility and aimed to spot trends in an adaptive way, however the indicator was only based on volatility and didn't gave much attention to the trend, later on i would publish an efficient version of it (efficient auto-line) based on the efficiency ratio who could adapt to the trend and eliminate potential whipsaws trades, however this approach included many settings that would require changes if the user switched markets, which reduce the utility of the indicator and make it actually super inefficient.
This is why i had to propose this indicator who remove all the flaws the efficient auto-line had without removing the core idea of it.
The Indicator
The indicator is based on recursion, when the price is superior/inferior to the indicator precedent value +/- volatility metric, then the indicator is equal to the closing price, this allow the indicator to fit the price relatively well. The volatility metric used is based on 2 standard deviations, one fast and one slow and the efficiency ratio, basically when price is trending the volatility metric will be closer to the value of the fast standard deviations, which would allow the indicator to be closer to the price, else the metric will be closer to the slow standard deviation which restrain the indicator from changing, therefore the volatility metric act as a threshold.
length control the period of the efficiency ratio, lower values of length will result in a volatility metric way closer to the fast standard deviation thus making the indicator more inclined toward making false signals.
Lower values for slow will make the indicator more reactive.
The indicator can be reactive but can also be really conservative, thus even remaining unchanged in some contrary movements of the main trend, this is called robustness and has its pro's and con's.
Conclusion
The trend-step indicators family might get to an end, or not, nonetheless they can provide precise entries and be extremely robust, which is great. Using low settings might prove to be useful to remove some noise. I hope this version find its use amongst the community. Thanks for reading !
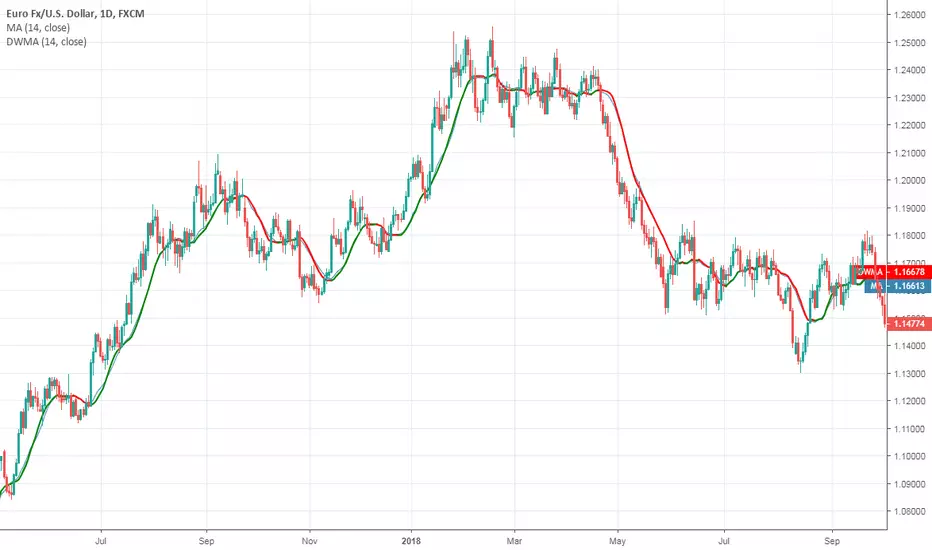
Distance Weighted Moving AverageAdopted to Pine from systemtradersuccess.com
They wrote that this average is designed to be a robust version of a moving average to reduce the impact of outliers, but I dont see a significant difference comparing it with SMA. So, I published it for the educational purposes.
To learn more about the robust filters and averages google Hampel Filter, Interquartile Range Filter and Recursive Median Filter (or any other filter that is based on quartiles).
Good luck!