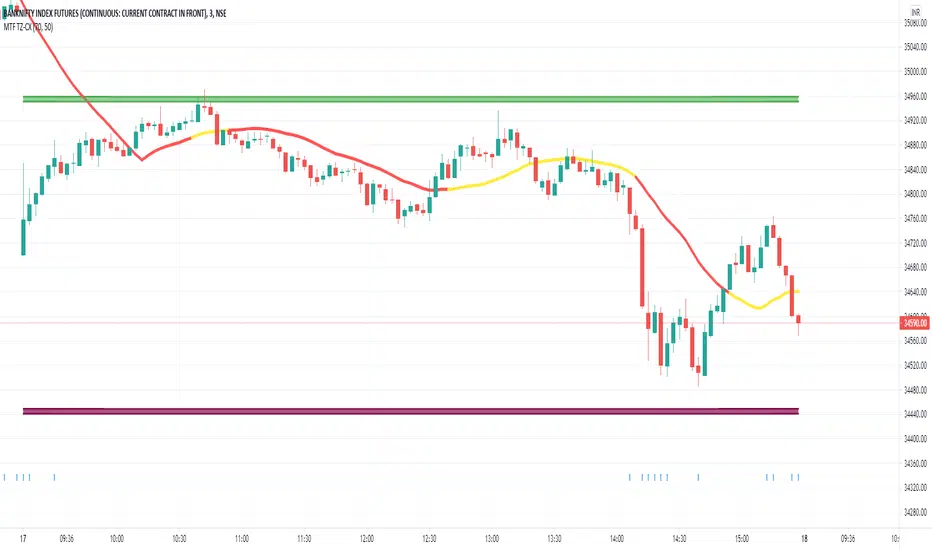
Multi Time Frame - Trend Analysis
How does it work ? Price movements over range of period is to compute the trend forward.
This script used SuperTrend (ST) , ATR and RSI to determine the trend and direction so that a buy sell decision can be made
To Indicate the strength of the trendline , RSI is computed over multiple timeframes and then used to in sync with SuperTrend to help determine the direction
The user can customise the RSI strength validation. So one the Super Trend and ATR Levels are matched , the RSI is validated before giving a BUY/SELL suggestion
Best Time Frames to use : Upto 15/30 Mins if using RSI based logic , user can use higher timeframe if the goal is to identify the trend and the use lower time frame to determine Buy/Sell
Where to use
Trend Indicator using Multi Time Frame Analysis to suggest a long or a short
The main use of this indicator is quick scalping and Intra-day trading.
The Indicator shows the option to show the Trend Zone and Buy/Sell Signals which the use can on or off
How to use
User Choices : To avoid false positives we have introduced a double check using RSI ,
it is defaulted to 60/ 40 - the users are free to change it as per their preferences
The system will not suggest a trade when the the counter in beyond the RSI limits
Stop Loss - That should be done by following ones risk appetite , Ideally the open/close of the previous candle should be the stop loss for the buy/sell
but everyone has their own Risk Management Strategies based on the capital deployed.
Disclaimer : There could be scenarios when the candle is shown as a long or short and then the candle turns into opposite direction red/green .
In such scenarios , Please refer to the just preceding candle and if this candle is moving into positive direction (forming green candle) only then buy ,
Similarly Sell/Short only if this candle is forming a red candle
How to get access
Please click on the link / email in the signature or send me a private message to get access
Feedback
Please click on the link/email in the signature or send me a private message for suggestions/feedbacks
Both Old SMA Based and New VWAP Based Trend lines Co Exist and the user can choose between what needs to be used ,
Both trend line continue to depict the strength based on the hybrid calculation of RS
The two new addons are VWMA 20 and the ability for the users to highlight candles which shows more than certain volume
This can be used to identify false breakouts where the price may momentarily move up the
trend lines but the lack of volume may lead to a return
Please share your comments and feedback in the comment area below
System will calculate the other numbers accordingly
Best Time Frame to use 3 Minutes
Tập lệnh chỉ hiển thị cho người được mời
Chỉ những người dùng được tác giả chấp thuận mới có thể truy cập tập lệnh này. Bạn sẽ cần yêu cầu và được cấp quyền sử dụng. Thông thường quyền này được cấp sau khi thanh toán. Để biết thêm chi tiết, làm theo hướng dẫn của tác giả bên dưới hoặc liên hệ trực tiếp với PortfolioBuddy.
TradingView KHÔNG khuyến nghị bạn trả phí hoặc sử dụng một tập lệnh trừ khi bạn hoàn toàn tin tưởng vào tác giả và hiểu cách hoạt động của tập lệnh. Bạn cũng có thể tìm các lựa chọn miễn phí, mã nguồn mở trong các script cộng đồng của chúng tôi.
Hướng dẫn của tác giả
Thông báo miễn trừ trách nhiệm
Tập lệnh chỉ hiển thị cho người được mời
Chỉ những người dùng được tác giả chấp thuận mới có thể truy cập tập lệnh này. Bạn sẽ cần yêu cầu và được cấp quyền sử dụng. Thông thường quyền này được cấp sau khi thanh toán. Để biết thêm chi tiết, làm theo hướng dẫn của tác giả bên dưới hoặc liên hệ trực tiếp với PortfolioBuddy.
TradingView KHÔNG khuyến nghị bạn trả phí hoặc sử dụng một tập lệnh trừ khi bạn hoàn toàn tin tưởng vào tác giả và hiểu cách hoạt động của tập lệnh. Bạn cũng có thể tìm các lựa chọn miễn phí, mã nguồn mở trong các script cộng đồng của chúng tôi.