Options Volume ProfileOptions Volume Profile
Introduction
Unlock institutional-level options analysis directly on your charts with Options Volume Profile - a powerful tool designed to visualize and analyze options market activity with precision and clarity. This indicator bridges the gap between technical price action and options flow, giving you a comprehensive view of market sentiment through the lens of options activity.
What Is Options Volume Profile?
Options Volume Profile is an advanced indicator that analyzes call and put option volumes across multiple strikes for any symbol and expiration date available on TradingView. It provides a real-time visual representation of where money is flowing in the options market, helping identify potential support/resistance levels, market sentiment, and possible price targets.
Key Features
Comprehensive Options Data Visualization
Dynamic strike-by-strike volume profile displayed directly on your chart
Real-time tracking of call and put volumes with custom visual styling
Clear display of important value areas including POC (Point of Control)
Value Area High/Low visualization with customizable line styles and colors
BK Daily Range Identification
Secondary lines marking significant volume thresholds
Visual identification of key strike prices with substantial options activity
Value Area Cloud Visualization
Configurable cloud overlays for value areas
Enhanced visual identification of high-volume price zones
Detailed Summary Table
Complete breakdown of call and put volumes per strike
Percentage analysis of call vs put activity for sentiment analysis
Color-coded volume data for instant pattern recognition
Price data for both calls and puts at each strike
Custom Strike Selection
Configure strikes above and below ATM (At The Money)
Flexible strike spacing and rounding options
Custom base symbol support for various options markets
Use Cases
1. Identifying Key Support & Resistance
Visualize where major options activity is concentrated to spot potential support and resistance zones. The POC and Value Area lines often act as magnets for price.
2. Analyzing Market Sentiment
Compare call versus put volume distribution to gauge directional bias. Heavy call volume suggests bullish sentiment, while heavy put volume indicates bearish positioning.
3. Planning Around Institutional Activity
Volume profile analysis reveals where professional traders are positioning themselves, allowing you to align with or trade against smart money.
4. Setting Precise Targets
Use the POC and Value Area High/Low lines as potential profit targets when planning your trades.
5. Spotting Unusual Options Activity
The color-coded volume table instantly highlights anomalies in options flow that may signal upcoming price movements.
Customization Options
The indicator offers extensive customization capabilities:
Symbol & Data Settings : Configure base symbol and data aggregation
Strike Selection : Define number of strikes above/below ATM
Expiration Date Settings : Set specific expiry dates for analysis
Strike Configuration : Customize strike spacing and rounding
Profile Visualization : Adjust offset, width, opacity, and height
Labels & Line Styles : Fully configurable text and visual elements
Value Area Settings : Customize POC and Value Area visualization
Secondary Line Settings : Configure the BK Daily Range appearance
Cloud Visualization : Add colored overlays for enhanced visibility
How to Use
Apply the indicator to your chart
Configure the expiration date to match your trading timeframe
Adjust strike selection and spacing to match your instrument
Use the volume profile and summary table to identify key levels
Trade with confidence knowing where the real money is positioned
Perfect for options traders, futures traders, and anyone who wants to incorporate institutional-level options analysis into their trading strategy.
Take your trading to the next level with Options Volume Profile - where price meets institutional positioning.
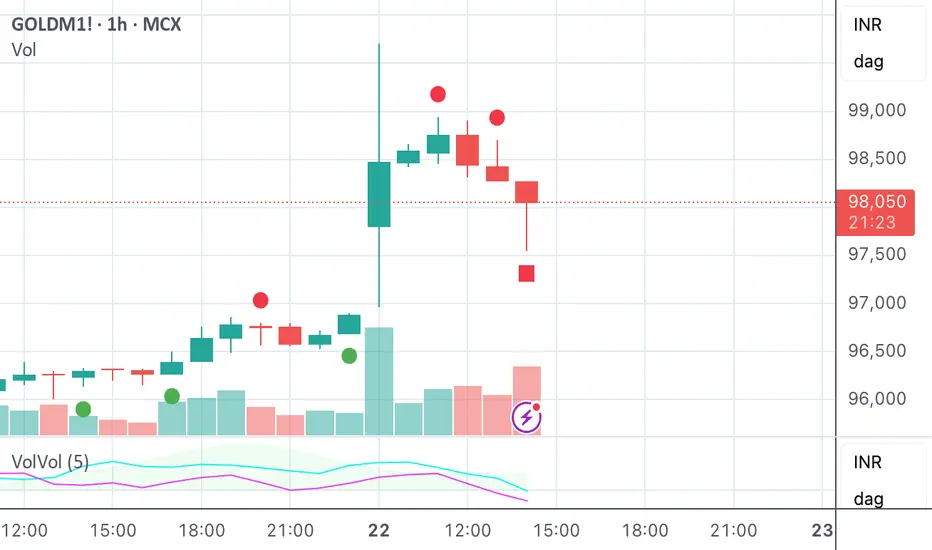
Khối lượng

VolVolVolVol: Volatility & Volume
The indicator consists of 3 oscillating components that are all represented on a positive/negative percentage scale.
Direction : Green/Red shaded area
Smoothened distance between Close and EMA of Close relative to StDev of Close
Intensity : Turquoise line
If direction = bullish: Smoothened distance between Low and EMA of Low relative to StDev of Low
If direction = bearish: Smoothened distance between High and EMA of High relative to StDev of High
Momentum : Fuchsia line
Double exponential average of bullish closing volume - bearish closing volume
The indicator provides the following signals on the candlestick charts based on the above components' movements.
Bullish position signals: Below candles
Bearish position signals: Above candles
Entry signal : Increase in all 3 factors or sharp increase in Intensity + Momentum
Add signal : Trend slowdown because of volume drop or retracement following a temporary consolidation
Exit signal : Increase in Intensity and Momentum against the prevailing trend direction
There may be simultaneous Bullish and Bearish signals. These should be treated as hedges for existing positions.
Volumen Extremo + SRThis indicator detects high-impact trading moments by combining:
Volume spikes (3x or 5x above average)
Strong candle bodies
Dynamic support/resistance zones (based on recent highs/lows)
It highlights key turning points in the market—whether due to whale take-profits, institutional exits, or breakout confirmations.
🔺 Green/Red Arrows:
Appear when volume is 3× the average and the candle has a significant body
→ Confirms strong market conviction (buy/sell)
🌟 Fuchsia Star:
Appears when volume exceeds 5× average with a large-bodied candle
→ Signals extreme moves, whale actions or liquidation spikes
🟩 Support Line (green):
Dynamic recent lowest price (lookback configurable)
→ Identifies zones where buyers previously stepped in
→ Identifies zones where buyers previously stepped in
🟥 Resistance Line (red):
Dynamic recent highest price (lookback configurable)
→ Shows zones where sellers previously dominated
Alerts Included:
Bullish breakout with volume
Bearish rejection with volume
Volume explosion alerts for extreme moves
Don't guide yourself by man uptrend if it doesn't have exceptional volume.
By Teo Mariscal

Trend Matrix Multi-Timeframe Dashboard(TechnoBlooms)Trend Matrix Multi-Timeframe Dashboard is a Minimalist Multi-Timeframe Trend Analyzer with Smart Indicator Integration. Trend Matrix MTF Dashboard is a clean, efficient, and visually intuitive trend analyzer built for traders who value simplicity without compromising on technical depth.
This dashboard empowers you to track trend direction across multiple timeframes using a curated set of powerful technical indicators—all from one compact visual panel. The design philosophy is simple: eliminate clutter, highlight trend clarity, and accelerate your decision-making process.
Key Features
✅ Minimalist Design with Maximum Insight
A compact dashboard view designed for clean charts and focused trading
Optimized layout shows everything you need—nothing you don’t
✅ Multi-Timeframe Access at a Glance
Instantly read the trend direction of selected indicators on multiple timeframes (e.g., 15m, 1h, 4h, 1D)
Customize the timeframe stack to fit scalping, intraday, swing, or positional strategies
✅ Robust Technical Indicators Built In
Each one is hand-picked for trend reliability:
MACD – Momentum and crossover confirmation
RSI – Overbought/oversold and directional shift
EMA – Dynamic support/resistance and trend bias
Bollinger Bands – Volatility structure and trend containment
PVT – Volume-Weighted Trend Confirmation
Supertrend – Price-following trend tracker
✅ Live Updates & Lightweight Performance
Built to update efficiently on every bar close
Minimal performance impact even with multiple timeframes active
By offering multi-timeframe (MTF) access to proven trend-following indicators, Trend Matrix helps you confidently align with the market’s dominant direction—without jumping between charts or analyzing indicators one by one.
This indicator offers customizable settings. The trader can choose the input parameters timeframes as per the choice.
Trend Matrix Multi-Timeframe Dashboard helps traders to identify trend based on technical indications. Trader can refer this while taking trading decisions.
🧠 Ideal For
Scalpers who need higher timeframe confirmation
Swing traders identifying clean entries aligned with the macro trend
Trend followers seeking clarity before committing capital
Price action & SMC traders validating market structure setups
Beginners who want a high-level trend guide without messy indicators

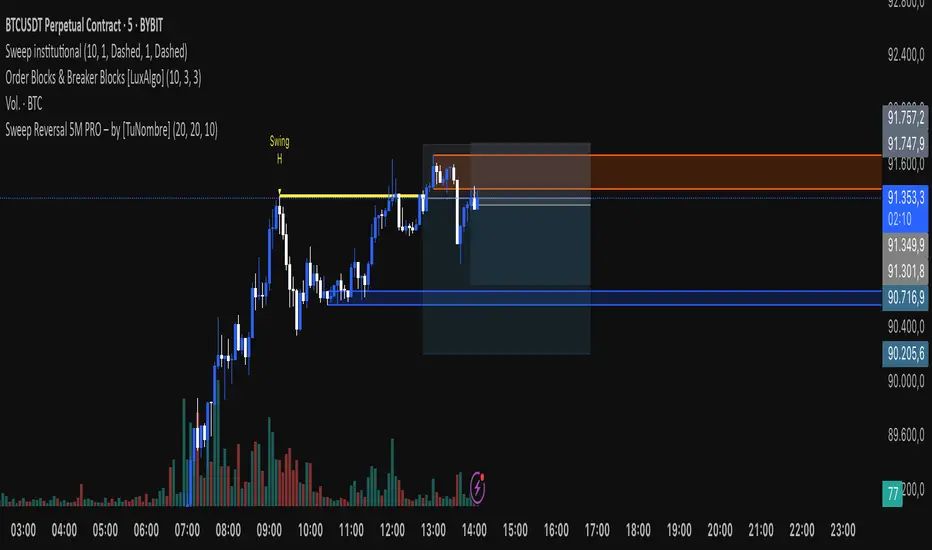
Sweep Reversal 5M PRO – by [TuNombre]🔹 **Sweep Reversal 5M PRO – by ** 🔹
This indicator is built to detect high-probability *Institutional Sweeps* using Swing Failure Patterns (SFP), fully filtered with Smart Money Concepts (SMC) logic and volume confirmation.
✅ Identifies key liquidity grabs
✅ Confirms with strong impulse candle + increasing volume
✅ Filters out false signals (doji, weak zones, low volume)
✅ Optimized for the 5-minute timeframe (5M)
✅ Compatible with push alerts to your mobile
---
**How to use it:**
1. Wait for a “BUY” or “SELL” signal on the chart
2. Only enter if the next candle confirms with momentum
3. Place a tight stop just beyond the sweep
4. Recommended Take Profit: 1:1 minimum / 2:1 ideal
---
💡 Inspired by institutional trading (SMC, ICT-style setups)
🔒 Developed by – private or team-based use
📲 Activate alerts to get real-time trade opportunities on your phone
---
⚠️ This script does not repaint.
Built for serious traders who want precision, not noise.
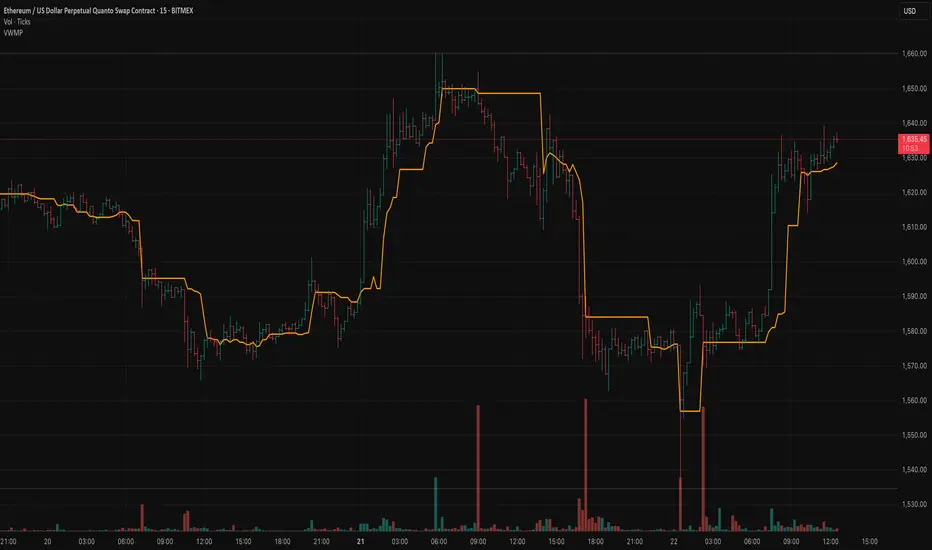
Volume Weighted Median Price (VWMP)The volume is indeed crucial for confirming price moves and understanding market conviction. While many traders are familiar with VWAP (Volume Weighted Average Price), this indicator introduces a lesser-known but powerful cousin: the Volume Weighted Median Price (VWMP).
What is VWMP?
Unlike VWAP, which calculates the average price weighted by volume over a period, VWMP identifies the median price level weighted by volume.
Think of it this way: If you line up all the trades within a specific lookback period, sorted by price, and then start accumulating the volume traded at each price level, the VWMP is the price level where 50% of the total volume occurred below it, and 50% occurred above it.
It essentially finds the "middle ground" of trading activity based on where the bulk of the volume actually traded, not just the average price.
Key Difference: VWMP vs. VWAP
VWAP: Volume Weighted Average Price. Sensitive to outliers (single large trades at extreme prices can skew the average).
VWMP: Volume Weighted Median Price. More robust to outliers. It represents the price that splits the period's volume distribution in half.
Because it uses the median, VWMP can sometimes provide a more stable or representative level of the "typical" price where significant volume is changing hands, especially in volatile markets or when large, anomalous trades occur.
How to Interpret and Use VWMP in trading
The VWMP plots as a line on your chart, similar to a moving average or VWAP. Here are a few ways traders might use it:
Dynamic Support and Resistance:
Like VWAP, the VWMP line can act as a dynamic level of interest.
Watch how price interacts with the VWMP. Consistent acceptance above VWMP might suggest bullish control and potential support.
Consistent rejection or acceptance below VWMP might indicate bearish control and potential resistance.
Trend Filter / Confirmation:
Uptrend: Look for price consistently staying above the VWMP line. Pullbacks to the VWMP that hold could offer entry opportunities.
Downtrend: Look for price consistently staying below the VWMP line. Rallies to the VWMP that fail could present shorting opportunities.
Use it to filter trades: Only take long trades if price is above VWMP, and short trades if below.
Mean Reversion Potential (Use with Caution):
When price extends significantly far away from the VWMP, some traders might look for potential reversion back towards this volume-based median level.
Important: This should not be used in isolation. Always look for confirmation from other indicators (like RSI, Stochastics, or candlestick patterns) before trading counter-trend reversions.
Confluence with Other Indicators:
VWMP works best when combined with other analysis tools.
Look for confluence: Does the VWMP align with a key Fibonacci level, a standard moving average, or a prior support/resistance zone? This confluence strengthens the level's potential significance.
Considerations
Lookback Period: The length input is crucial. A shorter period makes VWMP more responsive to recent action; a longer period makes it smoother and reflects longer-term volume distribution. Experiment to find what suits your timeframe and trading style.
Lagging Nature: Like all indicators based on past data, VWMP is inherently lagging. It reflects past volume distribution, not the future.
Market Context: Its effectiveness can vary depending on the market conditions (trending vs. ranging) and the asset being traded.
📊 Volume Split Buy/Sell | Copytrade TungdubaiThis Pine Script calculates the estimated buy and sell volume based on price action (relative position of the close within the price range of the candle) and plots the values on the chart. Additionally, it detects significant volume spikes by comparing the current volume to a 20-period moving average of volume.
Here’s a breakdown of what each section of the script does:
1. **Inputs and Variables:**
- `vol`: This variable holds the volume of the current candle.
- `body`: This calculates the absolute difference between the close and open prices (i.e., the body size of the candle).
- `price_range`: This is the range between the high and low of the candle.
- `buy_ratio`: This is the ratio of the candle's body above the close relative to the total range, representing buying pressure.
- `sell_ratio`: This is the inverse of `buy_ratio`, representing selling pressure.
2. **Volume Calculation:**
- `buy_volume`: The estimated buying volume is calculated as the total volume multiplied by the buying ratio.
- `sell_volume`: The estimated selling volume is calculated as the total volume multiplied by the selling ratio.
3. **Volume Plots:**
- The script plots the estimated selling volume in red below the baseline (`sell_volume`).
- The estimated buying volume is plotted in lime above the baseline (`buy_volume`).
4. **Volume Spike Detection:**
- `vol_ma`: This is the 20-period simple moving average of volume.
- `vol_spike`: This condition checks if the current volume is greater than 2.5 times the 20-period moving average of volume.
- If a volume spike is detected, a tiny purple circle is plotted at the bottom of the volume bar.
This script can be useful for visualizing the relative strength of buy and sell volumes, as well as detecting unusual volume spikes that might signal significant market activity.

Relative Strength IndexHere, RSI and Volume are used side by side. When the orange middle band is crossed upwards by the RSI lines, it indicates an upward direction, while a downward cross suggests a downward trend.
The RSI 70 level is a critical zone that indicates the stock is overbought and should be approached with caution. RSI 30 and below suggest the stock is oversold and potential buyers may start to appear in these areas.

Advanced Order Flow Indicatorbest order flow indicator can be used with i types of indicators and is best with 1 hour time frame

Bubbles Volume Delta V2English Version
Introduction
Bubbles Volume Delta V2 is an advanced volume analysis indicator for TradingView that visualizes trading volume as bubbles on your chart. It combines volume visualization with delta analysis, support/resistance detection, and VWAP (Volume-Weighted Average Price) to provide comprehensive volume insights for more informed trading decisions.
Key Features
Volume Bubbles: Displays volume as differently sized bubbles at price levels
Up/Down Volume Analysis: Analyzes buying vs selling pressure using lower timeframe data
Delta Divergence Detection: Identifies when price direction contradicts volume delta
Support/Resistance Levels: Automatically detects potential support/resistance based on volume imbalance
VWAP Integration: Displays VWAP with customizable anchoring and deviation bands
Setup Instructions
Add the indicator to your chart from the Indicators & Strategies menu
Adjust settings in the various sections according to your preferences
Verify that your chart has volume data available (some symbols may not provide volume)
Settings Guide
Bubbles Volume Settings
Show Bubbles: Toggle bubble visualization on/off
Threshold: Minimum normalized volume to display bubbles (lower = more bubbles)
Bubble Color: Default color for volume bubbles
Volume Label Size: Size of text labels showing volume information
Label Display Options: Control which bubble sizes display text labels
Delta Divergence Settings
Show Delta Divergence: Toggle divergence detection on/off
Delta Significance (%): Minimum percentage for significant delta
Bullish/Bearish Signal: Colors for divergence signals
Dynamic Triangle Size: Scale triangle size based on divergence magnitude
Divergence Thresholds: Configure levels for weak, moderate, and strong divergence signals
Support/Resistance Settings
Show Support/Resistance Levels: Toggle display of S/R levels
Imbalance Threshold: Required imbalance ratio for level detection
Max Levels to Display: Limit the number of lines shown
Extend Lines to Right: Continue lines to the right edge of the chart
Support/Resistance Colors and Styles: Visual appearance customization
Up/Down Volume Settings
Use Custom Timeframe: Override automatic timeframe selection
Show Up/Down Info: Display buying/selling volume breakdown on bubbles
Color Bubbles by Direction: Use green/red based on delta direction
VWAP Settings
Show VWAP: Toggle VWAP line display
VWAP Anchor: Choose when VWAP calculations reset (Session/Week/Month/Year)
Show VWAP Bands: Display standard deviation bands around VWAP
Bands Multiplier: Adjust the width of deviation bands
Number of Bands: How many deviation bands to display (1-4)
Line Style Settings: Customize colors, widths, and styles
How to Interpret the Indicator
Volume Bubbles
Size: Larger bubbles indicate higher relative volume
Color: Green indicates buying pressure, red indicates selling pressure
Labels: Show precise volume figures and up/down breakdown
Divergence Signals
▲ (Blue Triangle): Bullish divergence - price moving down but buying pressure detected
▼ (Red Triangle): Bearish divergence - price moving up but selling pressure detected
Triangle Size: Larger triangles indicate stronger divergence
Support/Resistance Lines
Green Lines: Support levels with buying pressure
Red Lines: Resistance levels with selling pressure
Percentage Labels: Show the imbalance ratio strength
VWAP
Main Line: Average price weighted by volume
Bands: Standard deviation ranges showing potential support/resistance zones
Best Practices
Use on liquid markets with reliable volume data
Combine with price action analysis for confirmation
Adjust thresholds based on the specific market's volatility
Use lower timeframes for short-term trading and higher timeframes for swing trading
Pay attention to divergences at key price levels
Troubleshooting
No Volume Data: Ensure your selected symbol provides volume information
Missing Up/Down Volume: Some exchanges or symbols may not provide lower timeframe data
Performance Issues: Reduce the number of displayed levels or use larger timeframes
中文版本
介绍
Bubbles Volume Delta V2 是一个高级交易量分析指标,用于 TradingView 平台,将交易量以气泡形式直观显示在图表上。它结合了交易量可视化、Delta分析、支撑/阻力检测和 VWAP(成交量加权平均价格),为您提供全面的交易量洞察,帮助做出更明智的交易决策。
主要功能
交易量气泡:在价格水平上显示不同大小的交易量气泡
上涨/下跌交易量分析:使用低时间周期数据分析买卖压力
Delta 背离检测:识别价格方向与交易量 Delta 相矛盾的情况
支撑/阻力水平:根据交易量不平衡自动检测潜在支撑/阻力位
VWAP 集成:显示可自定义锚点和偏差带的 VWAP
设置指南
从指标与策略菜单将指标添加到您的图表
根据您的偏好调整各部分设置
确认您的图表有可用的交易量数据(某些交易品种可能不提供交易量)
设置指南
交易量气泡设置
显示气泡:开启/关闭气泡可视化
阈值:显示气泡的最小归一化交易量(越低 = 越多气泡)
气泡颜色:交易量气泡的默认颜色
交易量标签大小:显示交易量信息的文本标签大小
标签显示选项:控制哪些气泡大小显示文本标签
Delta 背离设置
显示 Delta 背离:开启/关闭背离检测
Delta 显著性 (%):显著 Delta 的最小百分比
看涨/看跌信号:背离信号的颜色
动态三角形大小:根据背离幅度调整三角形大小
背离阈值:配置弱、中等和强背离信号的水平
支撑/阻力设置
显示支撑/阻力水平:开启/关闭支撑/阻力水平显示
不平衡阈值:水平检测所需的不平衡比率
最大显示水平数:限制显示的线条数量
向右延伸线条:线条延伸至图表右侧边缘
支撑/阻力颜色和样式:视觉外观自定义
上涨/下跌交易量设置
使用自定义时间周期:覆盖自动时间周期选择
显示上涨/下跌信息:在气泡上显示买卖交易量细分
按方向着色气泡:根据 Delta 方向使用绿色/红色
VWAP 设置
显示 VWAP:开启/关闭 VWAP 线显示
VWAP 锚点:选择 VWAP 计算何时重置(盘中/周/月/年)
显示 VWAP 带:显示 VWAP 周围的标准偏差带
带乘数:调整偏差带的宽度
带数量:显示多少条偏差带(1-4)
线条样式设置:自定义颜色、宽度和样式
如何解读指标
交易量气泡
大小:更大的气泡表示更高的相对交易量
颜色:绿色表示买入压力,红色表示卖出压力
标签:显示精确的交易量数字和上涨/下跌细分
背离信号
▲(蓝色三角形):看涨背离 - 价格下移但检测到买入压力
▼(红色三角形):看跌背离 - 价格上移但检测到卖出压力
三角形大小:更大的三角形表示更强的背离
支撑/阻力线
绿线:有买入压力的支撑位
红线:有卖出压力的阻力位
百分比标签:显示不平衡比率强度
VWAP
主线:按交易量加权的平均价格
带:显示潜在支撑/阻力区域的标准偏差范围
最佳实践
在具有可靠交易量数据的流动性市场上使用
结合价格动作分析进行确认
根据特定市场的波动性调整阈值
短期交易使用低时间周期,摇摆交易使用高时间周期
注意关键价格水平的背离
故障排除
无交易量数据:确保您选择的交易品种提供交易量信息
缺少上涨/下跌交易量:某些交易所或交易品种可能不提供低时间周期数据
性能问题:减少显示的水平数量或使用更大的时间周期

HVC + levelsPersistent HVC Rays Across All Intraday
Identify and carry forward the open, close, high and low of the highest‑volume daily candle as true horizontal support/resistance levels across every intraday timeframe – including pre‑market and after‑hours.
Description
This indicator automatically detects the single highest‑volume daily bar over your specified lookback period and then plots four persistent horizontal rays at that candle’s open, close, high, and low. Rays are anchored precisely at the New York Stock Exchange’s 09:30 ET bar using IANA timezone timestamps and extend to the right edge of your chart viewport, ensuring they remain visible on 1 min, 5 min, 15 min, hourly, and daily timeframes alike. You can also color intraday high‑volume bars for quick visual context. Store up to Max HVCs of past levels and watch older lines fade, delivering a dynamic volume‑driven support/resistance framework that adapts as new high‑volume days emerge.
Key Inputs
Lookback Period (bars): Number of bars to search for the highest‑volume daily candle.
Max HVCs: Maximum number of past HVC days whose levels remain plotted.
Color Intraday HVC Bars: Toggle to highlight intraday bars that match the highest recent volume.
Plot Persistent Rays: Toggle the horizontal levels on/off for a clean chart.

🔺 P&F Patterns with SL/TP + ConfidenceSee signals (BUY/SELL) on the chart
See dashed TP/SL levels based on the pattern breakout
Have confidence scores for each pattern
Detect core P&F patterns (Double/Triple Top/Bottom, Catapults)

BRKT SMART - VWAPVolumeCVDOI (Agg BINANCE OKX)This script is a powerful breakout detection tool designed to capture real market intent by combining VWAP structure, volume surges, and derivatives market data from multiple top-tier exchanges (BINANCE + OKX).
It identifies:
✅ True breakouts with confirmation from volume, Open Interest delta (OIΔ), and directional aggression (CVD)
⚠️ Fake breakouts (traps) where the market lacks new commitment (negative OIΔ and counter-pressure)
🔁 Retests after breakout to help time re-entries or add-ons
🔍 Key Features:
🧠 Aggregated OI & Volume from BINANCE and OKX for a more accurate picture of institutional activity
⚙️ Fully customizable thresholds for volume, OIΔ, and CVD delta
🎯 Optional cooldown between signals to avoid noise
📉 Visual markers for:
Breakouts (BRK↑ / BRK↓)
Traps (FAL↑ / FAL↓)
Retests (Ret↑ / Ret↓)
🟦 VWAP as central structure reference
🔧 Parameters You Can Adjust:
Volume strength (x times the average)
Minimum/maximum thresholds for OIΔ and CVD
Cooldown time between signals
Pullback detection window

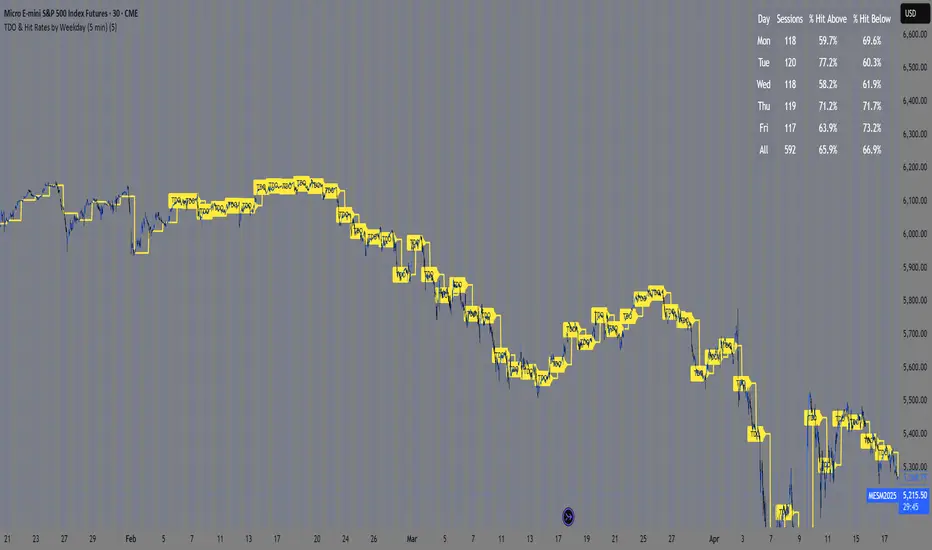
TDO & Hit Rates by Weekday (5 min)Purpose
Tracks how often the next NY session “hits” the previous day’s True Day Open (TDO) level, separately for sessions that open above vs. below TDO, and breaks the statistics down by weekday (Mon–Fri) plus an overall summary.
Key Features
True Day Open (TDO) Plot
Captures the prior day’s 23:00 CT close price as the TDO.
Plots it as a continuous yellow line across your chart.
Session Labeling
At the end of each NY session (08:30–15:00 CT), places a small “TDO” label at the TDO price to confirm visually where it lay during that day.
Hit‑Count Logic
For each 5 min bar in the NY session, checks if the bar’s high ≥ TDO ≥ low (i.e. the TDO level was “hit”).
Classifies each session by whether its opening price (first 5 min bar) was above or below the TDO.
Weekday Statistics Table
Displays in the bottom‑left of your main chart window.
Rows: Header, Mon, Tue, Wed, Thu, Fri, All.
Columns:
% Hit Above: % of “above‑TDO” sessions that saw at least one hit
% Hit Below: % of “below‑TDO” sessions that saw at least one hit
Automatically updates in real time as new sessions complete.
Inputs & Settings
Data Resolution: Default = 5 min; use any intraday timeframe you like (1, 3, 15 min, etc.).
Extended Hours: Make sure your chart’s Extended Session (overnight) is enabled so the 23:00 CT bar exists.
Overlay: Draws directly on your price chart (no separate pane).
How to Use
Add to Chart: Paste the Pine v5 code into TradingView’s editor and apply to your ES (or other) futures chart.
Enable Overnight Bars: In Chart Settings → Symbol/Session → include Extended Hours.
Select Timeframe: Set the chart (or the indicator’s “Data Resolution” input) to 5 min (or your preferred intraday).
Read the Table:
Each weekday row shows how reliable TDO touches have been historically, separately for “above” and “below” opens.
The bottom “All” row summarizes combined performance.
What You Learn
Edge Analysis: Do sessions opening above TDO tend to test that level more often than those opening below (or vice versa)?
Day‑of‑Week Bias: Are certain weekdays more prone to TDO retests?
Overall Confidence: The “All” row lets you see your full-sample hit‑rate on both sides.

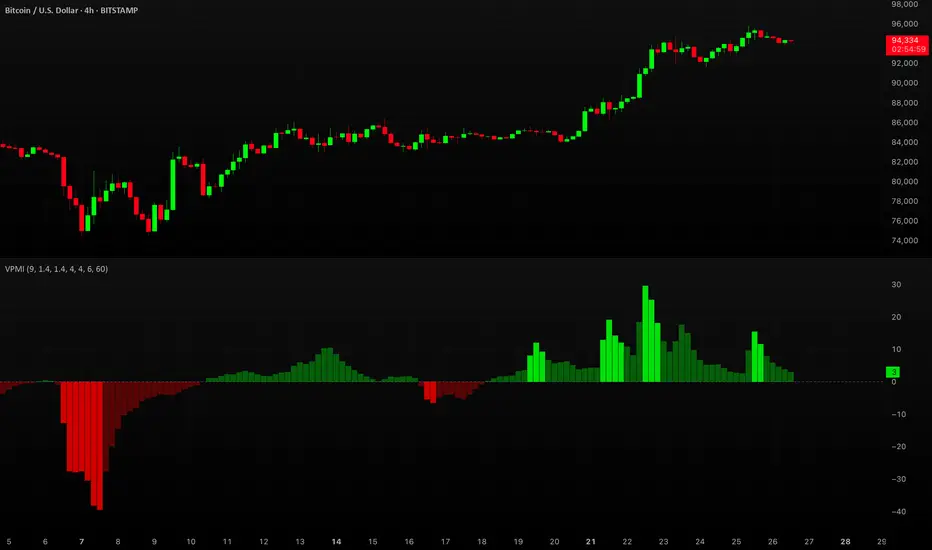
Volume-Price Momentum IndicatorVolume-Price Momentum Indicator (VPMI)
Overview
The Volume-Price Momentum Indicator (VPMI), developed by Kevin Svenson , is a powerful technical analysis tool designed to identify strong bullish and bearish momentum in price movements, driven by volume dynamics. By analyzing price changes and volume surges over a user-defined lookback period, VPMI highlights potential trend shifts and continuation patterns through a smoothed histogram, optional labels, and background highlights. Ideal for traders seeking to capture momentum-driven opportunities, VPMI is suitable for various markets, including stocks, forex, and cryptocurrencies.
How It Works
VPMI calculates the difference between volume-weighted buying and selling pressure based on price changes over a specified lookback period. It amplifies signals during high-volume periods, applies smoothing to reduce noise, and uses momentum checks to detect sustained trends.
Indicator display:
A histogram that oscillates above (bullish) or below (bearish) a zero line, with brighter colors indicating stronger momentum and faded colors for weaker signals.
Optional labels ("Bullish" or "Bearish") to mark significant momentum shifts.
Optional background highlights to visually emphasize strong trend conditions.
Alerts to notify users when strong bullish or bearish momentum is detected.
Key Features
Customizable Settings:
Adjust the lookback period, volume threshold, momentum length, and smoothing to suit your trading style.
Volume Sensitivity:
Emphasizes price movements during high-volume surges, enhancing signal reliability.
Momentum Detection: Uses linear regression and momentum change to confirm sustained trends, reducing false signals.
Visual Clarity:
Offers a clear histogram with color-coded signals, plus optional labels and backgrounds for enhanced chart readability.
Alerts:
Configurable alerts for strong momentum signals, enabling timely trade decisions.
Inputs and Customization
Lookback Period (Default: 9):
Sets the number of bars to analyze price changes. Higher values smooth signals but may lag.
Volume Threshold (Default: 1.4):
Defines the volume level (relative to a 20-period SMA) that qualifies as a surge, amplifying signals.
High Volume Multiplier (Default: 1.5):
Boosts histogram values during high-volume periods for stronger signals.
Histogram Smoothing Length (Default: 4):
Controls the EMA smoothing applied to the histogram, reducing noise.
Momentum Check Length (Default: 4):
Sets the period for momentum trend analysis (recommended to be less than Lookback Period).
Momentum Threshold (Default: 6):
Defines the minimum momentum change required for strong signals.
Show Labels (Default: Off):
Toggle to display "Bullish" or "Bearish" labels on significant momentum shifts.
Show Backgrounds (Default: Off):
Toggle to highlight chart backgrounds during strong momentum periods.
Bullish/Bearish Colors:
Customize colors for bullish (default: green) and bearish (default: red) signals.
Faded Transparency (Default: 40):
Adjusts the transparency of weaker signals for visual distinction.
How to Use
Interpret Signals:
Above Zero (Green):
Indicates bullish momentum. Bright green suggests strong, sustained buying pressure.
Below Zero (Red):
Indicates bearish momentum. Bright red suggests strong, sustained selling pressure.
Faded Colors:
Weaker momentum, potentially signaling consolidation or trend exhaustion.
Enable Visuals:
Turn on "Show Labels" and "Show Backgrounds" in the settings for additional context on strong momentum signals.
Set Alerts:
Use the built-in alert conditions ("Strong Bullish Momentum" or "Strong Bearish Momentum") to receive notifications when significant trends emerge.
Combine with Other Tools:
Pair VPMI with support/resistance levels, trendlines, or other indicators (e.g., RSI, MACD) for confirmation.
Best Practices
Timeframe:
VPMI works on all timeframes, but shorter timeframes (e.g., 5m, 15m) may produce more signals, while longer timeframes (e.g., 1h, 4h, 1D) offer higher reliability.
Market Conditions:
Most effective in trending markets. In choppy or sideways markets, consider increasing the smoothing length or momentum threshold to filter noise.
Risk Management:
Always use VPMI signals in conjunction with a robust trading plan, including stop-losses and position sizing.
Limitations
Lagging Nature:
As a momentum indicator, VPMI may lag in fast-moving markets due to smoothing and lookback calculations.
False Signals:
In low-volume or ranging markets, signals may be less reliable. Adjust the volume threshold or momentum settings to improve accuracy.
Customization Required:
Optimal settings vary by asset and timeframe. Experiment with inputs to align with your trading strategy.
Why Use VPMI?
VPMI offers a unique blend of volume and price momentum analysis, making it a versatile tool for traders seeking to identify high-probability trend opportunities. Its customizable inputs, clear visuals, and alert capabilities empower users to tailor the indicator to their needs, whether for day trading, swing trading, or long-term analysis.
Get Started
Apply VPMI to your chart, tweak the settings to match your trading style, and start exploring momentum-driven opportunities. For questions or feedback, consult TradingView’s community forums or documentation. Happy trading!
A/E/VWAPA/E/VWAP Indicator Description
The A/E/VWAP (Anchor/Event VWAP) indicator is a versatile tool for traders, designed to calculate and display the Volume Weighted Average Price (VWAP) anchored to specific time periods or events. It supports customizable anchor periods, such as sessions, weeks, months, or significant events like earnings, dividends, splits, or the third Friday of the month (commonly associated with options expiration for SPY). The indicator also includes optional upper and lower bands, which can be calculated using either standard deviation or percentage-based methods, providing additional context for price action relative to the VWAP.
Key Features:
Customizable Anchor Periods:
Choose from a variety of anchor periods: Session, Week, Month, Quarter, Year, Decade, Century, Earnings, Dividends, Splits, or ThirdFriday (specifically for SPY or quarterly options expiration).
Automatically defaults to "Earnings" for non-intraday charts (except for SPY, which uses "ThirdFriday") and "Session" for intraday charts.
Supports event-driven VWAPs by anchoring to earnings, dividends, or splits data when available.
Flexible Source Input:
The VWAP calculation uses a user-defined price source (default: HLC3, the average of high, low, and close prices).
Allows customization to suit different trading strategies.
Offset Adjustment:
Apply an offset to shift the VWAP and bands forward or backward on the chart for better visualization or strategy alignment.
Configurable Bands:
Optionally display up to three sets of upper and lower bands around the VWAP.
Bands can be calculated using:
Standard Deviation: Measures volatility relative to the VWAP.
Percentage: Uses a percentage of the VWAP value (e.g., a multiplier of 1 = 1% deviation).
Each band set has a customizable multiplier (default: 1.0, 2.0, 3.0) to adjust the distance from the VWAP.
Bands are color-coded (green, olive, teal) with transparent fills for easy identification.
Visual and Performance Features:
The VWAP line is plotted in blue (#2962FF) for clear visibility.
Bands are optionally displayed with customizable visibility and color-coded fills for better chart clarity.
Includes error handling for cases where volume data is unavailable from the data vendor.
Use Cases:
Intraday Trading: Anchor the VWAP to the start of the trading session to identify key support/resistance levels.
Swing Trading: Use longer-term anchors (e.g., Week, Month, or Quarter) to track broader price trends.
Event-Based Trading: Anchor the VWAP to earnings, dividends, or splits to analyze price behavior around significant corporate events.
Options Trading: Use the "ThirdFriday" anchor for SPY to monitor VWAP levels during options expiration weeks.
Volatility Analysis: Enable bands to gauge price deviations and identify overbought/oversold conditions.
Settings:
VWAP Settings:
Anchor Period: Select the time or event to anchor the VWAP (e.g., Session, Earnings, ThirdFriday).
Source: Choose the price input for VWAP calculation (default: HLC3).
Offset: Shift the VWAP and bands by a specified number of bars (default: 0).
Bands Settings:
Bands Calculation Mode: Choose between Standard Deviation or Percentage for band calculations.
Bands Multiplier #1, #2, #3: Set the multiplier for each band set (default: 1.0, 2.0, 3.0).
Show Bands: Toggle visibility for each band set individually.
Notes:
The indicator requires volume data to function correctly. If no volume is provided, an error message will be displayed.
Event-based anchors (Earnings, Dividends, Splits) rely on data availability from the data vendor.
The "ThirdFriday" anchor is particularly useful for SPY or instruments tied to quarterly options expiration cycles.
This indicator is ideal for traders seeking a flexible VWAP tool that adapts to both time-based and event-driven trading strategies, with customizable bands to enhance price analysis.

Akshay - TheOne, TheMostWanted, TheUnbeatable, TheEnd➤ All-in-One Solution (❌ No repaint):
This Technical Chart contains, MA24 Condition, Supertrend Indicator, HalfTrend Signal, Ichimoku Cloud Status, Parabolic SAR (P_SAR), First 5-Minute Candle Analysis (ORB5min), Volume-Weighted Moving Average (VWMA), Price-Volume Trend (PVT), Oscillator Composite, RSI Condition, ADX & Trend Strength.
Technicals don't lie.
🚀 Overview and Key Features
Comprehensive Multi-Indicator Approach:
The script is built to be an all-in-one technical indicator on TradingView. It integrates several well-known indicators and overlays—including Supertrend, HalfTrend, Ichimoku Cloud, various moving averages (EMA, SMA, VWMA), oscillators (Klinger, Price Oscillator, Awesome Oscillator, Chaikin Oscillator, Ultimate Oscillator, SMI Ergodic Oscillator, Chande Momentum Oscillator, Detrended Price Oscillator, Money Flow Index), ADX, and Donchian Channels—to create a composite picture of market sentiment.
Signal Generation and Alerts:
It not only calculates these indicators but also aggregates their output into “Master Candle” signals. Vertical lines are drawn on the chart with corresponding alerts to indicate potential buy or sell opportunities based on robust, combined conditions.
Visual Layering:
Through the use of colored histograms, custom candle plots, trend lines, and background color changes, the script offers a multi-layered visual representation of data, providing clarity about both short-term signals and overall market trends.
⚙️ How It Works and Functionality
MA24 Condition:
Uses the 24-period moving average as a proxy; if the price is above it, the bar is colored green, and red if below, with neutrality when conditions aren’t met.
Supertrend Indicator:
Evaluates price relative to the Supertrend level (calculated via ATR), coloring green when price is above it and red when below.
HalfTrend Signal:
Determines trend shifts by comparing the current close to a calculated trend level; green indicates an upward trend, while red suggests a downtrend.
Ichimoku Cloud Status:
Analyzes the relationship between the Conversion and Base lines; a bullish (green) signal is given when price is above both or the Conversion line is higher than the Base line.
Parabolic SAR (P_SAR):
Colors the signal based on whether the current price is above (green) or below (red) the Parabolic SAR marker, indicating stop and reverse conditions.
First 5-Minute Candle Analysis (ORB5min):
Uses key levels from the first 5-minute candle; if price exceeds the candle’s low, VWAP, and MA, it’s bullish (green), otherwise bearish (red).
Volume-Weighted Moving Average (VWMA):
Compares the current price to volume-weighted averages; a price above these levels is shown in green, below in red.
Price-Volume Trend (PVT):
Determines bullish or bearish momentum by comparing PVT to its VWAP—green when above and red when below.
Oscillator Composite:
Aggregates signals from multiple oscillators; a majority of positive results turn it green, while negative dominance results in red.
RSI Condition:
Uses a simple RSI threshold of 50, with values above signifying bullish (green) momentum and below marking bearish (red) conditions.
ADX & Trend Strength:
Reflects overall trend strength through ADX and directional movements; a combination favoring bullish conditions colors it green, with red signaling bearish pressure.
Master Candle Overall Signal:
Combines multiple indicator outputs into one “Master” signal—green for a consensus bullish trend and red for a bearish outlook.
Scalp Signal Variation:
Focused on short-term price changes, this signal adjusts quickly; green indicates improving short-term conditions, while red signals a downturn.
📊 Visualizations and 🎨 User Experience (❌ no repaint)
Dynamic Histograms & Bar Plots:
Each indicator is represented as a colored bar (with added vertical offsets) to facilitate easy comparison of their respective bullish or bearish contributions.
Clear Color-Coding & Labels:
Green (e.g., GreenFluorescent) indicates bullish sentiment.
Red (e.g., RedFluorescent) indicates bearish sentiment.
Custom labels and descriptive text accompany each bar for clarity.
Interactive Charting:
The overall background color adapts based on the “Master Candle” condition, offering an instant read on market sentiment.
The current candlestick is overlaid with color cues to reinforce the indicator’s signal, enhancing the trading experience.
Real-Time Alerts:
Vertical lines appear on signal events (buy/sell triggers), complemented by alerts that help traders stay on top of actionable market moves.
Sharp lines:
The Sharp lines are plotted based upon the EMA5 cross over with the same market trend, marks this as good time to reentry.
🔧 Settings and Customization
Flexible Timeframe Input:
Users can select their preferred timeframe for analysis, making the indicator adaptable to intraday or longer-term trading styles.
Customizable Indicator Parameters:
➤ Supertrend: Adjust ATR length and multiplier factors.
➤ HalfTrend: Tweak amplitude and channel deviation settings.
➤ Ichimoku Cloud & Oscillators: Fine-tune the conversion/base lines and oscillator lengths to match individual trading strategies.
Visual Customization:
The script’s color schemes and plotting styles can be altered as needed, giving users the freedom to tailor the interface to their taste or existing chart setups.
🌟 Uniqueness of the Concept
Integrated Multi-Indicator Synergy:
Combines a diverse range of trend, momentum, and volume-based indicators into a single cohesive system for a holistic market view.
Master Candle Aggregation:
Consolidates numerous individual signals into a "Master Candle" that filters out noise and provides a clear, consensus-based trading signal.
Layered Visual Feedback:
Uses color-coded histograms, adaptive background cues, and dynamic overlays to deliver a visually intuitive guide to market sentiment at a glance.
Customization and Flexibility:
Offers adjustable parameters for each indicator, allowing users to tailor the system to fit diverse trading styles and market conditions.
✅ Conclusion:
Robust Trading Tool & Non-Repainting Reliability:
This versatile technical analysis tool computes an extensive range of indicators, aggregates them into a stable, non-repainting “Master Candle” signal, and maintains consistent, verifiable outputs on historical data.
Holistic Market Insight & Consistent Signal Generation:
By combining trend detection, momentum oscillators, and volume analysis, the indicator delivers a comprehensive snapshot of market conditions and generates dependable signals across varying timeframes.
User-Centric Design with Rich Visual Feedback:
Customizable settings, clear color-coded outputs, adaptive backgrounds, and real-time alerts work together to provide actionable, transparent feedback—enhancing the overall trading experience.
A Unique All-in-One Solution:
The integrated approach not only simplifies complex market dynamics into an easy-to-read visual guide but also empowers systematic traders with a powerful, adaptable asset for accurate decision-making.
❤️ Credits:
Pine Script™ User Manual
Supertrend
Ichimoku Cloud
Parabolic SAR
Price Volume Trend (PVT)
Average Directional Index (ADX)
Volume Oscillator
HalfTrend
Donchian Trend

RNDR Volume-Based Triggers v6Volume alert for RNDR and other alts, uptrends without volume are easily a trap

RNDR Volume-Based TriggersTo determine volume in and practice a stop if the volume doesn't support the uptrend


RNDR Reentry SystemStrategy for Render for daily trading
It helps getting in and out depending on volume, shape of the candles in the chart, uptrend, Overbought and oversold signals.

volatilityThis indicator indicates whether volatility is sufficient for trading. It works on time frames from 1 minute to 2 hours. The redder the indicator, the less volatility there is, and the greener the indicator, the more volatility there is.
