OPEN-SOURCE SCRIPT
VPA - 5.0
Cập nhật
This is a upgraded version of the vpa analysis script which basically implements Volume Spread Analysis (aka Volume Price analysis). It has been rechristened as VPA 5.0 to be inline with version released for Amiboker package so that all future upgrades will go hand in hand. All most all featured of the Amibroker version has been incorporated in this version. Some important additions are as follows
1. A status window for the bar and Trend Description added. No need to plot the trend bands or additional trend Indicator any more.
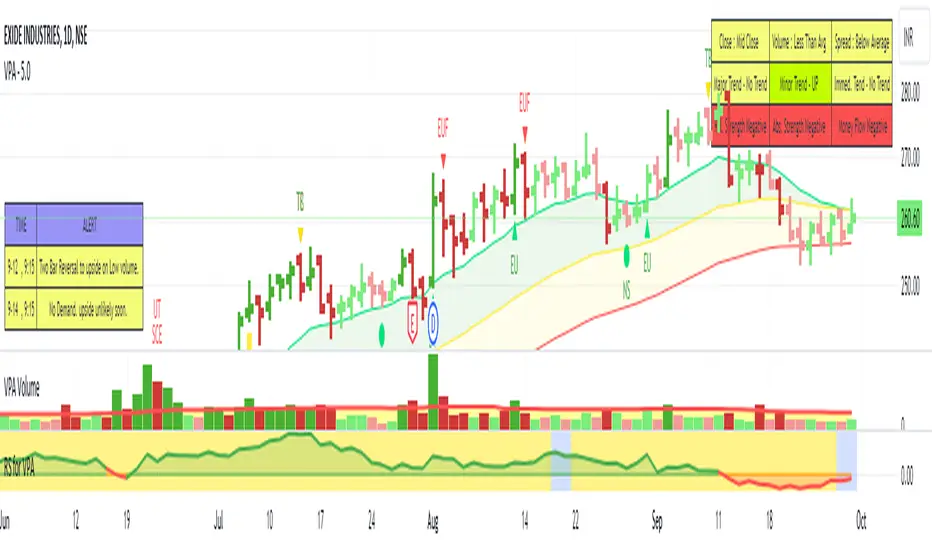
2. The most important upgrade would be the addition of a Alert window which provides description of the VSA signals. It is also a log window which provides up to 10 last signals
(Credits to Quantnomad for this wonderful piece of code. This feature is an adaptation of his public code)
3. Added facility to plot EMAs / PEMAs with changable parameters
4. Added facility to plot VWAP
5. Facility to switch on and Off the VSA signals. Also tool tip provides description of the signals
6. Facility to plot Resistance and Volume Lines (Credits to @margepadu)
Hope this script will be helpful to everyone. Please do provide your feedback and suggestions for improvements
1. A status window for the bar and Trend Description added. No need to plot the trend bands or additional trend Indicator any more.
2. The most important upgrade would be the addition of a Alert window which provides description of the VSA signals. It is also a log window which provides up to 10 last signals
(Credits to Quantnomad for this wonderful piece of code. This feature is an adaptation of his public code)
3. Added facility to plot EMAs / PEMAs with changable parameters
4. Added facility to plot VWAP
5. Facility to switch on and Off the VSA signals. Also tool tip provides description of the signals
6. Facility to plot Resistance and Volume Lines (Credits to @margepadu)
Hope this script will be helpful to everyone. Please do provide your feedback and suggestions for improvements
Phát hành các Ghi chú
Revision 1 - Revision NotesNow the user has an option to display SOS and SOW symbols instead of text labels. The description of the SOS/SOW can be made available with the help of Tooltips displayed when the cursor is placed on the symbols
Bugs in the trend band for the Minor Trend has been corrected
Status of the "Relative Strength" (In comparison to NSE 500) , The Absolute Strength of the stock trend and the Money flow in to the stock are displayed in the Status Table on the right Hand side top.
New signal added - High Volume unable to move price. Demand / Supply Area - Bullish or Bearish Depending on the Location of the Bar
The Bar coloring based on strength (3 Colors) is confusing to many users and will be removed.
New bar coloring has been introduced. If the close is higher than yesterday’s close then it will be colored in green shade. If the volume is below average then the color will be in lighter green and if the volume is higher than average color will be darker shade of green.in the similar manner if the close is lower than yesterdays’ close then the bar will be colored in shades of Red depending on Volume. The average volume will be 60 days volume.
Mã nguồn mở
Theo tinh thần TradingView thực sự, tác giả của tập lệnh này đã xuất bản dưới dạng nguồn mở để các nhà giao dịch có thể hiểu và xác minh. Chúc mừng tác giả! Bạn có thể sử dụng miễn phí. Tuy nhiên, bạn cần sử dụng lại mã này theo Quy tắc nội bộ. Bạn có thể yêu thích nó để sử dụng nó trên biểu đồ.
Thông báo miễn trừ trách nhiệm
Thông tin và ấn phẩm không có nghĩa là và không cấu thành, tài chính, đầu tư, kinh doanh, hoặc các loại lời khuyên hoặc khuyến nghị khác được cung cấp hoặc xác nhận bởi TradingView. Đọc thêm trong Điều khoản sử dụng.