OPEN-SOURCE SCRIPT
Cập nhật WaveTrend Oscillator Plus
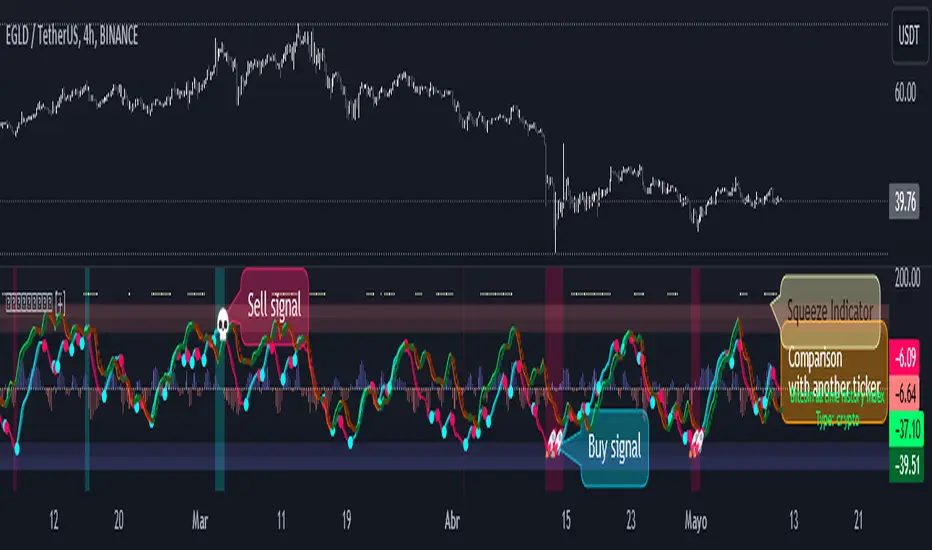
The WaveTrend [+] based on “Enhanced WaveTrend” of EliCobra. The WaveTrend Oscillator is a popular technical analysis tool used to identify overbought and oversold conditions in the market and generate trading signals. This indicator introduces additional features for improved analysis and comparison across assets.
WaveTrend:
The original WaveTrend indicator calculates two lines based on exponential moving averages and their relationship to the asset's price. The first line measures the distance between the asset's price and its EMA, while the second line smooths the first line over a specific period. The result is divided by 0.015 multiplied by the smoothed difference ('d' for reference). The indicator aims to identify overbought and oversold conditions by analyzing the relationship between the two lines.
In the original formula, the rudimentary estimation factor 0.015 times 'd' fails to accomodate for approximately a quarter of the data, preventing the indicator from reaching the traditional stationary levels of +-100. This limitation renders the indicator quantitatively biased, as it relies on the user's subjective adjustment of the levels. The enhanced version replaces this factor with the standard deviation of the asset's price, resulting in improved estimation accuracy and provides a more dynamic and robust outcome, we thereafter multiply the result by 100 to achieve a more traditional oscillation.
Enhancements and Features:
Dynamic Estimation: The original indicator uses an arbitrary estimation factor, while the enhanced version replaces it with the standard deviation of the asset's price. This modification provides a more dynamic and accurate estimation, adapting to the specific price characteristics of each asset.
Stationary Support and Resistance Levels: The enhanced version provides stationary key support and resistance levels that range from -150 to 150. These levels are determined based on the analysis of the indicator's data and encompass more than 95% of the indicator's values. These levels offer important reference points for traders to identify potential price reversals or significant price movements.
Comparison Across Assets: The enhanced version allows for better comparison and analysis across different assets. By incorporating the standard deviation of the asset's price, the indicator provides a more consistent and comparable interpretation of the market conditions across multiple assets.
Z-Score Analysis:
The Z-Score is a statistical measurement that quantifies how far a particular data point deviates from the mean in terms of standard deviations. In the enhanced version, the calculation involves determining the basis (mean) and deviation (standard deviation) of the asset's price to calculate its Z-Score, thereafter applying a smoothing technique to generate the final WaveTrend value.
Utility:
The offers traders and investors valuable insights into overbought and oversold conditions in the market. By analyzing the indicator's values and referencing the stationary support and resistance levels, traders can identify potential trend reversals, evaluate market strength, and make better informed analysis.
The following indicators were added:
⎆⎆ Squeeze Momentum Indicator
⎆⎆ Elliott Wave Oscillator
⎆⎆ Expert Trend Locator [XTL]
Phát hành các Ghi chú
Small update : Use Black Background (option)Phát hành các Ghi chú
Now you can change the type of moving average of the "WaveTrend Oscillator". If you change the moving average type then you have to change the "Reversion Threshold" value.
Phát hành các Ghi chú
Added "Ultimate Smoother" which is an implementation of the digital smoothing filter introduced by John Ehlers in his article "The Ultimate Smoother".Phát hành các Ghi chú
Pine Script v6 Update.The way of displaying divergences has been changed, now they are marked according to the DoctaBot author's algorithm.
The DMI (Directional Movement Index) indicator has been added, which is mainly used to identify the direction and strength of a market trend. The ADX can be observed together with the other indicators, as it works as a good filter. The default key level is 23 but you can modify it to your liking.
ADX measures the strength of the trend, without indicating its direction. Values above 23 suggest a strong trend, while values below 23 indicate weakness or sideways range.
DMI consists of two lines:
+DI (green line): measures the strength of the uptrend.
-DI (orange line): Measures the strength of the downtrend.
The relative position between +DI and -DI determines the direction of the trend.
Joint interpretation:
Strong trend confirmed: if the ADX is above 23 and +DI crosses bullishly over -DI , it signals a solid uptrend. Conversely, if -DI crosses above +DI with ADX high, it confirms a downtrend.
Weak trend or range: If the ADX is below 23, even if there are crossovers between +DI and -DI, the signals are less reliable, as volatility is low.
DMI expansions and contractions:
Expansion (+DI and -DI separate): indicates higher volatility and a developing trend. If it coincides with a rising ADX, it confirms directional momentum.
Contraction (+DI and -DI converge): Suggests consolidation phase or potential reversal, especially if the ADX falls.
Limitations and practical use:
Signal lag: Both ADX and DMI are lagging indicators, so crossovers may occur after trend initiation.
Mã nguồn mở
Theo đúng tinh thần TradingView, tác giả của tập lệnh này đã công bố nó dưới dạng mã nguồn mở, để các nhà giao dịch có thể xem xét và xác minh chức năng. Chúc mừng tác giả! Mặc dù bạn có thể sử dụng miễn phí, hãy nhớ rằng việc công bố lại mã phải tuân theo Nội quy.
Thông báo miễn trừ trách nhiệm
Thông tin và các ấn phẩm này không nhằm mục đích, và không cấu thành, lời khuyên hoặc khuyến nghị về tài chính, đầu tư, giao dịch hay các loại khác do TradingView cung cấp hoặc xác nhận. Đọc thêm tại Điều khoản Sử dụng.