OPEN-SOURCE SCRIPT
Cập nhật Kurutoga Histogram with HTF and LTF
Kurutoga Histogram:
The Kurutoga Histogram is a technical analysis indicator designed to measure price divergence from the 50% level of a recent price range. By calculating how far the current price is from the midpoint of a selected base length of candles, the histogram provides insight into the momentum, strength, and potential reversals in the market. Additionally, it can be applied across multiple timeframes to provide a comprehensive view of both short- and long-term market dynamics.
Key Components:
Base Length:
The base length is the number of candles (bars) over which the high and low prices are observed. The default base length is typically 14 periods, but it can be adjusted according to the trader's preference.
This base length defines the range from which the 50% level, or midpoint, is calculated.
50% Level (Midpoint):
The midpoint is the average of the highest high and the lowest low over the selected base length. This 50% level acts as an equilibrium point around which the price fluctuates.
Formula:
Midpoint = (Highest High + Lowest Low) / 2
The price’s distance from this midpoint is an indicator of how strong the current trend or divergence is.
Price Divergence:
The main calculation of the histogram is the difference between the current closing price and the midpoint of the price range.
Formula:
Divergence = Close Price − Midpoint
A positive divergence (price above the midpoint) indicates bullish strength, while a negative divergence (price below the midpoint) indicates bearish strength.
Multi-Timeframe Analysis:
The Kurutoga Histogram can be applied to both the current timeframe and a higher timeframe (HTF), allowing traders to gauge price movement in both short-term and long-term contexts.
By comparing the histograms of multiple timeframes, traders can determine if there is alignment (confluence) between trends, which can strengthen trade signals or provide additional confirmation.
Color-Coded Histogram:
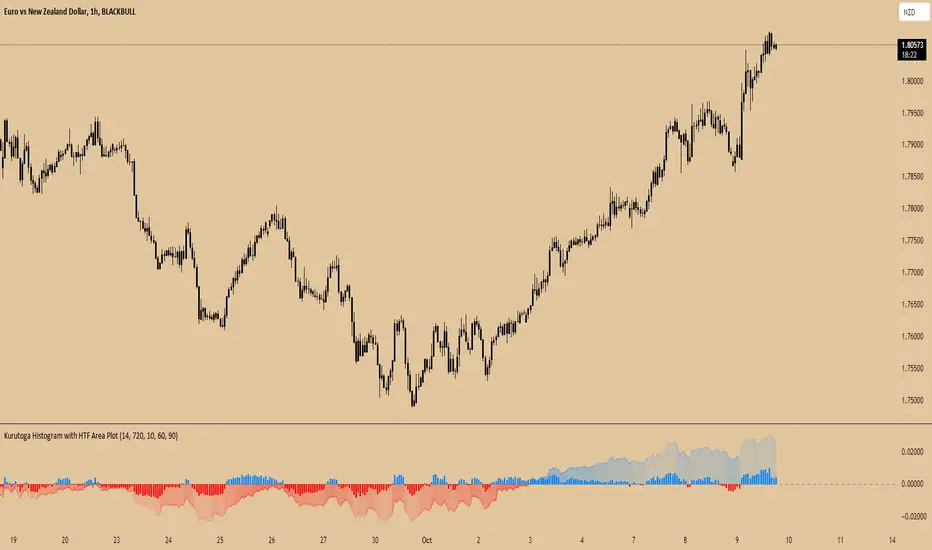
Blue Bars (Positive Divergence): Represent that the price is above the 50% level, indicating bullish momentum. Taller blue bars suggest stronger upward momentum, while shrinking bars suggest weakening strength.
Red Bars (Negative Divergence): Represent that the price is below the 50% level, indicating bearish momentum. Taller red bars suggest stronger downward momentum, while shrinking bars suggest a potential reversal or consolidation.
The histogram’s color intensity and transparency can be adjusted to enhance the visual effect, distinguishing between current timeframe (LTF) and higher timeframe (HTF) divergence.
Interpretation:
Bullish Signals: When the histogram bars are blue and growing, the price is gaining momentum above the midpoint of its recent range. This could signal an ongoing uptrend.
Bearish Signals: When the histogram bars are red and growing, the price is gaining momentum below the midpoint, signaling an ongoing downtrend.
Momentum Shifts: When the histogram bars shrink in size (whether blue or red), it could indicate that the current trend is losing strength and may reverse or enter consolidation.
Neutral or Sideways Movement: When the histogram bars hover around zero, it means the price is trading near the midpoint of its recent range, often signaling a lack of strong momentum in either direction.
Multi-Timeframe Confluence:
When the current timeframe (LTF) histogram aligns with the higher timeframe (HTF) histogram (e.g., both are showing strong bullish or bearish divergence), it may provide stronger confirmation of the trend's strength.
Divergence between timeframes (e.g., bullish on LTF but bearish on HTF) may suggest that price movements on lower timeframes are not yet reflected in the broader trend, signaling caution.
Applications:
Trend Identification: The Kurutoga Histogram is highly useful for detecting when the price is trending away from its equilibrium point, providing insight into the strength of ongoing trends.
Momentum Analysis: By measuring the divergence from the 50% level, the histogram helps traders identify when momentum is increasing or decreasing.
Reversal Detection: Shrinking histogram bars can signal weakening momentum, which often precedes trend reversals.
Consolidation and Breakouts: When the histogram remains near zero for an extended period, it suggests consolidation, which often precedes a breakout in either direction.
Advantages:
Clear Visuals: The use of a color-coded histogram makes it easy to visually assess whether the market is gaining bullish or bearish momentum.
Multi-Timeframe Utility: The ability to compare current timeframe signals with higher timeframe signals adds an extra layer of confirmation, reducing false signals.
Dynamic Adjustment: By adjusting the base length, traders can fine-tune the sensitivity of the indicator to match different markets or trading styles.
Limitations:
Lagging Indicator: Like most divergence indicators, the Kurutoga Histogram may lag slightly behind actual price movements, especially during fast, volatile markets.
Requires Confirmation: This indicator works best when used in conjunction with other technical tools like moving averages, support/resistance levels, or volume indicators, to avoid relying on divergence alone.
Conclusion:
The Kurutoga Histogram is a versatile and visually intuitive tool for measuring price divergence from a key equilibrium point, helping traders to assess the strength of trends and identify potential reversal points. Its use across multiple timeframes provides deeper insights, making it a valuable addition to any trading strategy that emphasizes momentum and trend following.
Phát hành các Ghi chú
In this update, we improved the readability of the Kurutoga Histogram by enhancing the color palette and gradient. The HTF area plot now features a gradient that becomes more transparent as values approach zero, providing a clearer visual distinction. The LTF histogram bars retain their original style but with refined color transitions for better contrast. These changes aim to make it easier to interpret divergence signals and overall oscillator behavior at a glance. Allowing to scalping the market on LTF while following the HTF :)Mã nguồn mở
Theo đúng tinh thần TradingView, tác giả của tập lệnh này đã công bố nó dưới dạng mã nguồn mở, để các nhà giao dịch có thể xem xét và xác minh chức năng. Chúc mừng tác giả! Mặc dù bạn có thể sử dụng miễn phí, hãy nhớ rằng việc công bố lại mã phải tuân theo Nội quy.
Thông báo miễn trừ trách nhiệm
Thông tin và các ấn phẩm này không nhằm mục đích, và không cấu thành, lời khuyên hoặc khuyến nghị về tài chính, đầu tư, giao dịch hay các loại khác do TradingView cung cấp hoặc xác nhận. Đọc thêm tại Điều khoản Sử dụng.
Mã nguồn mở
Theo đúng tinh thần TradingView, tác giả của tập lệnh này đã công bố nó dưới dạng mã nguồn mở, để các nhà giao dịch có thể xem xét và xác minh chức năng. Chúc mừng tác giả! Mặc dù bạn có thể sử dụng miễn phí, hãy nhớ rằng việc công bố lại mã phải tuân theo Nội quy.
Thông báo miễn trừ trách nhiệm
Thông tin và các ấn phẩm này không nhằm mục đích, và không cấu thành, lời khuyên hoặc khuyến nghị về tài chính, đầu tư, giao dịch hay các loại khác do TradingView cung cấp hoặc xác nhận. Đọc thêm tại Điều khoản Sử dụng.