OPEN-SOURCE SCRIPT
IBD PowerTrend
This IBD PowerTrend indicator is designed to help traders identify strong market uptrends based on the IBD Market School's Power Trend methodology. It is intended to be added to daily charts on major indexes.
Concept and Methodology
The IBD PowerTrend helps traders identify strong market uptrends. Markets generally exist in three states: uptrends, downtrends, and rangebound motion. This methodology focuses on:
This indicator uses IBD's research on historical uptrends to help traders get in and stay in during robust market phases.
How It Works
A PowerTrend starts when the following four conditions are met simultaneously on a major index:
A PowerTrend typically ends when the 21-day EMA crosses back below the 50-day SMA. However, there are rare cases where a PowerTrend can end early due to a circuit breaker or a follow-through day failure. In this script, a circuit breaker is defined as a break of the 50-day line and being more than 10% below recent highs (interpreted as three months).
How to Use
When the PowerTrend is active, the indicator will plot green circles, signaling a strong market uptrend. During these periods, traders might observe opportunities in growth stocks breaking out of sound bases and consider the use of margin. Conversely, during downtrends, the indicator suggests a more defensive approach.
It is recommended to use on daily timeframe.
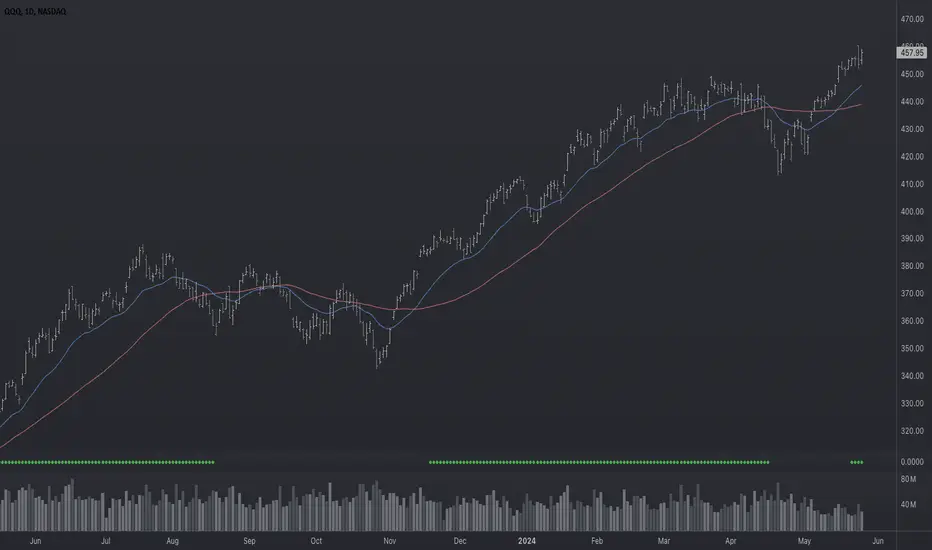
Chart Description
Main Chart:
- EMA 21 (blue): The 21-day exponential moving average.
- SMA 50 (red): The 50-day simple moving average.
First Panel:
- IBD PowerTrend Indicator: Plots the PowerTrend status with green circles indicating an active PowerTrend.
Second Panel:
- Volume Bars
Concept and Methodology
The IBD PowerTrend helps traders identify strong market uptrends. Markets generally exist in three states: uptrends, downtrends, and rangebound motion. This methodology focuses on:
- Downtrends: Stay out of the market.
- Rangebound markets: Often frustrating, best avoided.
- Uptrends: Identify the strongest uptrends early.
This indicator uses IBD's research on historical uptrends to help traders get in and stay in during robust market phases.
How It Works
A PowerTrend starts when the following four conditions are met simultaneously on a major index:
- 10-Day Low Above 21-Day EMA: The market's low must be above the 21-day exponential moving average (EMA) for at least 10 consecutive days.
- 21-Day EMA Above 50-Day SMA: The 21-day EMA must be above the 50-day simple moving average (SMA) for at least five consecutive days.
- 50-Day SMA Uptrend: The 50-day SMA must be in an uptrend (one day is sufficient).
- Market Closes Up: The market must close higher than the previous day's close.
A PowerTrend typically ends when the 21-day EMA crosses back below the 50-day SMA. However, there are rare cases where a PowerTrend can end early due to a circuit breaker or a follow-through day failure. In this script, a circuit breaker is defined as a break of the 50-day line and being more than 10% below recent highs (interpreted as three months).
How to Use
When the PowerTrend is active, the indicator will plot green circles, signaling a strong market uptrend. During these periods, traders might observe opportunities in growth stocks breaking out of sound bases and consider the use of margin. Conversely, during downtrends, the indicator suggests a more defensive approach.
It is recommended to use on daily timeframe.
Chart Description
Main Chart:
- EMA 21 (blue): The 21-day exponential moving average.
- SMA 50 (red): The 50-day simple moving average.
First Panel:
- IBD PowerTrend Indicator: Plots the PowerTrend status with green circles indicating an active PowerTrend.
Second Panel:
- Volume Bars
Mã nguồn mở
Theo tinh thần TradingView thực sự, tác giả của tập lệnh này đã xuất bản dưới dạng nguồn mở để các nhà giao dịch có thể hiểu và xác minh. Chúc mừng tác giả! Bạn có thể sử dụng miễn phí. Tuy nhiên, bạn cần sử dụng lại mã này theo Quy tắc nội bộ. Bạn có thể yêu thích nó để sử dụng nó trên biểu đồ.
Thông báo miễn trừ trách nhiệm
Thông tin và ấn phẩm không có nghĩa là và không cấu thành, tài chính, đầu tư, kinh doanh, hoặc các loại lời khuyên hoặc khuyến nghị khác được cung cấp hoặc xác nhận bởi TradingView. Đọc thêm trong Điều khoản sử dụng.