OPEN-SOURCE SCRIPT
Cập nhật BKSqueeze
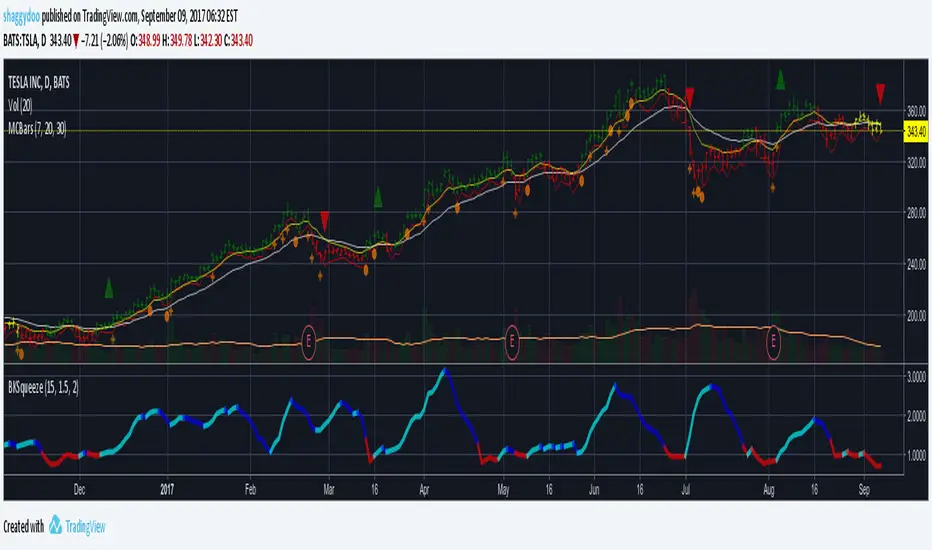
This is a price volatility compression and expansion indicator that uses the ratio of the Bollinger Band and Keltner Ratio.
Red segments indicate extreme price volatility compression that can be ideal entry points for stock/futures/forex and/or options positions.
Aqua segments indicate price volatility is expanding.
Blue segments indicate price volatility is compressing - can be used as an exit point or partial scale out point.
Note that the indicator doesn't indicate direction. One suggestion is to use the DMI indicator for this purpose - really depends on how early you enter the trade.
Suggest using a time period of 15 bars for volatile stocks, such as TSLA for example, otherwise a period of 20 bars suits most stocks/futures/forex symbols.
Phát hành các Ghi chú
Improved in-squeeze calculation - now works for all symbols including forexPhát hành các Ghi chú
Updated for consistencyPhát hành các Ghi chú
Overlayed a momentum indicator for direction:Aqua bar indicates uptrend momentum is increasing.
Blue bar indicates uptrend momentum is decreasing.
Red bar indicates downtrend momentum is increasing.
Yellow bar indicates downtrend momentum is decreasing.
Also added early indication of BKRatio squeeze break out:
Orange: BKRatio in squeeze and rising - indicates potential of breakout - early indication to enter prior to breakout.
Red: BKRatio in squeeze and falling or flat - indicates still in squeeze - lower potential of breakout.
Aqua: BKRatio out of squeeze and volatility increasing - initial Aqua segment can be effective entry - depends if using stock, futures or options.
Blue: BKRatio out of squeeze and volatility decreasing - can indicate a potential exit point or scale out point.
Mã nguồn mở
Theo đúng tinh thần TradingView, tác giả của tập lệnh này đã công bố nó dưới dạng mã nguồn mở, để các nhà giao dịch có thể xem xét và xác minh chức năng. Chúc mừng tác giả! Mặc dù bạn có thể sử dụng miễn phí, hãy nhớ rằng việc công bố lại mã phải tuân theo Nội Quy.
Thông báo miễn trừ trách nhiệm
Thông tin và các ấn phẩm này không nhằm mục đích, và không cấu thành, lời khuyên hoặc khuyến nghị về tài chính, đầu tư, giao dịch hay các loại khác do TradingView cung cấp hoặc xác nhận. Đọc thêm tại Điều khoản Sử dụng.