OPEN-SOURCE SCRIPT
High/Low Volume
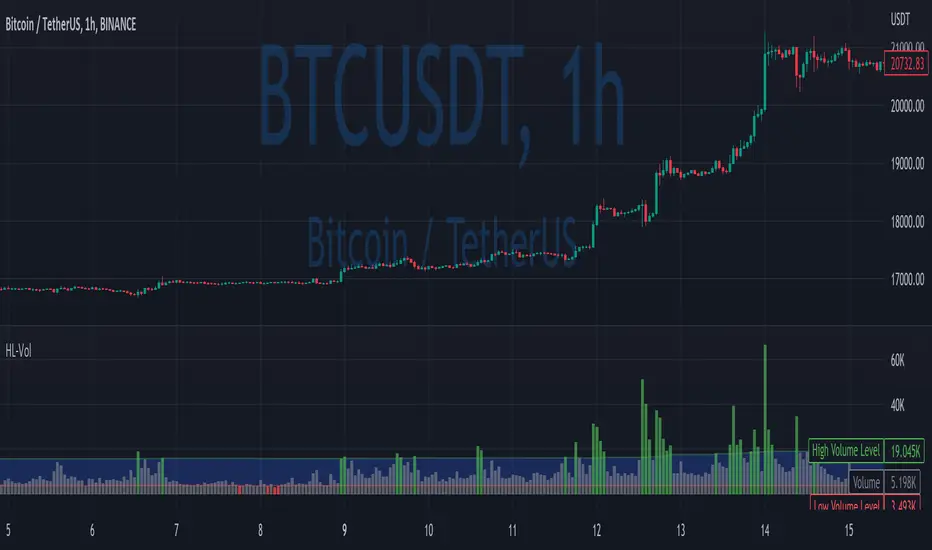
In this indicator, I show you a better way to define high/low values of volume (or any other indicator).
Quite often, I get requests from my clients that an indicator level should be “high” or that it should be above a certain absolute level.
The first request is hard to interpret mathematically, but traders can easily spot it on the chart. The second one is not flexible, and it might not make sense in another market regime.
To solve that, you can compute dynamic high/low levels that represent unexpected extreme values that are adaptable to recent conditions.
There are two pretty simple methods I’m using quite often in my scripts percentiles and sigma (standard deviations).
Percentile looks back at X bars and computes the value under which a certain % of data points are located. So, for example, if we’re computing 90%tile and we’re looking at 100 bars, we’ll get a value under which we have values of precisely 90 bars for this indicator. It’s a good idea to use something like 5%tile for low level and 95%tile for high level.
Sigma(σ) is related to standard deviation. If we assume that our data is normally distributed, then 68% of data points should be in the range of mean +-1σ, 95% → mean +-2σ. So we can assume that something above 2σ is a pretty rare and extreme event.
In this script, I give you an example of how to compute both on volume, but you can easily change this to another indicator.
The issue with volume is that it’s not normally distributed, and your low level will be quite often too low to detect any low levels. Ideally, we have to use a more sophisticated formula that fits volume distribution better.
In this indicator, you can set the following parameters:
You can also receive alerts for high/low volume events.
Disclaimer
Please remember that past performance may not indicate future results.
Due to various factors, including changing market conditions, the strategy may no longer perform as well as in historical backtesting.
This post and the script don’t provide any financial advice.
Quite often, I get requests from my clients that an indicator level should be “high” or that it should be above a certain absolute level.
The first request is hard to interpret mathematically, but traders can easily spot it on the chart. The second one is not flexible, and it might not make sense in another market regime.
To solve that, you can compute dynamic high/low levels that represent unexpected extreme values that are adaptable to recent conditions.
There are two pretty simple methods I’m using quite often in my scripts percentiles and sigma (standard deviations).
Percentile looks back at X bars and computes the value under which a certain % of data points are located. So, for example, if we’re computing 90%tile and we’re looking at 100 bars, we’ll get a value under which we have values of precisely 90 bars for this indicator. It’s a good idea to use something like 5%tile for low level and 95%tile for high level.
Sigma(σ) is related to standard deviation. If we assume that our data is normally distributed, then 68% of data points should be in the range of mean +-1σ, 95% → mean +-2σ. So we can assume that something above 2σ is a pretty rare and extreme event.
In this script, I give you an example of how to compute both on volume, but you can easily change this to another indicator.
The issue with volume is that it’s not normally distributed, and your low level will be quite often too low to detect any low levels. Ideally, we have to use a more sophisticated formula that fits volume distribution better.
In this indicator, you can set the following parameters:
- Choose type: Percentile or Sigma
- Lookback Period
- High/Low Percentiles
- Sigmas #
You can also receive alerts for high/low volume events.
Disclaimer
Please remember that past performance may not indicate future results.
Due to various factors, including changing market conditions, the strategy may no longer perform as well as in historical backtesting.
This post and the script don’t provide any financial advice.
Mã nguồn mở
Theo đúng tinh thần TradingView, tác giả của tập lệnh này đã công bố nó dưới dạng mã nguồn mở, để các nhà giao dịch có thể xem xét và xác minh chức năng. Chúc mừng tác giả! Mặc dù bạn có thể sử dụng miễn phí, hãy nhớ rằng việc công bố lại mã phải tuân theo Nội quy.
Quant Developer | Pine Script v6 | Python & R
12+ yrs system. trading, hedge fund experience
Custom indicators, strategies & screeners
Futures & options
💼 Hire/Consulting:
qntly.com/hire
🎓 PineScript V6 Course:
qntly.com/ps6
12+ yrs system. trading, hedge fund experience
Custom indicators, strategies & screeners
Futures & options
💼 Hire/Consulting:
qntly.com/hire
🎓 PineScript V6 Course:
qntly.com/ps6
Thông báo miễn trừ trách nhiệm
Thông tin và các ấn phẩm này không nhằm mục đích, và không cấu thành, lời khuyên hoặc khuyến nghị về tài chính, đầu tư, giao dịch hay các loại khác do TradingView cung cấp hoặc xác nhận. Đọc thêm tại Điều khoản Sử dụng.