OPEN-SOURCE SCRIPT
Cập nhật Weis pip zigzag jayy
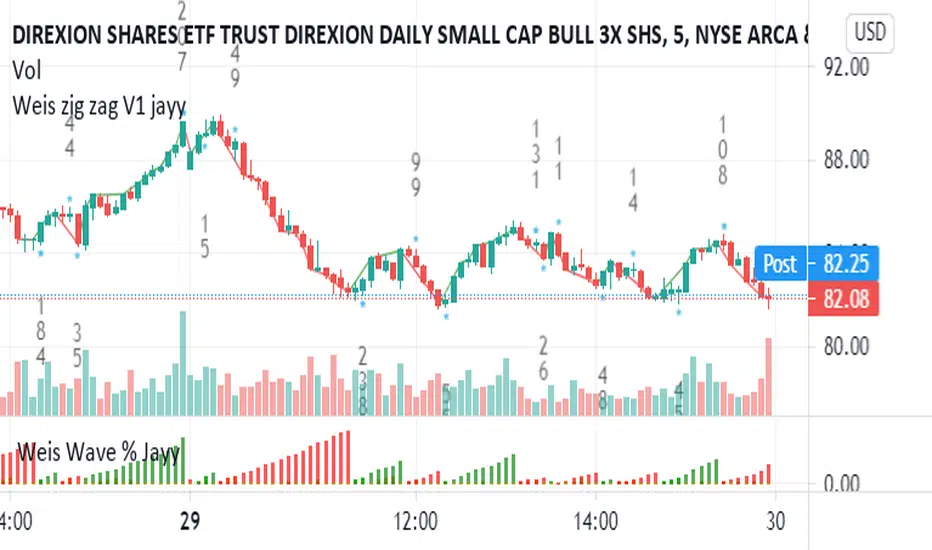
What you see here is the Weis pip zigzag wave plotted directly on the price chart. This script is the companion to the Weis pip wave (  ) which is plotted in the lower panel of the displayed chart and can be used as an alternate way of plotting the same results. The Weis pip zigzag wave shows how far in terms of price a Weis wave has traveled through the duration of a Weis wave. The Weis pip zigzag wave is used in combination with the Weis cumulative volume wave. The two waves must be set to the same "wave size".
To use this script you must set the wave size. Using the traditional Weis method simply enter the desired wave size in the box "Select Weis Wave Size" In this example, it is set to 5. Each wave for each security and each timeframe requires its own wave size. Although not the traditional method a more automatic way to set wave size would be to use ATR. This is not the true Weis method but it does give you similar waves and, importantly, without the hassle described above. Once the Weis wave size is set then the pip wave will be shown.
I have put a pip zigzag of a 5 point Weis wave on the bar chart - that is a different script. I have added it to allow your eye to see what a Weis wave looks like. You will notice that the wave is not in straight lines connecting wave tops to bottoms this is a function of the limitations of Pinescript version 1. This script would need to be in version 4 to allow straight lines. There are too many calculations within this script to allow conversion to Pinescript version 4 or even Version 3. I am in the process of rewriting this script to reduce the number of calculations and streamline the algorithm.
The numbers plotted on the chart are calculated to be relative numbers. The script is limited to showing only three numbers vertically. Only the highest three values of a number are shown. For example, if the highest recent pip value is 12,345 only the first 3 numerals would be displayed ie 123. But suppose there is a recent value of 691. It would not be helpful to display 691 if the other wave size is shown as 123. To give the appropriate relative value the script will show a value of 7 instead of 691. This informs you of the relative magnitude of the values. This is done automatically within the script. There is likely no need to manually override the automatically calculated value. I will create a video that demonstrates the manual override method.
What is a Weis wave? David Weis has been recognized as a Wyckoff method analyst he has written two books one of which, Trades About to Happen, describes the evolution of the now popular Weis wave. The method employed by Weis is to identify waves of price action and to compare the strength of the waves on characteristics of wave strength. Chief among the characteristics of strength is the cumulative volume of the wave. There are other markers that Weis uses as well for example how the actual price difference between the start of the Weis wave from start to finish. Weis also uses time, particularly when using a Renko chart. Weis specifically uses candle or bar closes to define all wave action ie a line chart.
David Weis did a futures io video which is a popular source of information about his method.
This is the identical script with the identical settings but without the offending links. If you want to see the pip Weis method in practice then search Weis pip wave. If you want to see Weis chart in pdf then message me and I will give a link or the Weis pdf. Why would you want to see the Weis chart for May 27, 2020? Merely to confirm the veracity of my algorithm. You could compare my Weis chart here (tradingview.com/x/tNeK79Fu/) from the same period to the David Weis chart from May 27. Both waves are for the ES!1 4 hour chart and both for a wave size of 5.
Phát hành các Ghi chú
This update fixes some issues with the current Pinescript version of my Weis zig zag. I have added a better way to plot waves on a new IPO. A couple of critical algo typos were fixed. The default is now cumulative volume waves using an ATR of 7 and a multiplication factor of .5. This will get you up and running more quickly when studying charts. However, you should choose the Traditional method to be true to David Weis technique as described in his book "Trades About to Happen" and in the Futures IO Webcast featuring David Weis. To use the traditional method uncheck the box that states "Use average true range?". Then proceed to choose a wave size "Select Weis Wave Size". You must set a wave size for each timeframe and for each security. This script uses up all available plot statements. If you wish to change the text colour make the changes on line three of the script.The wave size shown is a traditional Weis wave size of $1.
I am abandoning the Version 1 Pinescript version in favour of Pinescript Version 4 which now allows lines and labels up to 500. Until this happened last November there was no point in creating the version 4 adaption of my script. Pinescript 4 allows for horizontal numbers and much improved wave plotting. The dialogue boxes are more intuitive. The use of this script still requires a working knowledge of the Weis method. Version 4 is a work in progress. The current draft is here. The script is currently protected until I have a final version that I am comfortable with. David Weis passed away on December 17, 2020. May he rest in peace. jayy:

Mã nguồn mở
Theo đúng tinh thần TradingView, tác giả của tập lệnh này đã công bố nó dưới dạng mã nguồn mở, để các nhà giao dịch có thể xem xét và xác minh chức năng. Chúc mừng tác giả! Mặc dù bạn có thể sử dụng miễn phí, hãy nhớ rằng việc công bố lại mã phải tuân theo Nội quy.
Jayy
Thông báo miễn trừ trách nhiệm
Thông tin và các ấn phẩm này không nhằm mục đích, và không cấu thành, lời khuyên hoặc khuyến nghị về tài chính, đầu tư, giao dịch hay các loại khác do TradingView cung cấp hoặc xác nhận. Đọc thêm tại Điều khoản Sử dụng.