Price Action Suite
Features of the TRN Price Action Suite:
- (Inverse) Fair Value Gaps (FVG)
- Order Blocks (OB)
- FVG and OB with Cumulative Volume Delta
- Volume Imbalances
- Market Structure
- Liquidity levels
- Sessions
- Kill zones/Opening Range
The indicator helps traders to easily identify favorable market conditions and high probability trade setups. It automatically finds time and price action concepts and displays them in an intuitive way on the chart. One of the highlights is the detection of Fair Value Gaps and Order Blocks in connection with Cumulative Volume Delta (approx.). You will not find this connection anywhere else.
Fair Value Gaps (FVGs)
A fair value gap occurs when there are inefficiencies in the market or imbalanced buying and selling pressures. Fair value gaps can become a magnet for the price before continuing in the same direction. Special attention should be paid to FVGs that are supported by support and resistance levels, as these offer a higher probability of success for trades. Additionally, the indicator plots inverse FVG (iFVG). These are FVG that are “closed” by a FVG in the other direction. IFVGs are a strong sign of the market to continue in the direction of the iFVG.
In addition to the FVGs you see on the chart, you can add also FVGs from a higher timeframe including the cumulative buy/sell volume. For this you can set “Timeframe 1” and “Timeframe 2” in the settings to your preferred timeframes. E.g. you trade on a 5-minute chart, and you want to see FVGs from 4 hours and a daily chart, then you set Timeframe 1 to 4 h and to Timeframe 2 to 1 D.
Order Blocks and Volume Imbalances can also be shown from higher timeframes.
Order Blocks (OBs)
Order blocks are areas on the chart where a high concentration of limit orders was found in the past. They can serve as potential support or resistance areas. These represent areas in the market where there is an oversupply (supply) or an excess demand (demand). They are often key zones for potential turning points or continuations of the current trend. A bullish OB, for example, is the last bearish candle before a significant uptrend.
FVGs and OBs with Cumulative Volume Delta
The TRN Price Action Suite can show FVGs and OBs with the corresponding Cumulative Volume Delta (CVD). It is a metric to analyze market dynamics by tracking the net difference between buying and selling volumes over a specific timeframe. It is used to determine the strength of the FVG/OB. The FVG/OB includes two bars on the left side, indicating the cumulative buy volume in green as well es the cumulative sell volume in red. At the right side of the FVG/OB box the ratio of the cumulative buy/sell volume is displayed. A high ratio over 1, for example 1.5, indicates a lot of buying pressure. On the hand, a ratio far below 1, for example 0.66, indicates a lot of selling pressure.
Volume Imbalances (VIBs)
Volume Imbalances indicate a price gap from the previous close, but unlike gaps, there is no absence of trading activity within a specific price range. Bullish VIs have opening and closing prices above the previous close, with overlap between the current low and previous high. Bearish VIs are vice versa.
Market Structure
The market structure represents the dominant trend in the market. It is based on swing highs and lows. For instance, if the price makes higher highs (HH) and higher lows (HL) the market structure represents an uptrend. Vice versa if price makes lower lows (LL) and lower highs (LH) the market trend is down.
If the market structure is up, traders can enter positions in a pullback. For this, a trader could use a FVG or an OB as an entry condition.
Market Structure Shift (MSS) (Change of Character (ChoCh))
A market structure shift occurs when the market transitions from one dominant trend to a different one, often signaling a potential change in the underlying market dynamics. A MSS signals the start of a new trend. It signals the change from an uptrend to a down trend and vice versa. Therefore, it is sometimes called change of character (ChoCh). A valid MSS should ideally occur in a strong supply or demand zone. This indicates that the market may be approaching a trend reversal or consolidation.
Break of Structure (BOS)
A break of structure happens when the market breaks out of its established trading range or pattern. The market continues its dominant trend, indicated by the last MSS.
In an uptrend, for example, each time the price breaks through a new high, a "bullish BOS" is formed. This indicates that the market can overcome previous resistance levels and continue to rise.
Levels
One core concept in trading is that price flows to areas of liquidity. Natural liquidity areas are the current day open, high, low (CDO, CDH, CDL) or the previous day high, low, close (PDH, PDL, PDC). The same is true for the current week (CWO, CWH, CWL) and the previous week (PWH, PWL, PWC).
Pay special attention in case some of these levels are close together. Then these levels serve like a magnet for the price. The TRN Price Action Suite indicator can cluster these levels fully automatically together to give the trader the flexibility to focus solely on the trading part.
Sessions
Sessions are the trading hours during which the banks are actively trading. The three main trading sessions:
- Asia: Most of the volume from the Asian players are handled within this session.
- London: This is where the European players are most active.
- New York: In the New York session all the USA players are active as well as all the other American players. Furthermore, a lot of global players are active in this session as well.
Killzones
A kill zone in trading refers to a specific time period during the trading day when the market experiences increased volatility and liquidity. It is an opportunity for traders to capitalize on potential price movements and generate profits. There are several different killzones during the day.
There are three different types of killzones:
- Indices/Futures: This one is suitable if you trade products like the ES, NQ, FDAX, CL or Stocks, Options.
- Forex: If you trade Forex this setting will mark the most liquid periods of the day.
- Opening Range: In case you trade the opening range of the sessions, use this setting.
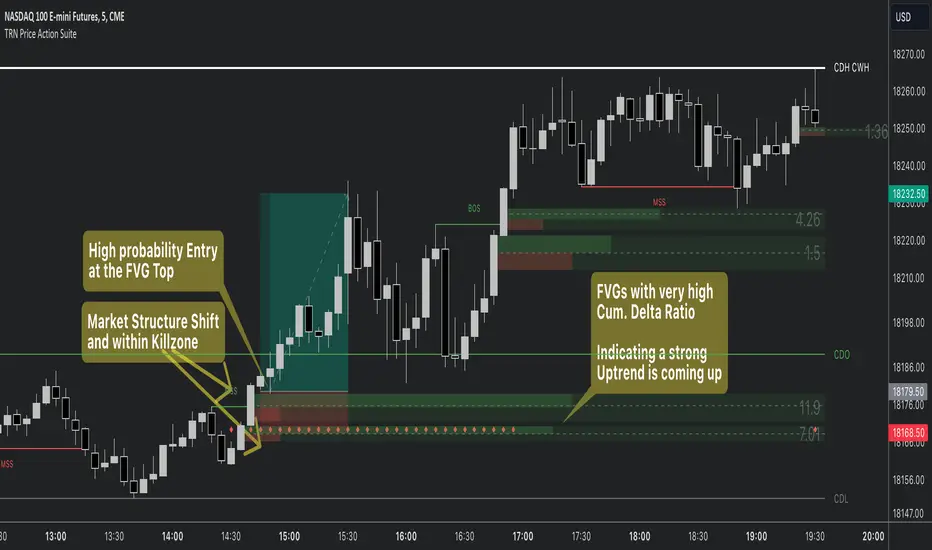
Trading Example
Settings revised
FVGs remain at the original size now
Overlapping FVGs (iFVGs) have been adjusted
Default colors have been made more visible
Alerts for MSS and BOS have been added
Tập lệnh chỉ hiển thị cho người được mời
Chỉ những người dùng được tác giả đồng ý mới có thể truy cập tập lệnh này. Bạn cần yêu cầu và xin phép sử dụng tập lệnh này. Quyền truy cập thường được cấp sau khi thanh toán. Để biết thêm chi tiết, hãy làm theo hướng dẫn của tác giả bên dưới hoặc liên hệ trực tiếp với TRN-Trading.
TradingView KHÔNG khuyến khích trả tiền hoặc sử dụng tập lệnh trừ khi bạn hoàn toàn tin tưởng tác giả và hiểu cách hoạt động của tập lệnh. Bạn cũng có thể tìm thấy các giải pháp thay thế miễn phí, mã nguồn mở trong mục tập lệnh cộng đồng của chúng tôi.
Hướng dẫn của tác giả
Cảnh báo: vui lòng đọc hướng dẫn của chúng tôi về các tập lệnh chỉ dành cho người được mời trước khi yêu cầu quyền truy cập.
Join Our Free Discord: discord.gg/JmPJkKtE8Q
Documentation: docs.trntrading.ai
Thông báo miễn trừ trách nhiệm
Tập lệnh chỉ hiển thị cho người được mời
Chỉ những người dùng được tác giả đồng ý mới có thể truy cập tập lệnh này. Bạn cần yêu cầu và xin phép sử dụng tập lệnh này. Quyền truy cập thường được cấp sau khi thanh toán. Để biết thêm chi tiết, hãy làm theo hướng dẫn của tác giả bên dưới hoặc liên hệ trực tiếp với TRN-Trading.
TradingView KHÔNG khuyến khích trả tiền hoặc sử dụng tập lệnh trừ khi bạn hoàn toàn tin tưởng tác giả và hiểu cách hoạt động của tập lệnh. Bạn cũng có thể tìm thấy các giải pháp thay thế miễn phí, mã nguồn mở trong mục tập lệnh cộng đồng của chúng tôi.
Hướng dẫn của tác giả
Cảnh báo: vui lòng đọc hướng dẫn của chúng tôi về các tập lệnh chỉ dành cho người được mời trước khi yêu cầu quyền truy cập.
Join Our Free Discord: discord.gg/JmPJkKtE8Q
Documentation: docs.trntrading.ai