PROTECTED SOURCE SCRIPT
Cập nhật ZN Pivots

Description
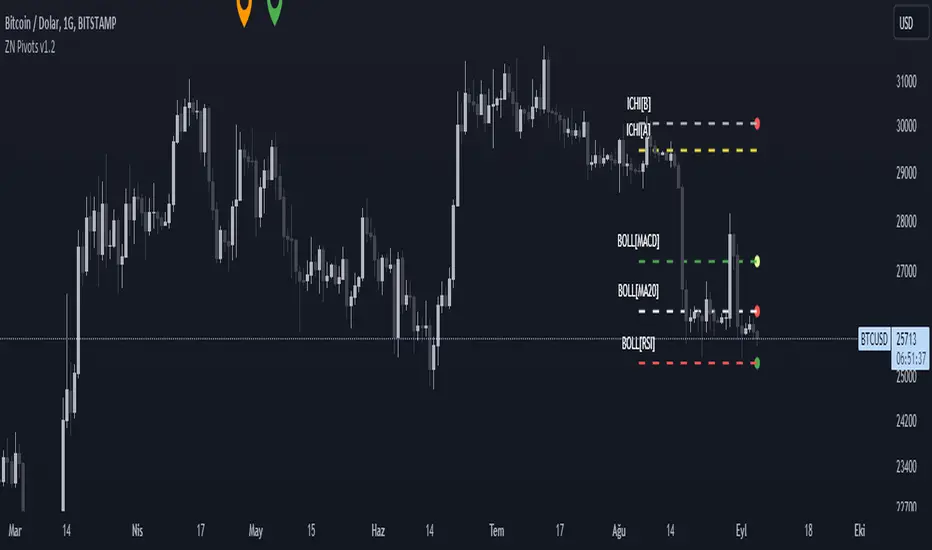
This indicator is aimed at showing the pivot points of the trend by using Ichimoku cloud and Bollinger bands.
Warning
As a result, this indicator should be expected to give an idea of the trend direction, not a trading signal.
Version
v1.0
This indicator is aimed at showing the pivot points of the trend by using Ichimoku cloud and Bollinger bands.
- BOLL[MACD]: Upper Bollinger Band. The red circle formed on it refers to the downward intersection of the MACD indicator. In the downward intersection, a red circle appears.
- BOLL[MA20]: Middle Bollinger Band.
- BOLL[RSI]: Lower Bollinger Band. The red circle formed on it refers to the downward intersection of the RSI indicator. In the downward intersection, a red circle appears.
- ICHI[A]: Ichimoku Leading A Line. The green circle formed on it refers to the upward intersection of the ICHIMOKU indicator.
- ICHI[B]: Ichimoku Leading B Line. The red circle formed on it refers to the downward intersection of the ICHIMOKU indicator.
Warning
As a result, this indicator should be expected to give an idea of the trend direction, not a trading signal.
Version
v1.0
Phát hành các Ghi chú
- [ADDED] If the price closes below the middle band, a red circle is now displayed on the middle band. Otherwise, you will see a green circle.
- [CHANGED] the colors of the upper bollinger band line and the lower band line.
Phát hành các Ghi chú
- The red circle that occurs when the Ichimoku leading A line cuts down the leading B line is now displayed on the leading B.
- Fixed the issue of contraction on large time frames caused by Bollinger lower band calculation.
Phát hành các Ghi chú
- Plot plots showing indicator levels have been replaced with line plots.
- Line width increased from 10 bars to 30 bars.
Mã được bảo vệ
Tập lệnh này được đăng dưới dạng mã nguồn đóng. Tuy nhiên, bạn có thể sử dụng tự do và không giới hạn – tìm hiểu thêm tại đây.
Thông báo miễn trừ trách nhiệm
Thông tin và các ấn phẩm này không nhằm mục đích, và không cấu thành, lời khuyên hoặc khuyến nghị về tài chính, đầu tư, giao dịch hay các loại khác do TradingView cung cấp hoặc xác nhận. Đọc thêm tại Điều khoản Sử dụng.