PINE LIBRARY
Cập nhật arraybrowser
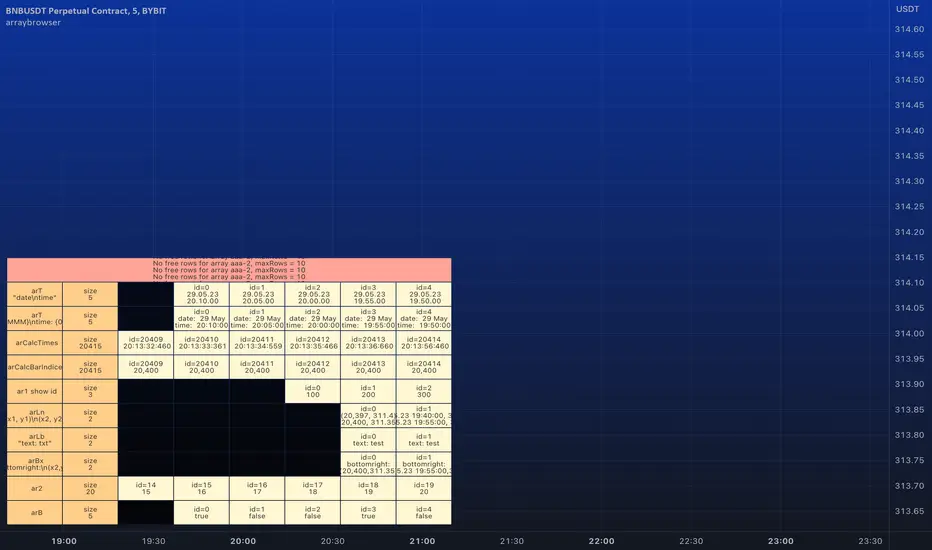
█ ARRAY BROWSER
Add you arrays to the array browser window and scroll them away left and right.
Flexible formatting options (see below).
Many thanks to kaigouthro for his beautiful matrixautotable library. (import kaigouthro/matrixautotable/14)
How to use
Copy the "ARRAY BROWSER" commented code section below to your script and uncomment.
See DEMO section in the library for usage examples.
Basically: add() your arrays and draw() on barstate.islast.
If your script adds the arrays every calculation do not forget to clear() before adding.
Otherwise, since the arrays are added by reference, no need to add them on every bar, every time you draw() the actual values are retrieved.
Up to 10 arrays of each type (float/string/line/label/box) are supported (total 50 arrays).
Change offset in the input settings to scroll left/right.
Usage example:
Pine Script®
Formatting options
For float/int you can always use format string like "{0, time, HH:mm:ss}" or "{0.00}".
Additional options are
- --- Number formats ---
- "number"
- "0"
- "0.0"
- "0.00"
- "0.000"
- "0.0000"
- "0.00000"
- "0.000000"
- "0.0000000"
- --- Date formats ---
- "date"
- "date : time"
- "dd.MM"
- "dd"
- --- Time formats ---
- "time"
- "HH:mm"
- "mm:ss"
- "date time"
- "date, time"
- "date,time"
- "date\time"
For line and box: Empty `format` returns coordinates as "(x1, y1) - (x2, y2)". Otherwise "x1", "x2", "y1", "y2" in `format` string are replaced by values. (e.g. toS(line, "x1, x2") will only return x1 and x2 separated by comma).
For label: Empty `format` returns coordinates and text as "(x, y): text = text". Otherwise "x1", "y1", "txt" in `format` string are replaced by values. (e.g. toS(label, "txt") will only return text of the label)
Add you arrays to the array browser window and scroll them away left and right.
Flexible formatting options (see below).
Many thanks to kaigouthro for his beautiful matrixautotable library. (import kaigouthro/matrixautotable/14)
How to use
Copy the "ARRAY BROWSER" commented code section below to your script and uncomment.
See DEMO section in the library for usage examples.
Basically: add() your arrays and draw() on barstate.islast.
If your script adds the arrays every calculation do not forget to clear() before adding.
Otherwise, since the arrays are added by reference, no need to add them on every bar, every time you draw() the actual values are retrieved.
Up to 10 arrays of each type (float/string/line/label/box) are supported (total 50 arrays).
Change offset in the input settings to scroll left/right.
Usage example:
import moebius1977/arraybrowser/1 as arraybrowser // this alias is used in the copied section, so better keep it
[...]
<COPIED "ARRAY BROWSER" SECTION>
[...]
arbr.clear() // clears all rows and deletes the table
arbr.add(arrayFloat, format = "0.00") // adds an array with title
arbr.add(arrayInt) // adds an array without title
arbr.add(arrayTimes, "array of times 1", "date\ntime") // format date and time so as to fit in the cell.
arbr.add(arrayTimes, "array of times 2", "{0, time, HH:mm}") // format date and time so as to fit in the cell.
arbr.add(arrayString) //
arbr.add(arrayLine, "arrayLines", "(x1, y1)\n(x2,y2)") // use your own format combining "x1", "y1", "x2", "y2"
arbr.add(arrayLabel, "arrayLabel", "txt") // only print label text, no coordinates
arbr.add(arrayBox, showIds = true) // show ID's for this array if input setting is "individually"
arbr.draw() // shows the table with arrays, use on barstate.islast
Formatting options
For float/int you can always use format string like "{0, time, HH:mm:ss}" or "{0.00}".
Additional options are
- --- Number formats ---
- "number"
- "0"
- "0.0"
- "0.00"
- "0.000"
- "0.0000"
- "0.00000"
- "0.000000"
- "0.0000000"
- --- Date formats ---
- "date"
- "date : time"
- "dd.MM"
- "dd"
- --- Time formats ---
- "time"
- "HH:mm"
- "mm:ss"
- "date time"
- "date, time"
- "date,time"
- "date\time"
For line and box: Empty `format` returns coordinates as "(x1, y1) - (x2, y2)". Otherwise "x1", "x2", "y1", "y2" in `format` string are replaced by values. (e.g. toS(line, "x1, x2") will only return x1 and x2 separated by comma).
For label: Empty `format` returns coordinates and text as "(x, y): text = text". Otherwise "x1", "y1", "txt" in `format` string are replaced by values. (e.g. toS(label, "txt") will only return text of the label)
Phát hành các Ghi chú
v2 Added support for bool arrays. Changing text color does not work temporarily.
Phát hành các Ghi chú
v3 A minor bug fix. (in deleteRow())Phát hành các Ghi chú
v4 Same amendment as above.Phát hành các Ghi chú
v5 Added support for varip arrays. Previous versions disrupted behaviour of varip arrays.Thư viện Pine
Theo tinh thần TradingView thực sự, tác giả đã xuất bản mã Pine này dưới dạng thư viện nguồn mở để các lập trình viên Pine khác trong cộng đồng của chúng tôi có thể sử dụng lại. Xin tri ân tác giả! Bạn có thể sử dụng thư viện này riêng tư hoặc trong các bài đăng nguồn mở khác. Tuy nhiên, bạn cần sử dụng lại mã này theo Nội quy chung.
Thông báo miễn trừ trách nhiệm
Thông tin và ấn phẩm không có nghĩa là và không cấu thành, tài chính, đầu tư, kinh doanh, hoặc các loại lời khuyên hoặc khuyến nghị khác được cung cấp hoặc xác nhận bởi TradingView. Đọc thêm trong Điều khoản sử dụng.
Thư viện Pine
Theo tinh thần TradingView thực sự, tác giả đã xuất bản mã Pine này dưới dạng thư viện nguồn mở để các lập trình viên Pine khác trong cộng đồng của chúng tôi có thể sử dụng lại. Xin tri ân tác giả! Bạn có thể sử dụng thư viện này riêng tư hoặc trong các bài đăng nguồn mở khác. Tuy nhiên, bạn cần sử dụng lại mã này theo Nội quy chung.
Thông báo miễn trừ trách nhiệm
Thông tin và ấn phẩm không có nghĩa là và không cấu thành, tài chính, đầu tư, kinh doanh, hoặc các loại lời khuyên hoặc khuyến nghị khác được cung cấp hoặc xác nhận bởi TradingView. Đọc thêm trong Điều khoản sử dụng.