OPEN-SOURCE SCRIPT
Cập nhật NYSE UVOL Ratio
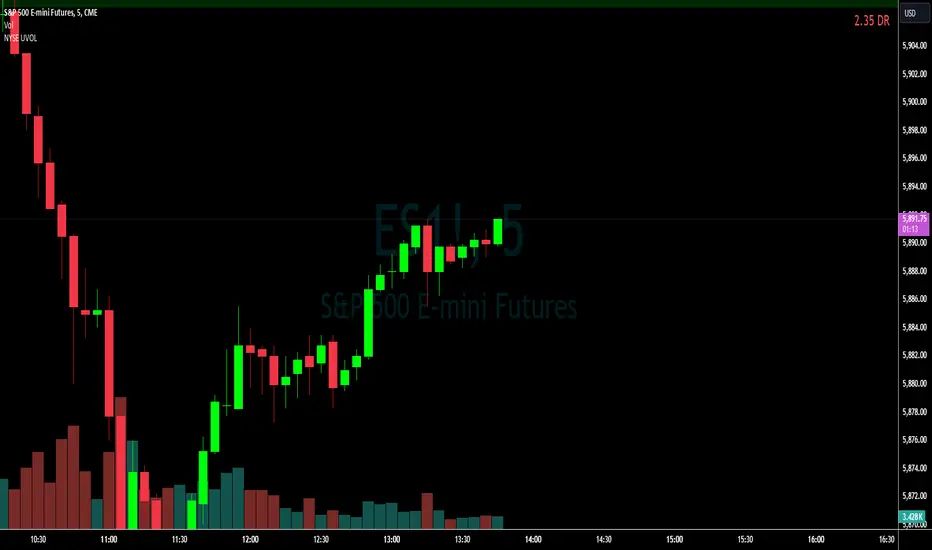
This Pine Script is designed to monitor and display the ratio of advancing volume (UVOL) to declining volume (DVOL) on the NYSE in real-time on your TradingView charts. Here's a breakdown of what each part of the script does:
Indicator Declaration: The script starts by declaring an indicator called "NYSE UVOL" with the option to overlay it directly on the price chart. This allows you to see the volume ratio in context with price movements.
Volume Data Fetching:
Advancing Volume (UVOL): It retrieves the closing value of the advancing volume from the NYSE.
Declining Volume (DVOL): It fetches the closing value of the declining volume.
Ratio Calculation:
The script calculates the ratio of advancing to declining volume. To avoid division by zero, it checks if the declining volume is not zero before performing the division.
Color Coding:
The script assigns a color to the ratio value based on set thresholds:
Red for a ratio less than 1 (more declining than advancing volume).
White for ratios between 1 and 2.
Lime for ratios between 2 and 3.
Green for ratios above 3.
Display Table:
A table is created in the top-right corner of the chart to display the current ratio value.
It updates this table with the latest ratio value at each new bar, displaying the ratio with appropriate color coding for quick reference.
This script provides a visual and numerical representation of market sentiment based on volume data, aiding traders in assessing the balance between buying and selling pressure.
Phát hành các Ghi chú
Modified to avoid fractions when DVOL greater than UVOL.New values are displayed in red when DVOL exceeds UVOL and green when UVOL exceeds DVOL.
Mã nguồn mở
Theo đúng tinh thần TradingView, tác giả của tập lệnh này đã công bố nó dưới dạng mã nguồn mở, để các nhà giao dịch có thể xem xét và xác minh chức năng. Chúc mừng tác giả! Mặc dù bạn có thể sử dụng miễn phí, hãy nhớ rằng việc công bố lại mã phải tuân theo Nội quy.
Thông báo miễn trừ trách nhiệm
Thông tin và các ấn phẩm này không nhằm mục đích, và không cấu thành, lời khuyên hoặc khuyến nghị về tài chính, đầu tư, giao dịch hay các loại khác do TradingView cung cấp hoặc xác nhận. Đọc thêm tại Điều khoản Sử dụng.