OPEN-SOURCE SCRIPT
Cập nhật TSI Market Timer + Volatility Meter
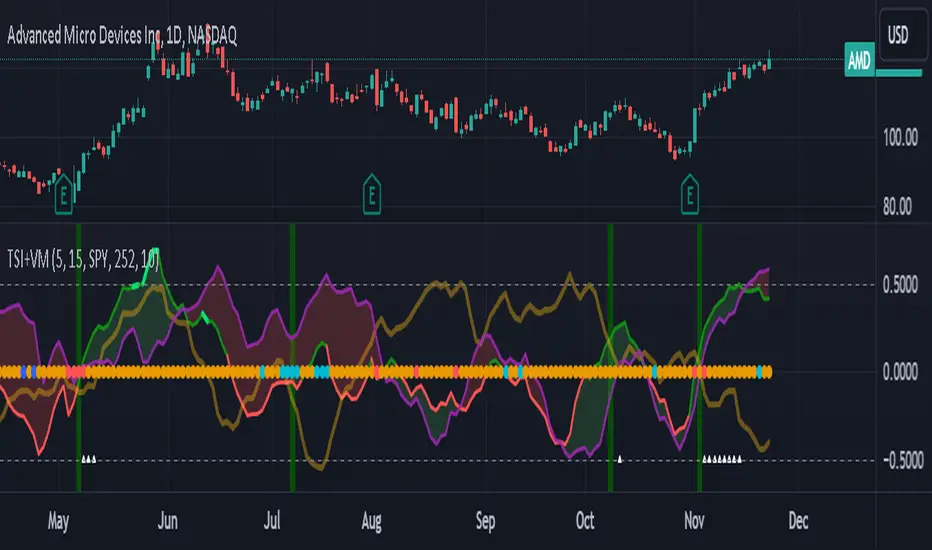
This is the TSI Market Timer. It is years in the making and it is comprised of four indicators in one. The stock (or source) is run through an indicator called the True Strength Indicator with settings(5,15) , then the TSI is run on both the Index(SPY) by default and what I call a Trigger line which is basically the TSI applied to the DXY (US Dollar Index).
Midline Volatility Indicator:
Lastly, we have a volatility indicator on the midline. The colors of the midline indicate levels of volatility. For the lowest volatility in the last 100 days, the dot turns dark blue. For the lowest volatility in 30 days, the dot turns aqua. For regular volatility, it remains orange. And last, for higher volatility of the last 100 days, it turns red. These are more or less arbitrary but they do come in handy.
Settings for Green/Red Shading:
Next on the indicator are the settings. You can toggle a color change between the stock/source and the index(spy). If the stock/source is greater than the index, it will color the area in between a green and if it is below the index, it will be red.
There is also a toggle for the stock/source and the trigger/DXY. This will also show green when the stock is above the trigger and red if it is below the trigger.
By turning on both of these, you get light green and dark green areas as well as red and darker red areas. The lighter green represent when the stock is above both the index and the trigger and conversely for the red areas.
Settings for vertical line crossings:
When the stock crosses the trigger/dxy line, it shows a green vertical line signal. When the stock crosses below the trigger/dxy, a red vertical line is shown.
You can turn these off by toggling them in the settings.
Stacked Condition:
Lastly, we have a "stacked condition" which shows up as a white triangle at the bottom when the condition of the stock being above the index and the trigger below the zero line.
New Highs:
If you see the stock line turn lime green, this indicates a new high was reached for the last 255 days/periods. This is like a new 52 week high signal.
Note:
This indicator is made mostly for the stock market. It may work ok during the week for crypto but using the trigger/dxy and index lines on the weekends doesn't work too well as they will be flat.
Also note that this indicator is not a recommendation to buy or sell any stock/instrument. It is only a study of market conditions. Any analysis should be followed up with volume analysis or other confirming indicators.
Phát hành các Ghi chú
This is the TSI Market Timer. It is years in the making and it is comprised of four indicators in one. The stock (or source) is run through an indicator called the True Strength Indicator with settings(5,15) , then the TSI is run on both the Index(SPY) by default and what I call a Trigger line which is basically the TSI applied to the DXY (US Dollar Index).Midline Volatility Indicator:
Lastly, we have a volatility indicator on the midline. The colors of the midline indicate levels of volatility. For the lowest volatility in the last 100 days, the dot turns dark blue. For the lowest volatility in 30 days, the dot turns aqua. For regular volatility, it remains orange. And last, for higher volatility of the last 100 days, it turns red. These are more or less arbitrary but they do come in handy.
Settings for Green/Red Shading:
Next on the indicator are the settings. You can toggle a color change between the stock/source and the index(spy). If the stock/source is greater than the index, it will color the area in between a green and if it is below the index, it will be red.
There is also a toggle for the stock/source and the trigger/DXY. This will also show green when the stock is above the trigger and red if it is below the trigger.
By turning on both of these, you get light green and dark green areas as well as red and darker red areas. The lighter green represent when the stock is above both the index and the trigger and conversely for the red areas.
Settings for vertical line crossings:
When the stock crosses the trigger/dxy line, it shows a green vertical line signal. When the stock crosses below the trigger/dxy, a red vertical line is shown.
You can turn these off by toggling them in the settings.
Stacked Condition:
Lastly, we have a "stacked condition" which shows up as a white triangle at the bottom when the condition of the stock being above the index and the trigger below the zero line.
New Highs:
If you see the stock line turn lime green, this indicates a new high was reached for the last 255 days/periods. This is like a new 52 week high signal.
Note:
This indicator is made mostly for the stock market. It may work ok during the week for crypto but using the trigger/dxy and index lines on the weekends doesn't work too well as they will be flat.
Also note that this indicator is not a recommendation to buy or sell any stock/instrument. It is only a study of market conditions. Any analysis should be followed up with volume analysis or other confirming indicators.
Mã nguồn mở
Theo đúng tinh thần TradingView, tác giả của tập lệnh này đã công bố nó dưới dạng mã nguồn mở, để các nhà giao dịch có thể xem xét và xác minh chức năng. Chúc mừng tác giả! Mặc dù bạn có thể sử dụng miễn phí, hãy nhớ rằng việc công bố lại mã phải tuân theo Nội quy.
Thông báo miễn trừ trách nhiệm
Thông tin và các ấn phẩm này không nhằm mục đích, và không cấu thành, lời khuyên hoặc khuyến nghị về tài chính, đầu tư, giao dịch hay các loại khác do TradingView cung cấp hoặc xác nhận. Đọc thêm tại Điều khoản Sử dụng.