D Indicators - Intraday Tool
1) Trend Indicators
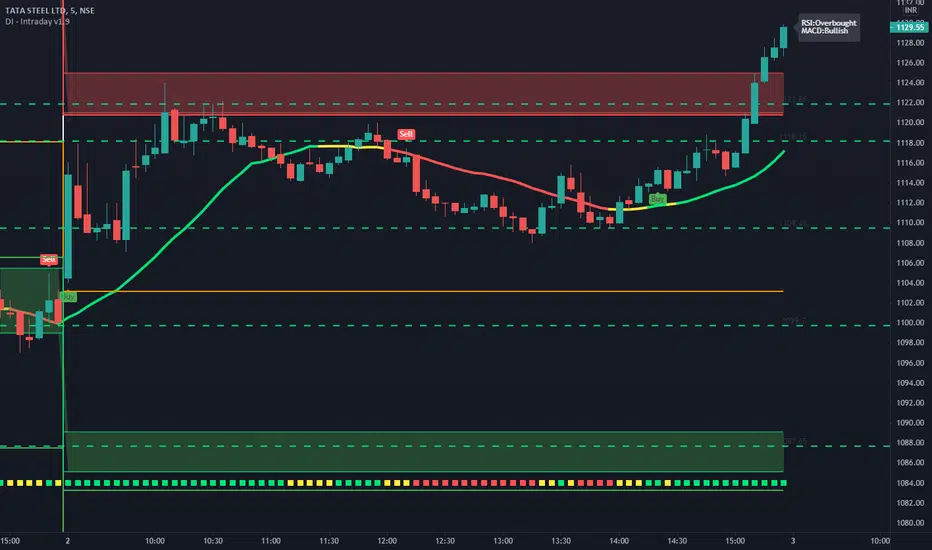
# Both the trend indicators are multicolored.
# Very simple to Understand. Yellow means no trade zone, green - go long
, and red - go short.
# Trend Indicator 1 is an SMA(20). It will change its color according to the trend
of the market.
# Trend Indicator 2 will be plotted at the bottom of the screen. Based upon RSI
# Buy/Sell labels are synced with Trend Indicator 1. Wait for the close of the candle
to enter.
2) Pivot Points
# Plots Standard Pivots on the chart.
# Additional option for plotting Fibonacci pivots is also given.
# Plots standard pivots up to S5 and R5
# At the middle, it is pivot point (PP) level and multiple
support and resistance levels
3) Daily Range
# It plots 2 important levels at the starting of the day.
# 2 bands are plotted in the morning when the market opens,
resembling strong support/resistance zones.
4) Support/Resistance
# This indicator is used for finding support and resistance levels on charts.
# So one can plan Targets and SL accordingly
# Lines will change color automatically if any candle closes above the support/resistance line. It will change it's
to green. Similarly, it will change its color to red if the price is below the sup
5) CPR and CPR Next Day
# CPR is a very known indicator that indicates whether that helps in-stock selection.
# This is a very crucial indicator as it shows the CPR levels for the next day.
# One can make a guess by looking at the next day's CPR that whether the stock is going to be trendy/sideways the next day.
# Isn't it cool if you had some idea about tomorrow's behavior of the market's trend.
6) VWAP
7) Major Intraday Indicators
# Plots label indicating the status of RSI and MACD.
8) Bollinger Bands
# The Upper and Lower Bands are used as a way to measure volatility
by observing the relationship between the Bands and price
9) First bar of the day
# Plots the high and low of the first candle.
10) Different buy/sell labels and EHMA for forex.
Thanks are regards,
D Indicators
Tập lệnh chỉ hiển thị cho người được mời
Chỉ những người dùng được tác giả cho phép mới có quyền truy cập vào tập lệnh này và thường phải trả phí. Bạn có thể thêm tập lệnh vào mục yêu thích, nhưng bạn sẽ chỉ có thể sử dụng sau khi yêu cầu cấp phép và được tác giả cấp quyền — hãy tìm hiểu thêm tại đây. Để biết thêm chi tiết, hãy làm theo hướng dẫn của tác giả bên dưới hoặc liên hệ trực tiếp với D_Indicators.
TradingView KHÔNG khuyến khích trả tiền hoặc sử dụng tập lệnh trừ khi bạn hoàn toàn tin tưởng tác giả và hiểu cách hoạt động của tập lệnh. Bạn cũng có thể tìm thấy các giải pháp thay thế miễn phí, mã nguồn mở trong mục tập lệnh cộng đồng của chúng tôi.
Hướng dẫn của tác giả
Cảnh báo: vui lòng đọc hướng dẫn của chúng tôi về các tập lệnh chỉ dành cho người được mời trước khi yêu cầu quyền truy cập.
Thông báo miễn trừ trách nhiệm
Tập lệnh chỉ hiển thị cho người được mời
Chỉ những người dùng được tác giả cho phép mới có quyền truy cập vào tập lệnh này và thường phải trả phí. Bạn có thể thêm tập lệnh vào mục yêu thích, nhưng bạn sẽ chỉ có thể sử dụng sau khi yêu cầu cấp phép và được tác giả cấp quyền — hãy tìm hiểu thêm tại đây. Để biết thêm chi tiết, hãy làm theo hướng dẫn của tác giả bên dưới hoặc liên hệ trực tiếp với D_Indicators.
TradingView KHÔNG khuyến khích trả tiền hoặc sử dụng tập lệnh trừ khi bạn hoàn toàn tin tưởng tác giả và hiểu cách hoạt động của tập lệnh. Bạn cũng có thể tìm thấy các giải pháp thay thế miễn phí, mã nguồn mở trong mục tập lệnh cộng đồng của chúng tôi.
Hướng dẫn của tác giả
Cảnh báo: vui lòng đọc hướng dẫn của chúng tôi về các tập lệnh chỉ dành cho người được mời trước khi yêu cầu quyền truy cập.