OPEN-SOURCE SCRIPT
Normalized and Smoothed Cumulative Delta for Top 5 NASDAQ Stocks
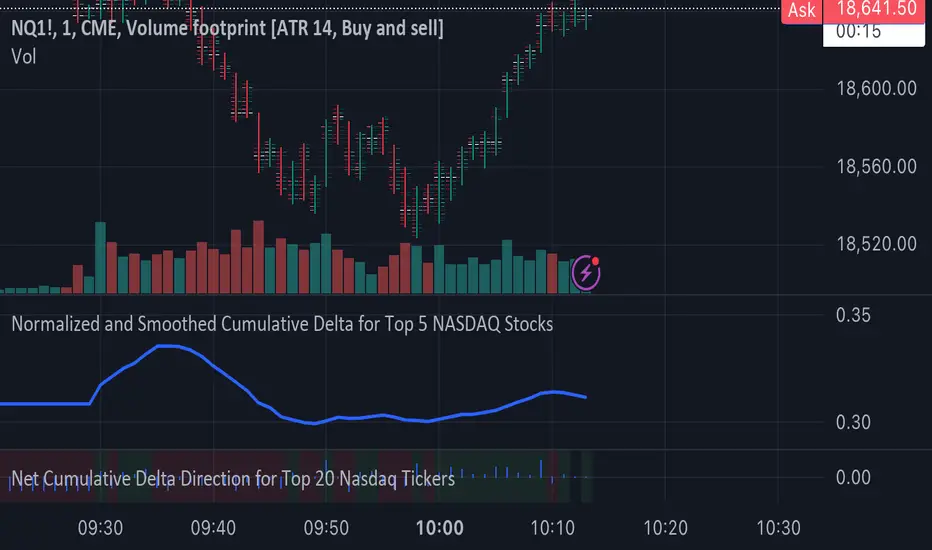
This script is designed to create a TradingView indicator called **"Normalized and Smoothed Cumulative Delta for Top 5 NASDAQ Stocks."** The purpose of this indicator is to track and visualize the cumulative price delta (the change in price from one period to the next) for the top five NASDAQ stocks: Apple Inc. (AAPL), Microsoft Corporation (MSFT), Alphabet Inc. (GOOGL), Amazon.com Inc. (AMZN), and Meta Platforms Inc. (FB).
### Key Features of the Script:
1. **Ticker Selection**:
- The script focuses on the top five NASDAQ stocks by automatically setting their tickers.
2. **Price Data Retrieval**:
- It fetches the closing prices for each of these stocks using the `request.security` function for the current timeframe.
3. **Delta Calculation**:
- The script calculates the delta for each stock, which is simply the difference between the current closing price and the previous closing price.
4. **Cumulative Delta Calculation**:
- It calculates the cumulative delta for each stock by adding the current delta to the previous cumulative delta. This helps track the total change in price over time.
5. **Summing and Smoothing**:
- The cumulative deltas for all five stocks are summed together.
- The script then applies an Exponential Moving Average (EMA) with a period of 5 to smooth the summed cumulative delta, making the indicator less sensitive to short-term fluctuations.
6. **Normalization**:
- To ensure the cumulative delta is easy to interpret, the script normalizes it to a range of 0 to 1. This is done by tracking the minimum and maximum values of the smoothed cumulative delta and scaling the data accordingly.
7. **Visualization**:
- The normalized cumulative delta is plotted as a smooth line, allowing users to see the overall trend of the cumulative price changes for the top five NASDAQ stocks.
- A horizontal line is added at 0.5, serving as a midline reference, which can help traders quickly assess whether the normalized cumulative delta is above or below its midpoint.
### Usage:
This indicator is particularly useful for traders and investors who want to monitor the aggregated price movements of the top NASDAQ stocks, providing a high-level view of market sentiment and trends. By smoothing and normalizing the data, it offers a clear and concise visualization that can be used to identify potential market turning points or confirm ongoing trends.
Mã nguồn mở
Theo đúng tinh thần TradingView, tác giả của tập lệnh này đã công bố nó dưới dạng mã nguồn mở, để các nhà giao dịch có thể xem xét và xác minh chức năng. Chúc mừng tác giả! Mặc dù bạn có thể sử dụng miễn phí, hãy nhớ rằng việc công bố lại mã phải tuân theo Nội quy.
Thông báo miễn trừ trách nhiệm
Thông tin và các ấn phẩm này không nhằm mục đích, và không cấu thành, lời khuyên hoặc khuyến nghị về tài chính, đầu tư, giao dịch hay các loại khác do TradingView cung cấp hoặc xác nhận. Đọc thêm tại Điều khoản Sử dụng.