Goersch Trend
Goersch Trend Indicator for TradingView is a trend indicator that shows the actual trend and the trend strength based on the price movement of the past. The indicator can be used for any underlying and trading timeframe. The special feature is that it is extremely easy to interpret and that it works "out-of-the-box". The calculation automatically adjusts to the displayed timeframe. The interpretation of the Goersch Trned indicator is always the same - whether you are looking at a stock, a currency, an index or a commodity. Regardless of whether you work in the 5-minute chart, hourly, daily or even weekly chart. It is extremely simple to judge whether an underlying is running in a trend, whether this trend strength is currently increasing (stable) or decreasing (when the trend is weakening), or whether the trend is currently changing direction. The indicator shows you the important information at a glance.
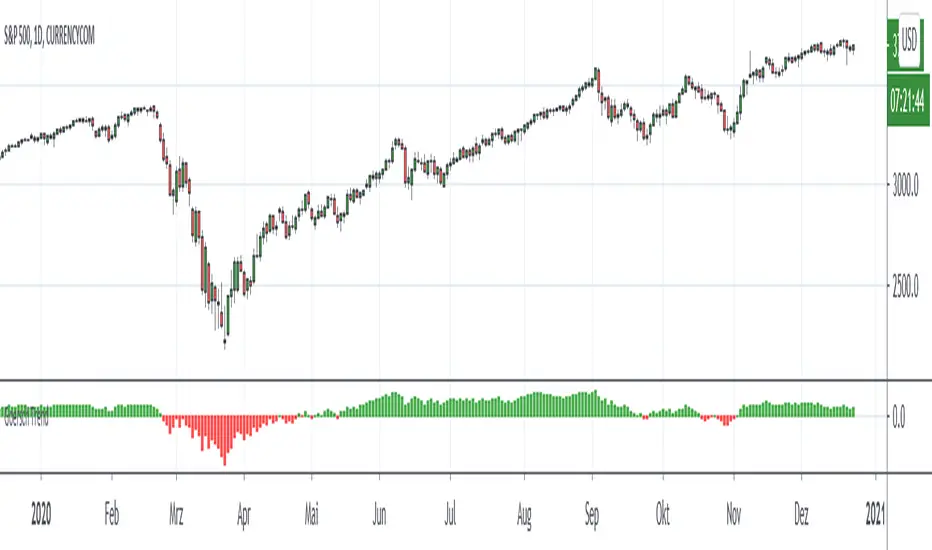
The interpretation of the Goersch Trend indicator is very simple. Red bars represent a downward trend, green bars appear during an upward trend. The change from red to green signals a change from a downward to an upward trend and vice versa. The height of the bars represents the trend strength. The trend strength decreases when the bars become shorter. The change from red to green then signals a completed trend change.
For the calculation of the bar height, the fluctuation of a price change index is used as a basis in the Goersch Trend Indicator. The price change index is calculated from the respective candle closing price and the true high or true low of the previous candle, which is added or subtracted accordingly. From this price change index, a long-term moving average is calculated, the difference between this average and the price change index is visualized by means of the red and green bars.
To get access to the script, please PM, or send a message to the email address in the signature.
DEUTSCH:
Beim Goersch Trend Indikator für TradingView handelt es sich um einen Trend-Indikator, der anhand der Preisbewegung der Vergangenheit den Trend sowie die Trendstärke anzeigt. Verwendet werden kann der Indikator für jegliche Basiswerte und Zeiteinheiten. Das Besondere ist, dass er extrem leicht zu interpretieren ist und dass er "out-of-the-box" arbeitet. Die Berechnung passt sich automatisch auf die dargestellte Zeitebene an. So ist eine Interpretation immer gleich – egal ob Sie eine Aktie, eine Währung, einen Index oder einen Rohstoff betrachten. Unabhängig davon, ob Sie im 5-Minuten-Chart, Stunden-, Tages- oder gar Wochen-Chart arbeiten. Dabei ist es äußerst simpel zu beurteilen, ob ein Wert in einem Trend läuft, ob diese Trendstärke gerade zunimmt (also stabil ist) oder abnimmt (der Trend also schwächer wird), oder ob der Trend gerade kippt. Der Indikator zeigt Ihnen die wichtigen Informationen auf einen Blick.
Die Interpretation des Goersch Trend Indikators ist denkbar einfach. Rote Balken stehen für einen Abwärtstrend, grüne Balken erscheinen während eines Aufwärtstrends. Der Wechsel von Rot auf Grün signalisiert einen Wechsel vom Abwärts- in einen Aufwärtstrend und umgekehrt. Die Höhe der Balken repräsentiert die Trendstärke. Dadurch ergibt es sich schon, dass beispielsweise die Trendstärke abnimmt, wenn die Balken kürzer werden. Der Wechsel von Rot auf Grün signalisiert dann einen vollendeten Trendwechsel.
Für die Berechnung der Balkenhöhe wird im Goersch Trend Indikator die Schwankung eines Preisveränderungsindex zugrunde gelegt. Dieser errechnet sich aus dem jeweiligen Kerzen-Schlusskurs und dem True-High bzw. True-Low der vorhergehenden Kerze, das entsprechend hinzugerechnet oder abgezogen wird. Von diesem Preisveränderungsindex wird ein langfristiger gleitender Durchschnitt errechnet, die Differenz dieses Durchschnittes und des Preisveränderungsindex wird mittels der roten und grünen Balken visualisiert.
Um Zugang zum Skript zu erhalten, bitte eine PM, oder eine Nachricht an die Emailadresse in der Signatur.
Tập lệnh chỉ hiển thị cho người được mời
Only users approved by the author can access this script. You'll need to request and get permission to use it. This is typically granted after payment. For more details, follow the author's instructions below or contact DaytradingCoach directly.
TradingView does NOT recommend paying for or using a script unless you fully trust its author and understand how it works. You may also find free, open-source alternatives in our community scripts.
Hướng dẫn của tác giả
Email: info@martingoersch.de
Web: martingoersch.de
Thông báo miễn trừ trách nhiệm
Tập lệnh chỉ hiển thị cho người được mời
Only users approved by the author can access this script. You'll need to request and get permission to use it. This is typically granted after payment. For more details, follow the author's instructions below or contact DaytradingCoach directly.
TradingView does NOT recommend paying for or using a script unless you fully trust its author and understand how it works. You may also find free, open-source alternatives in our community scripts.
Hướng dẫn của tác giả
Email: info@martingoersch.de
Web: martingoersch.de