OPEN-SOURCE SCRIPT
KASPA Slope Oscillator
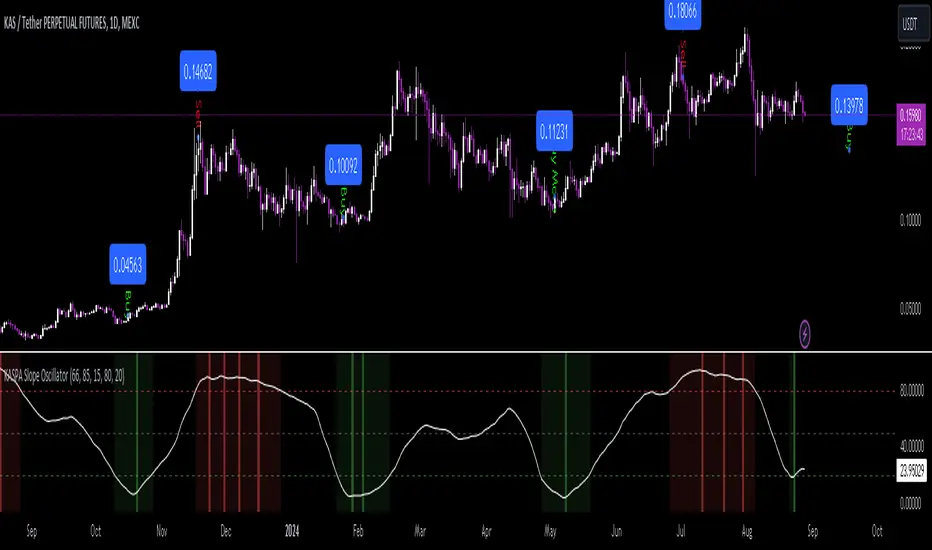
KASPA [KAS] Slope Oscillator for analyzing KASPA on the 1D (daily) chart.
The indicator is plotted in a separate pane below the price chart and uses a mathematical approach to calculate and visualize the momentum or "slope" of KASPA's price movements.
Input Parameters:
Slope Window (days):
Defines the period (66 days by default) over which the slope is calculated.
Normalization Window (days):
The window size (85 days) for normalizing the slope values between 0 and 100.
Smoothing Period:
The number of days (15 days) over which the slope values are smoothed to reduce noise.
Overbought and Oversold Levels:
Threshold levels set at 80 (overbought) and 20 (oversold), respectively.
Calculation of the Slope:
Logarithmic Price Calculation:
Converts the close price of KASPA into a logarithmic scale to account for exponential growth or decay.
Rolling Slope:
Computes the rate of change in logarithmic prices over the defined slope window.
Normalization:
The slope is normalized between 0 and 100, allowing easier identification of extreme values.
Smoothing and Visualization:
Smoothing the Slope:
A Simple Moving Average (SMA) is applied to the normalized slope for the specified smoothing period.
Plotting the Oscillator:
The smoothed slope is plotted on the oscillator chart. Horizontal lines indicate overbought (80), oversold (20), and the mid-level (50).
Background Color Indications:
Background colors (red or green) indicate when the slope crosses above the overbought or below the oversold levels, respectively, signaling potential buy or sell conditions.
Detection of Local Maxima and Minima:
The code identifies local peaks (maxima) above the overbought level and troughs (minima) below the oversold level.
Vertical background lines are highlighted in red or green at these points, signaling potential reversals.
Short Summary:
The oscillator line fluctuates between 0 and 100, representing the normalized momentum of the price.
Red background areas indicate periods when the oscillator is above the overbought level (80), suggesting a potential overbought condition or a sell signal.
Green background areas indicate periods when the oscillator is below the oversold level (20), suggesting a potential oversold condition or a buy signal.
The vertical lines on the background mark local maxima and minima where price reversals may occur.
(I also want to thank ForgoWork for optimizing visuality and cleaning up the source code)
Mã nguồn mở
Theo đúng tinh thần TradingView, tác giả của tập lệnh này đã công bố nó dưới dạng mã nguồn mở, để các nhà giao dịch có thể xem xét và xác minh chức năng. Chúc mừng tác giả! Mặc dù bạn có thể sử dụng miễn phí, hãy nhớ rằng việc công bố lại mã phải tuân theo Nội quy.
Thông báo miễn trừ trách nhiệm
Thông tin và các ấn phẩm này không nhằm mục đích, và không cấu thành, lời khuyên hoặc khuyến nghị về tài chính, đầu tư, giao dịch hay các loại khác do TradingView cung cấp hoặc xác nhận. Đọc thêm tại Điều khoản Sử dụng.