OPEN-SOURCE SCRIPT
Relative Volume
Cập nhật
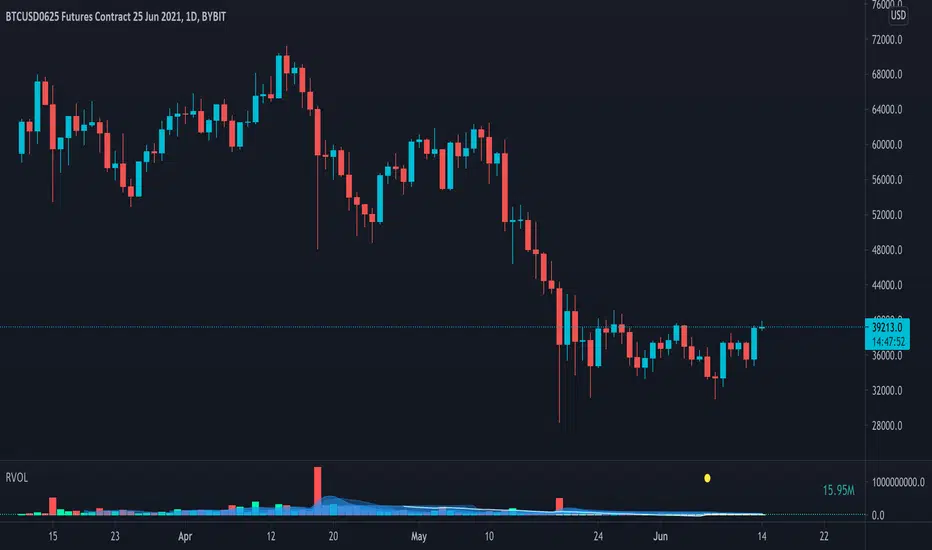
Volume can be a very useful tool if used correctly. Relative volume is designed to filter out the noise and highlight anomalies assisting traders in tracking institutional movements. This tool can be used to identify stop loss hunters and organized dumps. It uses a variety of moving averages to hide usual activity and features an LSMA line to show trend. Trend columns are shown to highlight activity and can be seen at bottom of the volume columns, this is done using ZLSMA and LSMA.

The above chart shows an example of 2 indicators being used on the 15 min chart. The bottom indicator is set to the 1 min chart. Traders can see a large dump on the 1 min chart as institutions wipe out any tight stop losses. Next they buy back in scooping up all those long positions.

This is an example layout using a split screen setup and multiple timeframes ranging from 1 min to 30 mins. This gives a clear indication of trends and make it easy to pickup on institutional behaviour. Tip: Double clicking indicator background will maximize RVOL to the split screen window.
The above chart shows an example of 2 indicators being used on the 15 min chart. The bottom indicator is set to the 1 min chart. Traders can see a large dump on the 1 min chart as institutions wipe out any tight stop losses. Next they buy back in scooping up all those long positions.
This is an example layout using a split screen setup and multiple timeframes ranging from 1 min to 30 mins. This gives a clear indication of trends and make it easy to pickup on institutional behaviour. Tip: Double clicking indicator background will maximize RVOL to the split screen window.
Phát hành các Ghi chú
Added signals and alerts-Signal for entry point
-Alert for when volume crosses defined amount.
-Alert for entry point
Entry point signals pick up great on the 1 second to 1 min charts.
Phát hành các Ghi chú
Fixed entry signal and added price linePhát hành các Ghi chú
Added current bar volume. Can be turned off in settings.Phát hành các Ghi chú
Fixed problem with current bar volume numberPhát hành các Ghi chú
Fixed rounding issue.Phát hành các Ghi chú
Ticker ID can now be turned on in settings for split screen setups.Phát hành các Ghi chú
Added option to display average volume. Previously this indicator just filtered out the noise. Now it also highlights anomalies. This extra plot gives traders many different options to present the data. Here are some examples:By changing the style options for the volume columns traders can switch between column, histogram or step line. Removing the blue moving averages can clean the indicator or even remove everything but the anomalies. Adjusting transparency can also help hide the volume columns to give a more traditional look as seen in the 3rd example on top indicator. These anomaly columns are big movements in volume and tend to dictate the short term trend of price action.
Mã nguồn mở
Theo tinh thần TradingView thực sự, tác giả của tập lệnh này đã xuất bản dưới dạng nguồn mở để các nhà giao dịch có thể hiểu và xác minh. Chúc mừng tác giả! Bạn có thể sử dụng miễn phí. Tuy nhiên, bạn cần sử dụng lại mã này theo Quy tắc nội bộ. Bạn có thể yêu thích nó để sử dụng nó trên biểu đồ.
Thông báo miễn trừ trách nhiệm
Thông tin và ấn phẩm không có nghĩa là và không cấu thành, tài chính, đầu tư, kinh doanh, hoặc các loại lời khuyên hoặc khuyến nghị khác được cung cấp hoặc xác nhận bởi TradingView. Đọc thêm trong Điều khoản sử dụng.