OPEN-SOURCE SCRIPT
COMBINED EMA & SMA + DOUBLE DEMA, $TOTAL 1W / 5D -- Ruslan
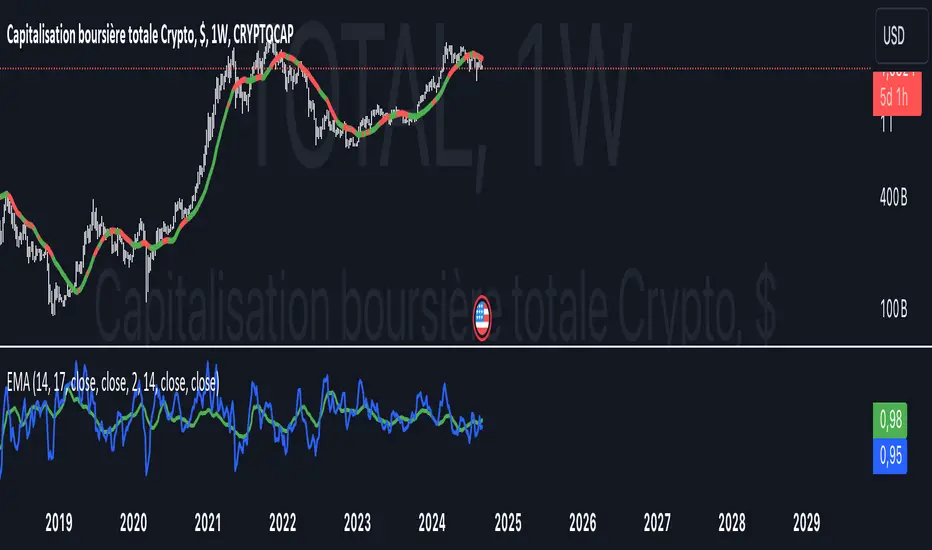
This Pine Script indicator, **"EMAS"**, provides an enhanced visualization of multiple types of moving averages, including both **Exponential Moving Averages (EMA)**, **Simple Moving Averages (SMA)**, and **Double Exponential Moving Averages (DEMA)**. It allows the user to observe the relationship between these different types of moving averages and apply regime-based coloring to price bars based on the comparison between the EMAs and DEMAs.
#### Key Features:
1. **EMA & SMA:**
- **EMA (Exponential Moving Average):** Calculated using a customizable lookback period (default 17), the EMA places greater weight on more recent prices, making it react faster to price changes.
- **SMA (Simple Moving Average):** Uses an equal-weighted average over a customizable lookback period (default 14), providing a slower-moving average compared to the EMA.
2. **DEMA (Double Exponential Moving Average):**
- Two separate DEMA lines are plotted using different lookback periods (default 2 and 14). The DEMA is a smoother and faster-responding version of the EMA, intended to reduce lag while retaining trend-following characteristics.
3. **Combined Signals:**
- The script calculates ratios between EMA/SMA (`comb`) and DEMA1/DEMA2 (`combd`) to generate a **regime-based bar coloring system**:
- If `combd > comb`: The bars are colored **green**, indicating that DEMAs are outperforming the EMAs, potentially signaling a stronger trend or momentum.
- If `comb > combd`: The bars are colored **red**, suggesting that the EMAs are dominant, which may indicate a different phase of the market.
4. **Signal SMA:**
- A 21-period **SMA** is plotted as a general trend-following signal. It provides a broader perspective on the current price trend, helping to smooth out short-term fluctuations.
5. **Customizable Options:**
- **"Show MAs?"**: The user has the option to toggle the display of the EMA, SMA, and DEMA lines on or off.
- **Custom Period Inputs**: Each type of moving average can have its period length customized via the input settings for better adaptability to different market conditions.
#### How to Use the Indicator:
- **Trend Following**:
The **EMA, SMA, and DEMA** values can help you determine the direction of the trend. When the EMA is above the SMA, it could indicate a stronger, more recent upward momentum. Similarly, DEMA comparisons provide smoother and faster trend signals.
- **Bar Coloring Regime**:
The **bar color** gives a quick visual cue of the regime:
- **Green bars** suggest that DEMAs are indicating stronger bullish or bearish signals compared to the EMAs.
- **Red bars** imply the opposite, where EMAs may be showing stronger signals, but possibly with more noise or lag.
- **Signal SMA**:
The **21-period SMA** line can be used as a simple trend indicator. When the price is above this line, it could signify an uptrend, while price movement below the line might indicate a downtrend.
#### Custom Inputs:
- **EMA Length**: Default is 17, but can be adjusted to fit your trading style.
- **SMA Length**: Default is 14.
- **DEMA Lengths**: Two customizable inputs for DEMA (default 2 and 14).
- **Source Selection**: You can choose which price source (close, open, high, low, etc.) to use for each calculation (default is the closing price).
#### Conclusion:
This indicator is useful for traders who wish to blend **trend-following strategies** (using EMA, SMA, and DEMA) with **visual regime indicators** (bar coloring). It is highly customizable, allowing traders to adjust settings based on their market approach. The combination of EMAs and DEMAs provides a nuanced view of price dynamics, potentially leading to better-informed trading decisions.
Mã nguồn mở
Theo đúng tinh thần TradingView, tác giả của tập lệnh này đã công bố nó dưới dạng mã nguồn mở, để các nhà giao dịch có thể xem xét và xác minh chức năng. Chúc mừng tác giả! Mặc dù bạn có thể sử dụng miễn phí, hãy nhớ rằng việc công bố lại mã phải tuân theo Nội quy.
Thông báo miễn trừ trách nhiệm
Thông tin và các ấn phẩm này không nhằm mục đích, và không cấu thành, lời khuyên hoặc khuyến nghị về tài chính, đầu tư, giao dịch hay các loại khác do TradingView cung cấp hoặc xác nhận. Đọc thêm tại Điều khoản Sử dụng.