OPEN-SOURCE SCRIPT
Kernel Regression Ribbon
Cập nhật
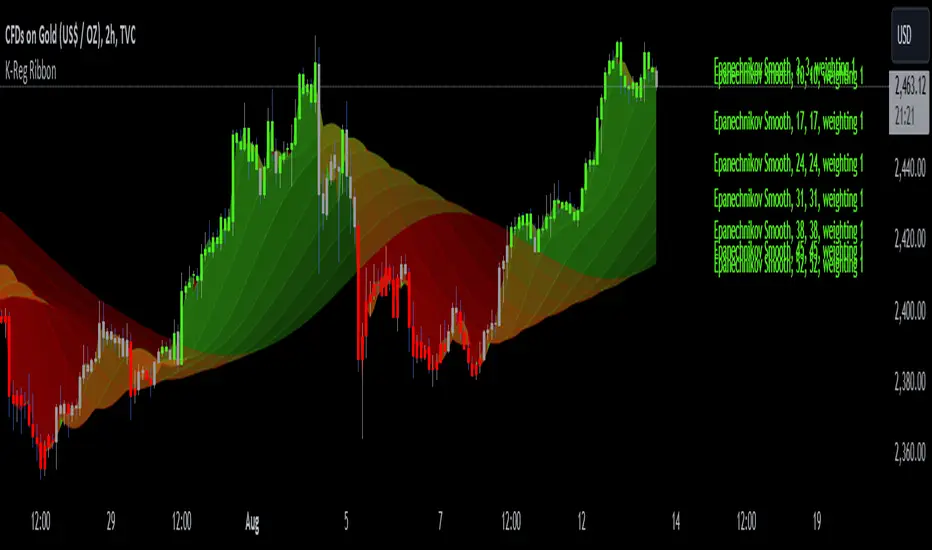
Kernel Regression Ribbon is a flexible, visually pleasing trend identification tool. Plotting 8 different kernel regressions of different types and parameters allows the user to see where levels of support and resistance are being tested, retested and broken.
What’s Kernel Regression?
A statistical method for estimating the best fitting curve for a dataset, in this case, a time/price chart.
How’s Kernel Regression different from a Moving Average?
A Moving Average is basically a simple form of Kernel Regression, in that it uses a fixed (Retangular) Kernel function. In an MA, all data points are weighted equally over its length. However, a Kernel function reacts more to data points that are closer to the current point. This means it will adapt more quickly to changes in data than an MA. Due to this adaptability, Kernel functions often form part of Machine Learning.
Using this indicator:
Explore the default Regular mode first to get a feel for the inputs, which are more numerous than for MAs. Try out different settings, filters and intervals to get the best out of each kernel. Not all parameters are available for each KR. There are info tips to explain this in the menu, but I’ve also included handy, optional labels on the chart for each KR as a more accessible guide.
Once you know your way round the Regular mode, check out the Presets and start changing the parameters of each kernel to your liking in the “User KR1, KR2, … “ mode. Each kernel type has its strong and weak points. Blending different kernels is where this indicator comes into its own. Give your charts a funky shine!
This indicator does NOT repaint.
This script acknowledges, and hopefully showcases, the great work of veryfid Kernel Regression Toolkit.
Phát hành các Ghi chú
Bug fixPhát hành các Ghi chú
Minor update:Alerts added. Regular, default preset modified.
No change to calculation method.
Phát hành các Ghi chú
Added the Epanechnikov kernel, a continuous probability distribution that is defined on a finite interval. Similar to the Rational Quadratic, x-axis weighting can be adjusted.This kernel is less well-known in statistics, as the Gaussian kernel is pretty much the go-to. Epanechnikov, parabolic in nature, may be more efficient.
This addition is displayed in the default setting when you launch the updated version.
Enjoy!
Mã nguồn mở
Theo tinh thần TradingView thực sự, tác giả của tập lệnh này đã xuất bản dưới dạng nguồn mở để các nhà giao dịch có thể hiểu và xác minh. Chúc mừng tác giả! Bạn có thể sử dụng miễn phí. Tuy nhiên, bạn cần sử dụng lại mã này theo Quy tắc nội bộ. Bạn có thể yêu thích nó để sử dụng nó trên biểu đồ.
Thông báo miễn trừ trách nhiệm
Thông tin và ấn phẩm không có nghĩa là và không cấu thành, tài chính, đầu tư, kinh doanh, hoặc các loại lời khuyên hoặc khuyến nghị khác được cung cấp hoặc xác nhận bởi TradingView. Đọc thêm trong Điều khoản sử dụng.