Price-Drive MTF Instagram LuckyNickVAFor Showing The Price Drive & The Direction Of Price & You Can Adjust It To Specific Timeframes.Chỉ báo Pine Script®của Nickafella1167
Price Trend MeterYet another sweet little indicator which measures price pressure over specific period of time. I call it Price Trend Meter (PTM), It's basically similar to the indicator 'Volume Trend Meter' (VTM) but this time the calculations are based on price rather than volume. The indicator sums up all the prices of the green candles and red candles over a specific period of time (source and bars back can be adjusted in indicator settings). ======= Calculation ========== For Green Column: Total price of green candles is higher than total red candles price for a specific bars back. For Red Column: Total price of red candles is higher than the total green candles price for a specific bars back. ======= Price Trend Meter Colors ======= Green: Increasing buying pressure. Red: Increasing selling pressure. For the Volume Trend Meter indicator go here : https:www.tradingview.com/script/ywEEvEtI-Volume-Trend-Meter/ Stay tuned and Follow as a combination indicator of the two indicators (VTM + PTM) will be coming up next: https:www.tradingview.com/u/dman103/#published-scripts Like if you like and Enjoy.Chỉ báo Pine Script®của dman103618
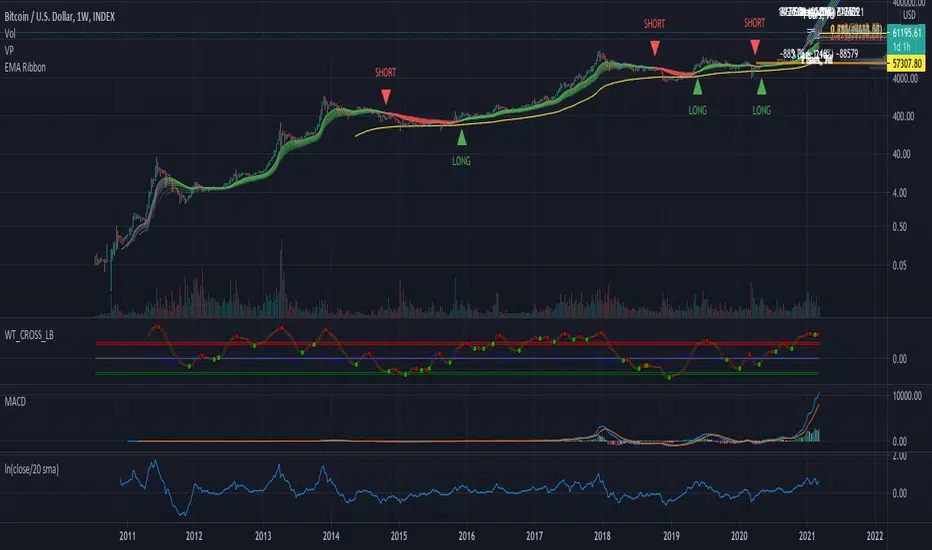
Price Extension - ln(close/20 sma)A simple script to visualize price extension. Useful to gauge tops/oversold areas. Most useful when used on weekly tf.Chỉ báo Pine Script®của axelex77
First Week Trend [MX]I created this indicator based on one of my ways of analyzing the BTC trend in particular, I noticed that the break of the first weekly candle usually indicates the trend for the rest of the month. This indicator has a bug in which if you change the timeframe of the indicator it will show erroneous values If you use the candlestick chart, you will need to pull the visual order of this indicator to the top to overlay the colors of the standard candles, or simply hide the standard candles the trend colors are bugged in timeframes other than the weekly special thanks to @xdecow who helped me with the code //////////////////////////////////////////////////////////////////////// Eu criei esse indicador baseado em uma das minhas formas de analisar a tendência do BTC em específico, eu notei que o rompimento do primeiro candle do semanal costuma indicar a tendência para o resto do mês. Esse script tem um bug em que se mudar o timeframe do indicador ele irá mostrar valores errados Se você usa o gráfico de candlesticks, você precisará puxar para o topo a ordem visual desse indicador para sobrepor as cores do candles padrões, ou simplesmente ocultar os candles padrões as cores da tendencia estão bugados em outros timeframes diferentes do semanal agradecimentos especiais ao @xdecow que me ajudou no código Chỉ báo Pine Script®của MarqxCập nhật 33145
Combo Backtest 123 Reversal & Modified Price-Volume Trend This is combo strategies for get a cumulative signal. First strategy This System was created from the Book "How I Tripled My Money In The Futures Market" by Ulf Jensen, Page 183. This is reverse type of strategies. The strategy buys at market, if close price is higher than the previous close during 2 days and the meaning of 9-days Stochastic Slow Oscillator is lower than 50. The strategy sells at market, if close price is lower than the previous close price during 2 days and the meaning of 9-days Stochastic Fast Oscillator is higher than 50. Second strategy The related article is copyrighted material from Stocks & Commodities. WARNING: - For purpose educate only - This script to change bars colors.Chiến lược Pine Script®của HPotter292
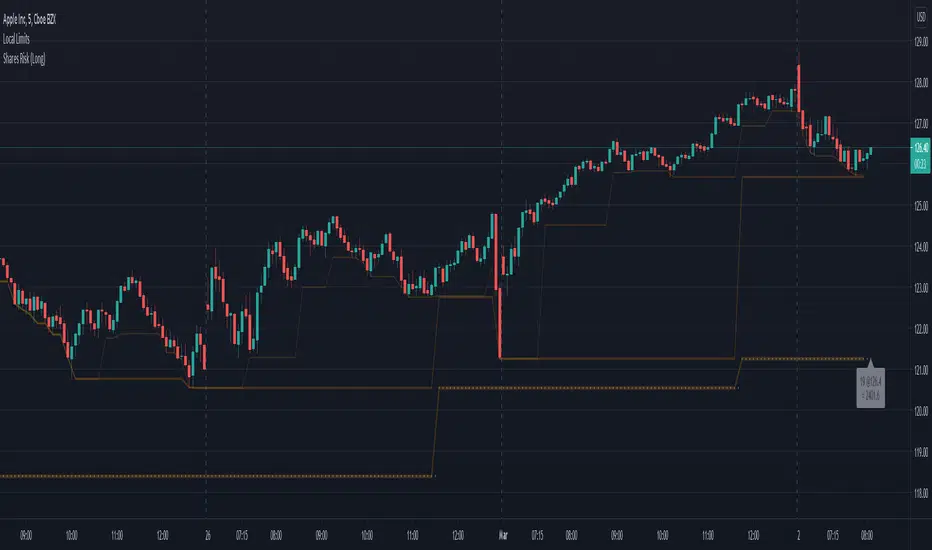
Shares Risk (Long)Ever struggle to know how many shares you should be placing your order with? Risk is different for every person and every stock. This can help. In the example above, I've added this indicator the the chart. I then specified: Risk Amount ($) = $500. (The max amount I'm willing to risk.) Risk Source = (another indicator) Lower Limit 3 . (See Lower Limits for more details) Source Risk (%) = 0.0 (The default is 5.0 expecting the Risk Source to be the close.**) Based upon how much I'm willing to risk, and the price difference between the close and Risk Source , this indicator will show the number of shares to purchase such that if the price drops to the stop level specified, my value loss should be limited to the Risk Amount . 333 shares is the value calculated for this example (latest bar). You can easily see how many shares you need to purchase for the lastest bar as well as track the previous values on the chart and the indicator cursor data. --- ** WARNING: There's no magic here. It's just math. So if you specify another indicator as the source, the values could get a bit strange and if the price is very close to the stop level, the number of shares could be unreasonably high. To help avoid this you can increase the minimum percent.Chỉ báo Pine Script®của ElectrifiedCập nhật 45
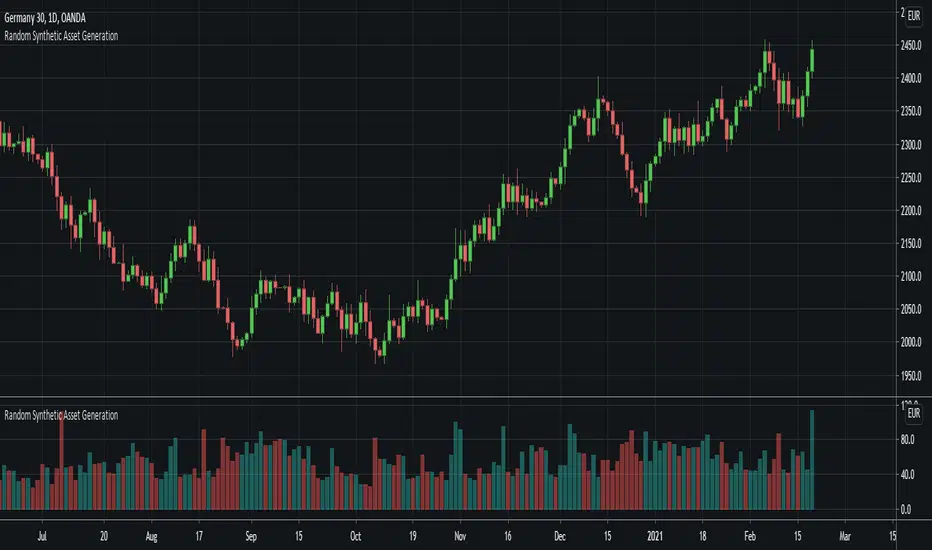
Random Synthetic Asset GenerationThis script generates pseudo-random asset data . Due to the nature of the random generator, it is impossible to use this indicator as input for other indicators because the instance of the script that the indicator is applied to will automatically be different from the instance that is plotted on the chart. Therefore, the idea is to use this script in other scripts (to make it possible to backtest on random data, for example). The script has four main input parameters. Random Number Generator Method: It supports two methods for generating the pseudo-random numbers (one by Ricardo Santos and one by Wichmann-Hill). Seed: You can specify the seed to use. Each unique seed will generate a unique set of pseudo-random data. Intrabar Volatility: This basically sets how volatile the generated wicks will be (0 = no wicks). Price Multiplier: This is just a multiplier for the generated price data, so that you can scale up or down the generated price data. You can also change the colors of the bars. In addition to this, the indicator also generates random volume. In order to make it possible to show both volume and price, you need to have two identical instances of the indicator. One on the chart, and one in its own panel. Then, go into the Style tab in the indicator settings on the instance in the panel. Untick Up-Candles and Down-Candles boxes, and tick the Volume box. In a similar manner, you can also plot the true range data and the candle change data as well, by ticking one of those boxes instead. Chỉ báo Pine Script®của lejmerCập nhật 1313255
Distance from the ATH priceThis indicator shows us the distance (in %) between the current price and the ATH price. The closer the price is to the ATH the higher the percentage. 100% means we reached the ATH price. HOW TO USE: No special input necessary. Markets: It can be used to all markets. NOTE: Some Exchanges don't go very far back in the past and for this reason this may have impact on this Indicator. Chỉ báo Pine Script®của Wilson-IVCập nhật 22202
Stock Value Display//This study is designed to plot estimates for a stock's value: //1) the Price to earnings ratio (PE) value based on the trailing twelve months of data //2) the PE value based future data //3) the Benjamin Graham value based trailing data //4) the Dividend Discount value based on trailing data You can adjust the period of data used to calculate the value between Fiscal Quarter "FQ" and Fiscal Year "FY." The values displayed on the chart are subject to the financial information provided to TradingView. This is intended to be used as a quick reference and should be viewed in context with other analysis prior to making any transaction decisions. As always, happy trading!Chỉ báo Pine Script®của MakeMoneyCoESTB202066382
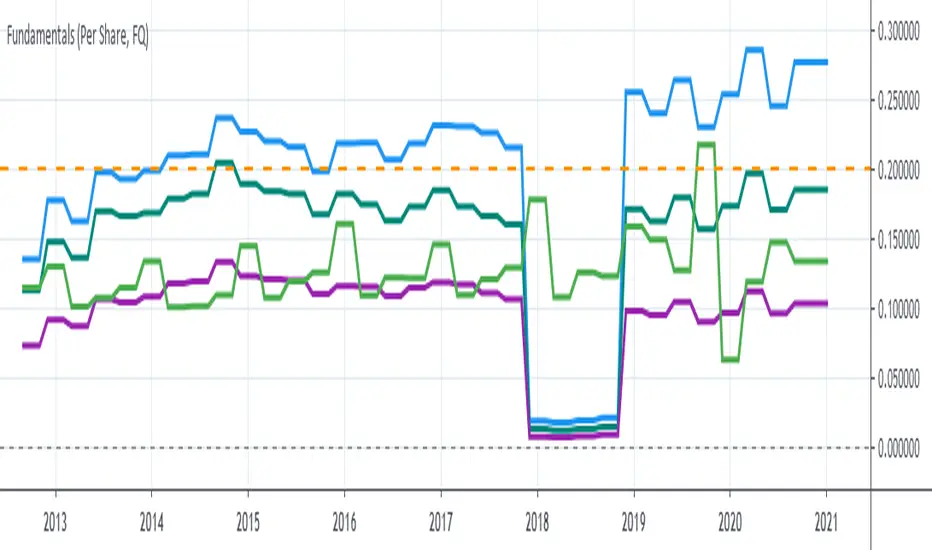
P1 FundamentalsP1 is because to me, this is a priority 1 indicator, so I have P1 and P2 indicators ordered on the favorite list. What can you check on the selection pane? On “period”, you can show the data related to: the fiscal quarters or the fiscal years. You can select a pack of financial data that I have organized in sections: Revenue & earnings EPS & DPS (EPS, EPS estimate, DPS and dividend payout ratio ) Debt (total debt, total equity and cash & equivalents) Returns (ROE, ROIC, ROA and R&D revenue to ratio) I recommend to just select one of them, in other case the chart is a mess. Any feedback on the code is welcome!!Chỉ báo Pine Script®của joapen11134
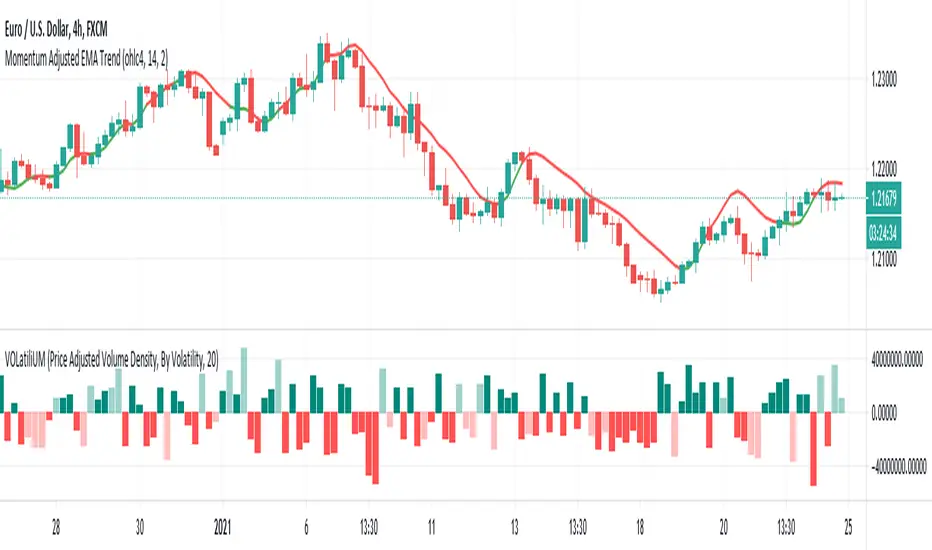
VOLatiliUMThis is a useful conjunction of volume and volatility together in one script, so I named it a blended name! It can show the diagram of: - Volume - Volume Variation (Volume - Past Volume) - Volume Density (Volume / (High - Low)) - Volatility in combination with the aforesaid ones It also offers two concepts of bar colorizing, by using the size of the bars or by applying volatility from a higher time frame (HTF). The option "Absolute Bar Values" is included for the ones who like to see all bars positive above the zero line! Feel free to use the script and send me your opinions. Thanks.Chỉ báo Pine Script®của informanerdCập nhật 88330
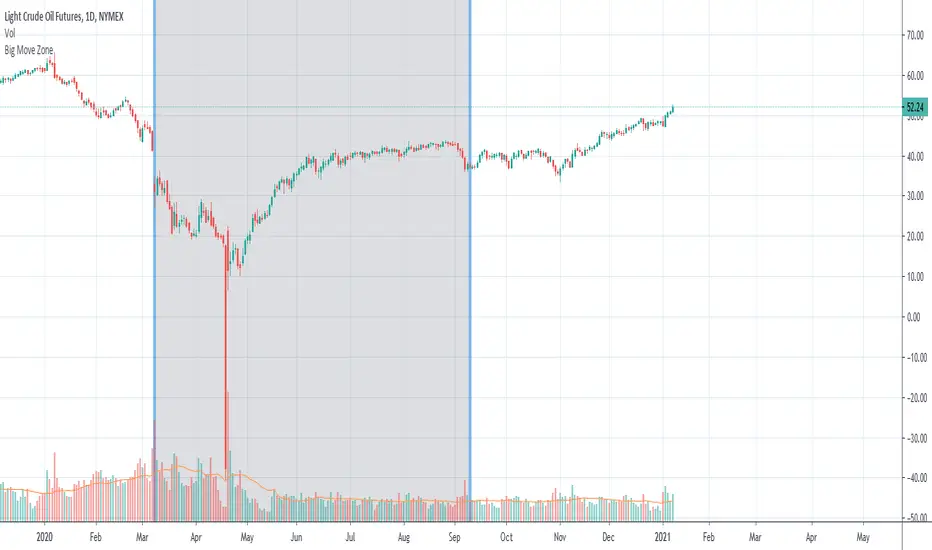
Big Move Finder Outlier ZoneA way to find if price made a big move in a user input given amount of time ago. If it made a move more than the given percent amount, a colored zone will be placed until a given amount of length finishes taking place, and then it will stop coloring the zone. This helps filter out or find stocks that are making or have made too big a price move or were too volatile in the past.Chỉ báo Pine Script®của SparkyFlary78
GBTC premium as a percentage of the bitcoin pricePlots the GBTC premium as a percentage of the bitcoin price at the close. It also includes the annual management fee (2% at the moment). It accrues on a daily, weekly or monthly basis depending on the chart resolution. (intraday not supported) The amount of bitcoin per gbtc share and the annual fee may be changed by Grayscale in the future. Those values can be easily update in the script settings.Chỉ báo Pine Script®của givanse26
Price PredictorGreetings Traders! I have decided to release a few scripts as open-source as I'm sure others can benefit from them and perhaps make them better.(Be sure to check my Profile for the other scripts as well: www.tradingview.com). This one is called Price Predictor. How To Use Price Predictor Price Predictor acquires potential targets by measuring the Average Change of Price from a user-defined resolution, from Open to Open. By default, the Resolution is set to 1 Day, however you can play around with Weekly, Monthly, etc. When a new resolution period begins, Price Predictor will automatically adjust based on the new Average Change of Price. Due to the avoidance of Security() in this script, you may have to play around with the Timeframe that you use it in to ensure that you have enough bars on your chart to process the User-Defined Resolution. The first Target Zone represents Target 5 of my other script, Trade Manager()(Given that you set the Target Multiple and Default Threshold Inputs as the same in each script), and is the most likely to be hit before the end of the resolution period. In addition to a User-Defined Resolution, you also have the option of using a Custom Price to define Target Zones, however I'd recommend using my other script, Trade Manager(), if the volatility of the Instrument isn't too high. I wanted to give a Special Thanks to @Pinecoders for the Custom RoundToTick Function from The Backtesting/Trading Engine --> ( If you like Price Predictor, be sure to Like, Follow, and if you have any questions, don't be afraid to drop a comment below.Chỉ báo Pine Script®của DrCatherineHalseyCập nhật 1212792
Trade ManagerGreetings Traders! I have decided to release a few scripts as open-source as I'm sure others can benefit from them and perhaps make them better.(Be sure to check my Profile for the other scripts as well: www.tradingview.com). This one is called Trade Manager. How To Use Trade Manager Trade Manager acquires potential targets by measuring the Average Change of Price from a user-defined resolution, from Open to Open. By default, the Resolution is set to 1 Day, however you can play around with Weekly, Monthly, etc. When a new resolution period begins, Trade Manager will automatically adjust its Targets based on the new Average Change of Price. Due to the avoidance of Security() in this script, you may have to play around with the Timeframe that you use it in to ensure that you have enough bars on your chart to process the User-Defined Resolution. The idea behind Trade Manager is quite simple yet can be quite powerful at the same time. Consider a Daily Candle for example. You can clearly see how a vast amount of price movement can be encapsulated within it, sometimes in both directions. By measuring the Average Change of Price per day(From Open to Open), we can use this Average to build targets off of. Defining a small Threshold above and below the Open Price of the Daily Candle allows you to set Limit Orders at these levels with predefined Targets. Then, the use of the custom Trailing Stop and Break Even helps to secure profits without giving too much back to the market, all while managing your risk. Within the Settings of Trade Manager, you have the option to alter the logic of whether Break-Even is set after the first Target or second Target is hit. In addition to using a User-Defined Resolution Period, you can also input a Custom Price into the settings of Trade Manager and allow the Targets, Trailing Stop, and Break Even to be calculated from the Custom Price. I wanted to give a Special Thanks to @PineCoders for the Custom RoundToTick Function from The Backtesting/Trading Engine --> () As a note, there are times where price will break out very strongly from the Limit Price, sometimes crossing the Stop and Limit Price on the same bar. When this happens, it is difficult for Pine to determine which occurred first intra-bar, and as a result, it does not record a new position. In these instances, I'd recommend adjusting the Default Stop Multiple so it is below the bar. If you like Trade Manager, be sure to Like, Follow, and if you have any questions, don't be afraid to drop a comment below.Chỉ báo Pine Script®của DrCatherineHalsey1313588
FAIR P/E BASED ON INTEREST RATESJust a different way to view S&P 500 valuations versus the standard look of looking at raw PE. Current yield of the 10 Year Bonds are used to calculate a fair value for the SPX. This is a methodology that Buffett uses to measure value. Recommend turning off most plots and just plotting PE and/or PE10 percent difference only. The "slope and intercept" inputs should be left alone unless you recalculate them with updated data. The "current PE and PE10" inputs can be found here: www.multpl.com This is a daily estimated value. The full calculated value is released once per month, and is what Quandl has. Change these numbers if you want today's updated values. Once you have the study set up the way you want, I recommend saving the defaults (bottom left corner in the settings screen).Chỉ báo Pine Script®của bigurb55231
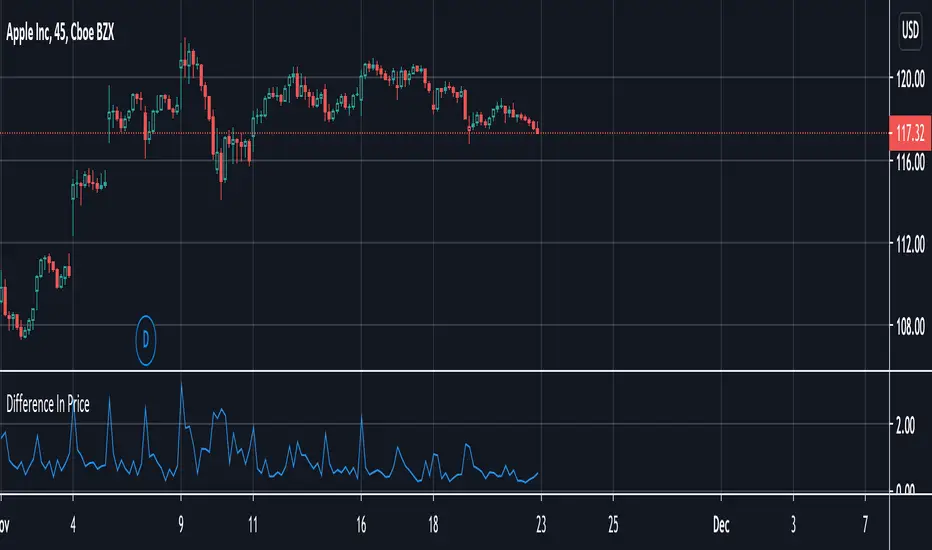
Difference In PriceWith the difference in price indicator, you can view price change volatility. Specifically, you can view the difference in price for a single candle segment, at any desired candlestick timeframe. This simply takes the sessions high minus the low and gives the difference. Difference in price trend lines help determine if a stock has a history of high volatility or not. This is useful for those looking to invest in stable stocks. Chỉ báo Pine Script®của Myantman1011136
Market EmotionsThis is a simple and fun indicator I built out of boredom one night. It's great for a quick laugh, but other than that, it's useless. It simply displays emotes for various thresholds of change in price between the open and close of a candle. For example, unicorn candles are any candles that gain 25% or more from opening price to closing price. Chỉ báo Pine Script®của tacosontitan1010419
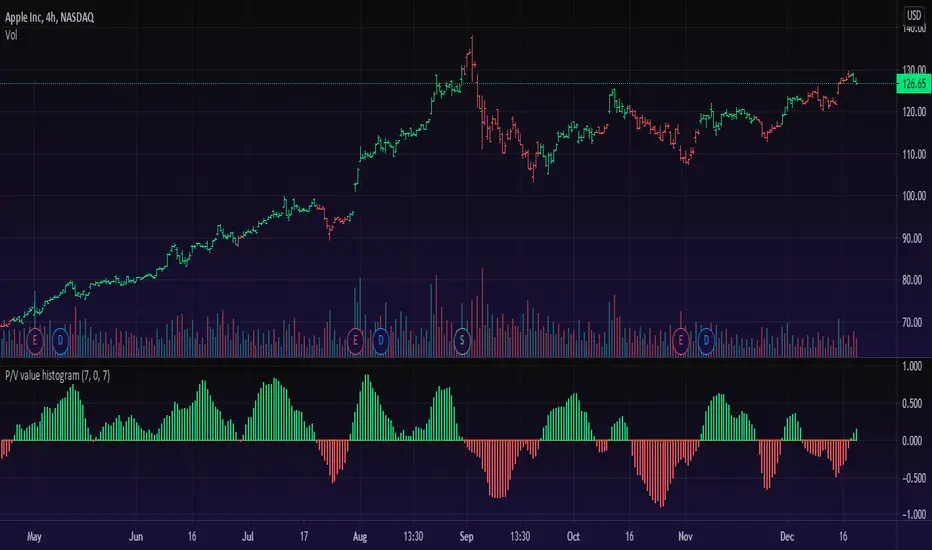
Price/Volume Value HistogramAn interesting implementation of mine to measure an asset changes based on asset price velocity and volume velocity. The indicator acts as asset value calculator. Long and Short. ==Points System Rules== UPTRENDING If Current Close is higher than previous Close and Current Volume is bigger than previous Volume: Adds Close Points and Volume Points Otherwise check If Current Close is higher than previous Close: Adds Only Close Points DOWNTRENDING If Current Close is lower than previous Close and Current Volume is bigger than previous Volume: Reduces Close Points and Volume Points Otherwise check If Current Close is lower than previous Close: Reduces Only Close Points ==Plotting== Result of the values are summed up to a histogram. Obviously on increasing prices and volume the histogram will be above zero line and on the Bullish side (green color), otherwise, on the Bearish side (red color). You can't cheat the price movement, it's just what it is. Optional to smooth it by EMA (set to true by default). Like if you Like and Enjoy! Follow for upcoming indicators.Chỉ báo Pine Script®của dman103Cập nhật 2323 1.7 K
Rise from All Time LowThis very simple script lets you see how much the asset rose from the All Time Low (ATL). First, the ATL is calculated and plotted. Then, we measure the distance from ATL and current bar close. Two labels are plotted : ATL label Current close label with rise and rise It can be useful for penny stocks trading when you want to buy lows but must see how much the price rose last bars to improve entries. For example, SQBG is actually "only" at x 1.85 from ATL (not an advice in investment) : If you have ideas to complete or improve this script, let me know in comments ;)Chỉ báo Pine Script®của UnknownUnicorn4889556Cập nhật 11157
Renko MTF - Traditional and ATRSomehow there aren't too many renko bars that have the traditional setting built-in so I put one up. This one has the option to choose between Traditional and ATR, the size number corresponds to the option that was chosen. And just in case if anyone wanted, I put up a multi-time frame option to choose the time frame the bars take place. D is for day, W is for week, flat numbers are in minutes, and leaving it blank looks at the current time frame the chart is in. The calculation comes from how Tradingview handles renko bars. Renko bars don't paint a color unless the market moves a certain amount based on its settings. When the market moves up it turns green, if it moves down it turns red, simple color changes alone can say a lot. They're a good way to try to find trends somewhat objectively and seem to be a good way to eliminate time and can replace other time-based indicators that can whipsaw or lag. The bars have a tendency to repeat themselves so it's a good way to find trends. There aren't too many settings for the box size, most people either just choose 5, 10, 14, etc where as other indicators have many options that differ on different markets. The numbers can be chosen easily enough to pick a sweet spot with just a single input where other indicators such as MACD have multiple inputs to pick the right number that can make it difficult to choose from(although it won't be as precise as a MACD would sometimes but can be worth the objectiveness and consistency and same setting repeatability in different markets in my opinion). Some example strategies could be to use them as an alternative trailing stop, finding trends, a simple color change for entry and exit on top of other strategies, etc. It can do the job of many in an all in one price action type indicator(although not better all the time, it can come close enough). Despite all this, it does seem to depend on which time-frame it's being looked at, how TV does the calculation for it, and how one can use this with the lack of practical information on it out there.Chỉ báo Pine Script®của SparkyFlaryCập nhật 1919264