ATR Bands with vortex indicator [LM]Hello traders,
I would like to present you ATR Bands with vortex indicator. This indicator is different than my others I used not that known vortex indicator as a entry indicator, and atr bands I have used as a exit indicator.
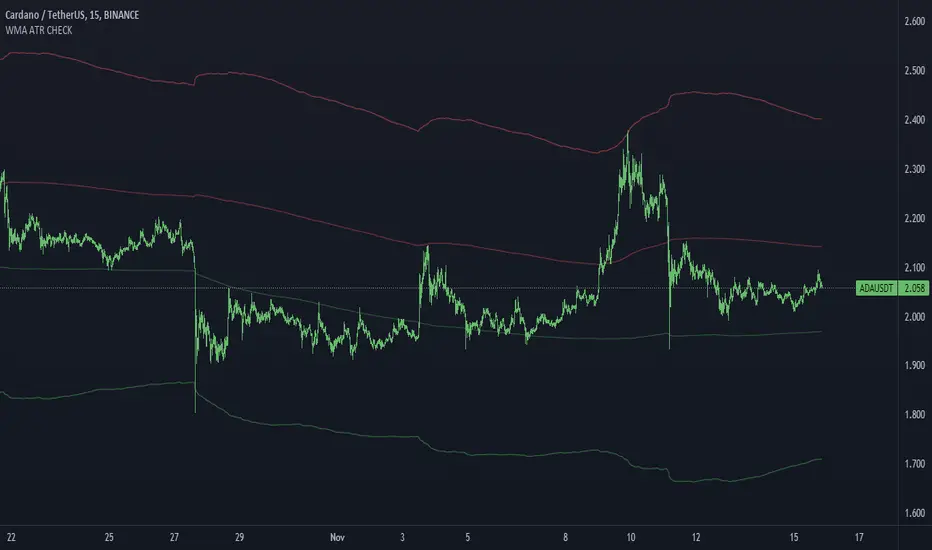
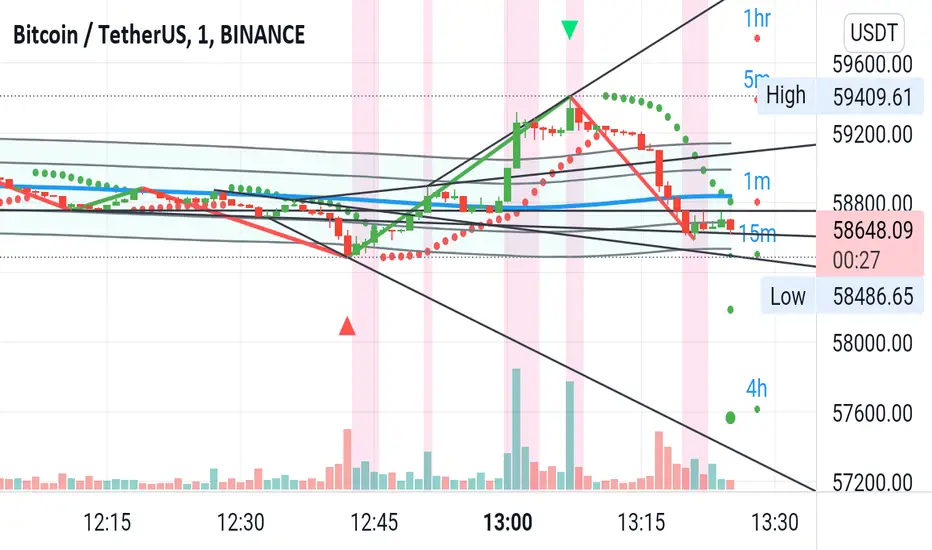
You can see 2 set of bands with different multiplicator, first is used as first target profit, stop loss and second as a second target
There are to modes that takes, first is static mode that gives you lines with 1st, 2nd target profit and in red color stop loss
In the static mode you can also turn off extending line he price reach the level:
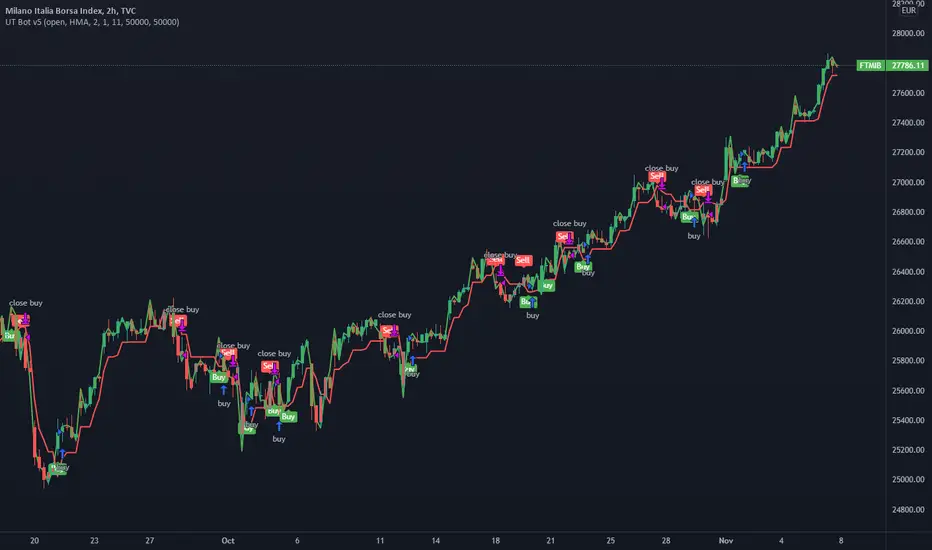
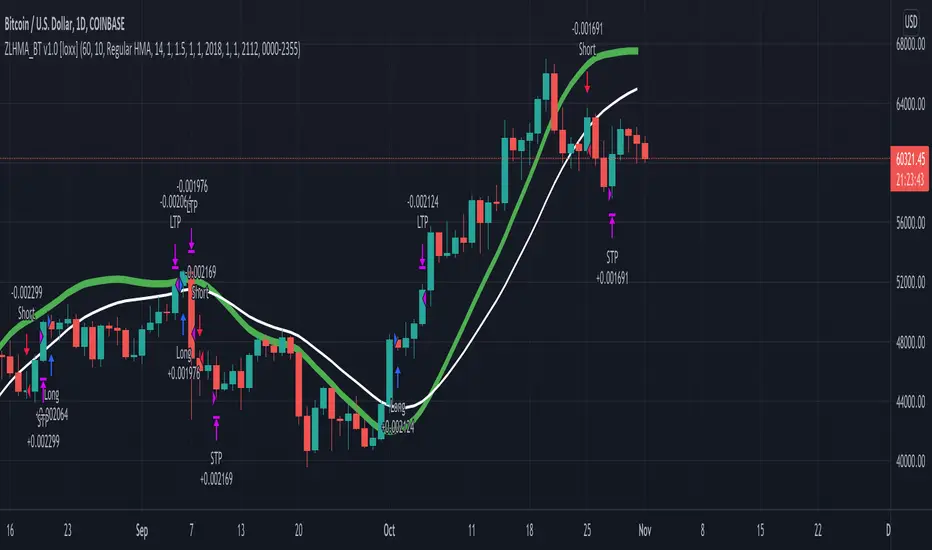
Second mode is tracking atr first band with candle offset of your choosing:
The trailing functionality is not working 100% but I as thinking to share it anyway and see maybe some feedback and meantime I will fix the trailing behavior.
Settings:
Genreal settings - basic setting of source for atr bands, line settings,
First atr bands setting
Second atr bands setting
Vortex setting
Cheers and Happy Xmas,
Lukas
Chỉ báo Pine Script®