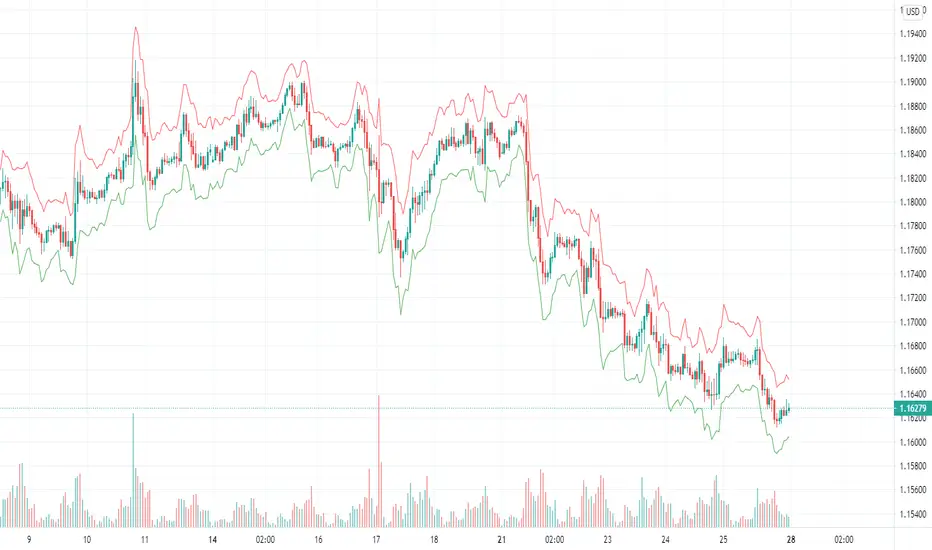
Position Size for ATR Trailing StopThis indicator will calculate your position size, short or long, based on the ATR Trailing Stop indicator of mine, and are needed to be used together. General risk management suggests risking just 1 percent of your equity and using low leverage.
ATR
TRBTrue Range Bands; the 'Supertrend', also known as a volatility stop, using a 14 period length and 3x multiplier.
Rojbin_Strategy_1D_[babelii]Rojbin Oscillator for cryptocurrency
Used :
1- ADX
2- CCI
3-MACDI
4-ATR
5-MA
ATR Bands [NeoButane]ATR bands, smoothed with exponential moving averages.
The difference between this and other ATR bands is that high and low are used as the source for top and bottom band, resulting in more accurate ATRs. It is also calculated in log-space to aid in making the bands more "springy" when it comes to extremely volatile assets or very low timeframes.
See here for an upgraded version:
Indicator SuperTrend AllIndicator SuperTrend All:
A composite of using values from individual SuperTrends
ATR Trailing Stop Bands [NeoButane]These ATR bands and trailing stops can be used as a way to manage risk, enter breakout trades, or as support/resistance.
Please see here for information about payment and access: medium.com
ATR Bands Features:
Shape plotted for closes out of bands
Custom resolution
Bands multiplier: useful for reducing size to increase signal
Band smoothing type: EMA, Hull MA, or no moving average smoothing
Calculated in geometric mean (log scaling) to resolve issues with flash dumps or pumps
Alerts for closing outside of bands
ATR Trailing Stop Features:
Based on daily resolution timeframe
Trailing stop multiplier: useful for curve-fitting to your instrument's normal trading range. Recommended multiplier between 1.5-3
Can be used as trading range (>3) or for breakout trading (<1.5)
Alerts for price touching stops
Hull MA +- ATR by shoxi Added HMA-ATR and HMA+ATR to make easier taking profits and placing stop losses in intraday trading.
RSI Swing Signal - ChartThis indicator is the chart version intended to accompany my custom RSI oscillator:
CLICK HERE TO SEE BASE INDICATOR
ATR Stretched Market [zauoyds]This indicator verify the close in comparison with EMA21. If the number is higher than 2ATR, the X is ploted above the candle.
Avoid positions when the candle is marked.
The best entries always will be close to the averages.
You can change the values through the inputs, according with your trade system.
ATR Short [zauoyds]This script was made to calculate in real time the stop and take profit based on ATR to SHORT positions. By default, the number is 1,5 ATR to stop-loss and 3 ATR to take profit. You can change according to your trading system.
ATR Long [zauoyds]This script was made to calculate in real time the stop and take profit based on ATR to LONG positions. By default, the number is 1,5 ATR to stop-loss and 3 ATR to take profit. You can change according to your trading system.
swissknife system all in oneSO how this system work
1. B and S top and button are stoch cross points
2.the area highlighted in blue and red are zone where RSI DMI and ATR are in agreement
3. The candles are based on fibonaci so if the candle are below 10 is low fib and if above 90 its high fib
so how to find best buy points
1. search for B points the fall in blue area =RSI low and D- high
2.sell points =s that fall in red area =high rsi + D+ high
3. the candle based on fib so it easy to see if the points potential buy and sell fall in high or low fib
4. potential buy and sell points can also be found on base of cross of D- and D+ adding adx make it easy
in this version no alert but in next version I try to put something on it :)
ATR PercentThe ATR Percent indicator is designed to help you discern market volatility increase and place trades based on the return to normalcy. Especially effective when trading Stocks.
EAP Helper IndicatorThis is a basic indicator I am developing to assist with testing and trading the new EAP pullback strategy. If you are not a member of the EAP program by Steven Hart, then this indicator will not be helpful to you.
Features:
S/L Calculator
This displays your stop loss values based on an entry from the currently selected candle.
The S/L is calculated by adding the S/L size in pips to the close of your entry candle + the distance to the swing high (or swing low for shorts). By default, the indicator only looks back 3 candles for highs and lows, but this can be changed in the settings.
If the ATR is <= 19, the S/L is 20 pips above/below swings.
If the ATR is >= 20 but <= 29, the S/L is 20 pips.
If the ATR is >= 30 but <= 49, the S/L is 30 pips.
If the ATR is >= 50 but <= 99, the S/L is 50 pips.
If the ATR is >= 100 the S/L is 100 pips.
-------------------------
I will add more features as I think of them :)
Volatility Direction DetectorThis script helps trader identify volatility direction in order to classify each market move. It also provides good entry points.
DepthHouse Relative Momentum Range Grid [RMRO]DepthHouse RMRO Grid is based on multiple time frame signals from the RMRO Oscilator.
I also brought back one of the oringial features from the previously version of RMRO which is the dynamic support and resistance levels.
The grid in the background represents the signals that the RMRO oscillator would give on up to 4 times frames.
The highest of which is the top.
Based on the colors above:
Green: Strong Bullish Movement
Blue: Bullish Movement with possible consolidation or reversal
Red: Strong Bearish Movement
Light Red: Bearish Movement with possible consolidation or reversal
White: In a decision zone.
The band between represents the price between dynamic support and resistance levels.
This setting is adjustable by the " Multi Factor " and will greatly alter the results of the band.
My preferred settings shown above are:
Source: hl2 // adjusts sounce for calcuations
Length: 13 // base calculation length
Signal: 13 // adjusts potential consolidation/reversal zones
Multi Factor: 350 // adjusts S/R levels for center band
Shifted-Breakout: 7 // adjusts the grid signal timing
TF1: 5
TF2: 15
TF3: 60
TF4: 120
How to get:
As of May 1st this will be available via subscription on my website. Until then just leave a comment!
If you would like a free trial , please visit my website, leave a comment on here, or feel free to send me a PM
RMRO TRC:
RMRO Oscillator:
Index Adaptive Keltner Channels [DW]This study is an experiment in adaptive filtering. The process in this study was inspired by KAMA and ZLEMA filtering techniques.
First, data is given an optional modification for lag reduction.
Then, an adaptive filter of your choice is calculated. There are 6 different adaptive filters to choose from in this study:
-Commodity Channel Index Adaptive Moving Average (CCIAMA)
-Relative Strength Index Adaptive Moving Average (RSIAMA)
-%R Adaptive Moving Average (%RAMA)
-Klinger Volume Oscillator Adaptive Moving Average (KVOAMA)
-Money Flow Index Adaptive Moving Average (MFIAMA)
-Correlation Coefficient Adaptive Moving Average (CCAMA)
Next, ATR is calculated using the specified adaptive filter.
A set of ranges is calculated by multiplying ATR by the square root of the sampling period, then dividing it by 2 and 4.
And Finally, the ranges are added to and subtracted from the adaptive filter to generate the channels.
Custom bar colors are included. The formula for the color scheme is based on filter direction and price.
TSLThis is a customized indicator that displays a trailing stop-loss directly on the chart:
The stop-loss is calculated using our Sublime Trading formula
The formula creates a stop-loss that is unique to each instrument traded
The stop-loss follows price as the trend develops
The stop-loss prevents the risk of being stopped out too early from pullbacks in a trend
The stop-loss helps remove subjectivity from exit management
Variability Channel Index (by vitelot)This is a momentum, trend, as well as a divergence indicator.
It is similar to CCI, though it is based on a slow and fast EMA in connection to ATR, which
allows to interprete it easily.
Both EMAs and ATR have customisable period.
Further explanation and basic usage can be found in the comment section inside the script.
%ATR - TCTAThe enhanced version of %ATR of "codermua"
The %ATR calculated by EMA(red) , SMA(purple) and WMA(yellow) added to existing indicator which include only RMA(blue) calculation.
Indicator SuperTrend AllIndicator SuperTrend All:
An indicator that is an aggregate of other SuperTrend Values (Buy/Sell)