Average
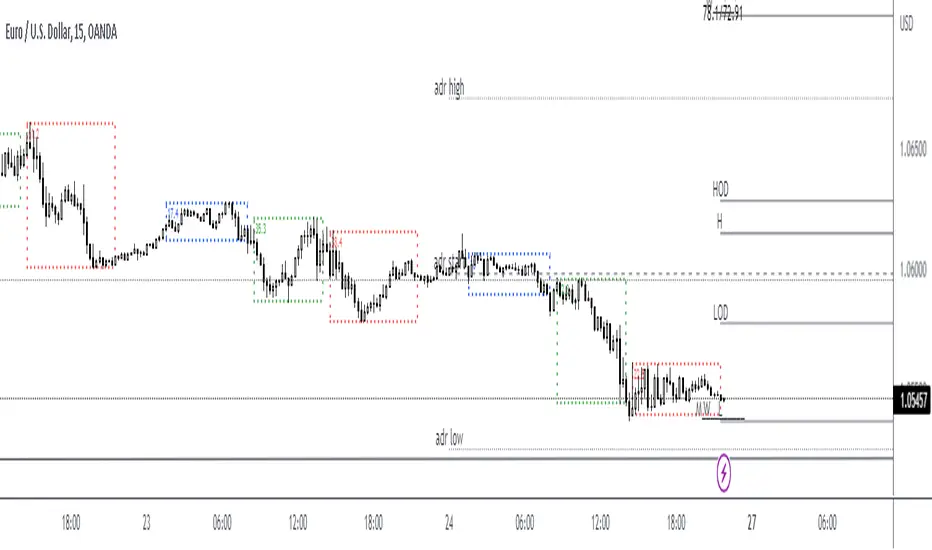
Average Daily Range Label by Theoris (ADR)This indy show Label of
* Last price
* Range of Low - High ( from Average daily range calculation )
* ADR (14 ) default period 14
* value of current range ( pip ) / Average daily range.
Example
now price is
1499.4
( 1486.959 - 1510.841 ) --- > This is range calculate from ADR for normal range.
ADR(14)
58/148.41
meaning use ADR period 14
today run 58 pips
from average 14 period is 148.41 pips
can change period to other normally I use 10 or 14
Timeframe to use default is Daily
Relative Volume (RVOL) - ATR - R4RocketHello !!
This is a big upgrade on my earlier Indicator called "RVOL - R4Rocket". I could have updated the existing script, but there were two reasons for me to not do so.
1. I changed a lot of the previous code and added a lot of statistics like
a. Intraday Daily ATR Plot
b. Progressive (High - Low) Range as % of Daily ATR
c. % of RVOL Days in available chart data in any timeframe
d. In the new script RVOL Sectional has been removed as I did't find it very useful (Old script still has that feature)
e. And lastly and greatly, I modified the actual RVOL code (Huh ? Well I'll explain what I mean by this below)
2. Earlier I named my script just as RVOL. But then I though, well not everyone is going to search "Relative Volume" Indicator as "RVOL" Indicator, right? And Then during my second update I even tried to see whether I can change the script name but I couldn't figure it out. (Maybe it's not possible or maybe you know, "I DON'T HAVE ENOUGH BRAIN POWER" :P). So in order to make my script more accessible and easy to find for everubody so that it may add a little value to them in their trading, I'm changing the name of the script in this publication to "Relative Volume (RVOL) - ATR - R4Rocket". (Quite a big name, don't you think?)
Now as my reasons are out of the way, let me tell you about the indicator and the available options.
First let me explain what is RVOL basically. (Even after making 4 updates to my last script, I forgot to explain this......BIG BRAIN POWER :P)
It is calculated as (Cumulative sum of volume till time t from the start of the session) divided by the (Average of same period volume over a given number of days).
Lets say market starts at 09:30 am and right now the time is 10:00 am. So what RVOL does is it takes the sum of volume done from 9:30 am to 10:00 am for today and divides it by the same average volume that occurred between 9:30 to 10:00 in lets say X number of last days.
What this does is gives you the means to quantify how much everybody is interested today in the given stock w.r.t last X days. Generally higher the RVOL value - higher the public interest (due to some known or unknown reason like results / news / market condition etc) - and hence higher is the probability of stock movement on intraday basis. (Mostly everybody prefers to trade stocks intraday with RVOL > 2)
Now let's get back to the changes and the features.
1. It calculates Relative Volume
Adjusted in a way that the recent volume spike (e.g say due to quarterly result announcement or some other big news) don't skew the next day's
RVOL calculation. What this will do is, it will give you a good idea whether the stock is still in play the next day or a day after that.
LIGHTS !! CAMERA !! ANNNNNNDD ACTION !! (I love to watch movies, not very relevant here I know, but couldn't help it :P)
Now you can see in the image below the difference between old and new script RVOL calculations. This will help you to find out 2nd Day, 3rd Day plays.
To calculate RVOL first you have to choose your local exchange trading hours
E.g. NSE (India) trades from 09:15 to 15:30
NASDAQ (USA) trades from 09:30 to 16:00
LSE (UK) trades from 08:00 to 16:30 etc
Then you have to choose the RVOL period. This is the lookback period for cumulative volume average calculations.(I suggest using default value of 4 but it depends upon your preference and one more thing to note is that too high of a value will not even load the script due to some constraints that I don't know)
And last parameter is RVOL Trigger = What RVOL value YOU CONSIDER IMPORTANT. (I like 2 and if RVOL > RVOL Trigger then the columns will turn Green otherwise they will be Red. SIMPLE !!)
You can use any timeframe from 1 min to 1 Day. (Even custom timeframes like 2,4,6 will work fine)
1 min Chart
2 min Chart
2. It calculates Daily ATR in % terms of the day's open and plots it on intraday charts (and on daily charts too, if you want)
It's just what I just said - plain & simple.
You can see it in the image below. (Yellow dotted line and value in yellow color)
This will help you if you use profit targets or stop losses based on previous day's ATR values.
All you have to do is tick the Plot Daily ATR % box in inputs and choose the ATR Average.
3. The indicator calculates (High - Low) range as and when it extends throughout the day as the % of Daily ATR
This will help you quickly in finding which stocks are trading with extreme volatility.
Can be seen in the image below where the stocks trade @ almost 3 times or 300 % of the previous days ATR (Blue dotted line and value in blue color)
4. And lastly it gives you the statistic that will tell you how much is the average % of total days are RVOL days. (Did you get that ? It sounded great in my head but really don't know what I just said)
Let me tell you in terms of numbers. Lets say on daily timeframe Tradingview provides some 5000 bars worth of historical data. Out of that there were 16% days where RVOL was more than 2. Roughly speaking if you were to trade this stock every day then you would find on an average about 3 days per month with RVOL > 2.
(If you reduce the RVOL Trigger, then you will get more % RVOL days. In the second image if you reduce RVOL Trigger to 1.5 then you will have almost 27 % good trading days AS PER YOUR DESIRED & DEFINED PARAMETER OF RVOL TRIGGER = 1.5. Which translates to almost 6 days per month. You can play with it as you want and deem fit.)
RVOL Trigger = 2
RVOL Trigger = 1.5
“The goal of a successful trader is to make the best trades. Money is secondary.” – Alexander Elder
With best regards.
R4Rocket


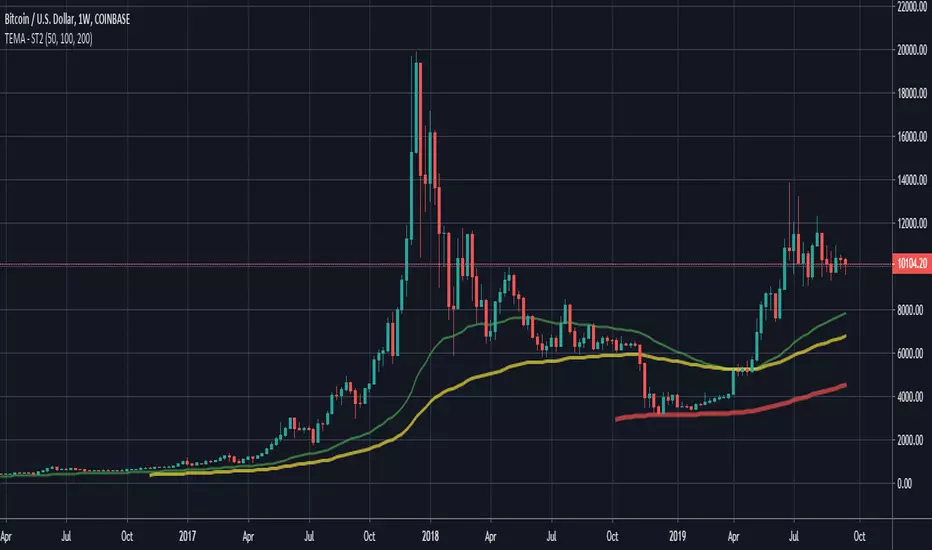
SMA 21/30/50/100/200 with Cross by DragonByteCombines several key simple moving averages into one slot without going overboard. Includes cross indicators between the 50/100 and the 50/200 day SMA's.

Multiple SMAs + X-Bar High/LowWhen starting my daily analysis, I typically open a daily chart and check where the price is compared to several SMAs, as well as check the high/low of today and the 10-day high/low. This indicator was designed to save chart space as well as make finding the highs and lows more efficient. Everything is adjustable, so you don't have to stick with my 10-bar rule.

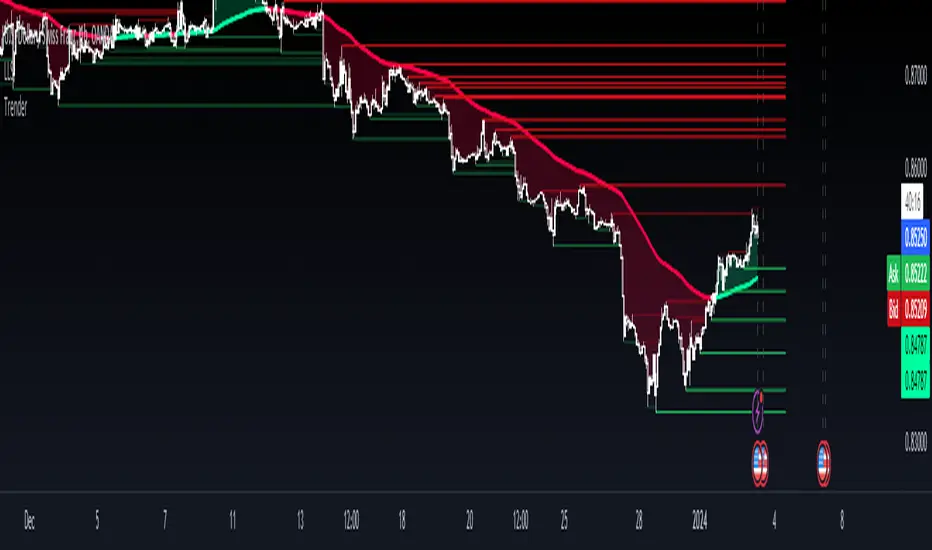
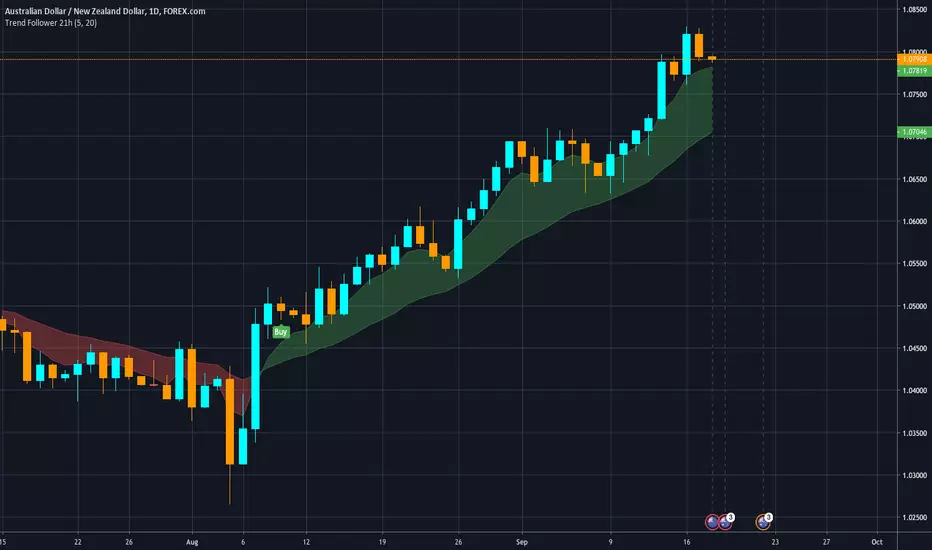
TrenderTrender is an indicator that compiles trend-following ideas in a complete friendly-custom indicator. Based on classic arithmetic moving averages, exponential moving averages, volume and a little bit of Fibonacci. Indicator built and usable in TradingView, focused only for easy visualization of the trend.
Scripting Tutorial 3 - Triple Many Moving AveragesThis script is for a triple moving average indicator where the user can select from different types of moving averages. It is meant as an educational script with well formatted styling, and references for specific functions.

Scripting Tutorial 2 - Triple Exponential Moving AveragesThis script is for a triple exponential moving average indicator. It is meant as an educational script with well formatted styling, and references for specific functions.
Scripting Tutorial 1 - Simple Moving AverageThis script is for a simple moving average indicator. It is meant as an educational script with well formatted styling, and references for specific functions.

Alpha-Decreasing Exponential Moving AverageThe alpha parameter of this moving average decreases with every new bar on the chart, so it will become more slowly and slowly in course of time. Can act like additional support/resistance line but works in an acceptable way on weekly and monthly timeframes only.

MMDVZ 1.0 - Moving Multi-Day VWAP ZonesVolatility adjusted moving multi-day VWAP zones
Directionality, trend and support/resistance levels at a glance
Useful for trading practically all kinds of stocks and futures.
Works well with many timeframes.
More updates to come, stay tuned

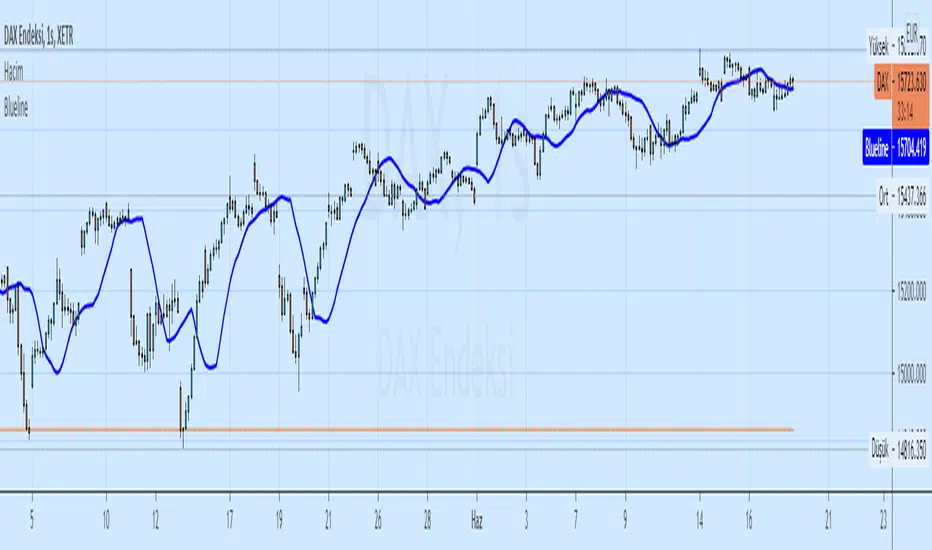
Trend Finder [Anan]Hello Friends,
This is so usefull MTF pane to know how powerfull the trend is (Bull/Bear)
It's so easy to use, just apply it on low time frame and ride the trend..


Smart Labelling - Candlestick ChartingThis is a full-fledged implementation of a system presented in an unique research paper 'Profitability of Candlestick Charting Patterns in the Stock Exchange of Thailand' (2017) on candlestick charting, candlestick patterns, trend identification methods, and testing.
You can easily find this paper in the Web. For example, visit: www.researchgate.net
This script is best suited for middle-to-higher time frames. Possible future developments: trend identification and factor calculation techniques.
Donate: PayPal (paypal.me)

TJD Parabolic SAR + Binary PivotsIdentifies support points, and pivots on the market, to place you in trending trades, and identify potential reversals.

Scott's historical ATR(volatility) percentileHistorical Volatility Percentile using Average True Range as measure of volatility.
Historical True Range Percentile


EMA 21,13,8 - scalping3 EMAs will help identify and predict uptrends and downtrends
-If EMAs are all above the candles it a sign to sell & if the EMAs are below its a sign to buy
- If the Green-8 EMA crosses or touches red candle then flips under the other EMAs & candles then it's time to sell
-If the Green-8 EMA crosses or touches green candle then flips above the other EMAs & candles then it's time to buy
- how far is the EMAs from the candle it'll show how strong the trend. combine this strategy with the stochastic oscillator & RSI to get the maximum benefit

Leeloo Quadruple (4x) Simple Moving AverageOne-stop shop for all of the simple moving averages because editing separately is annoying.
