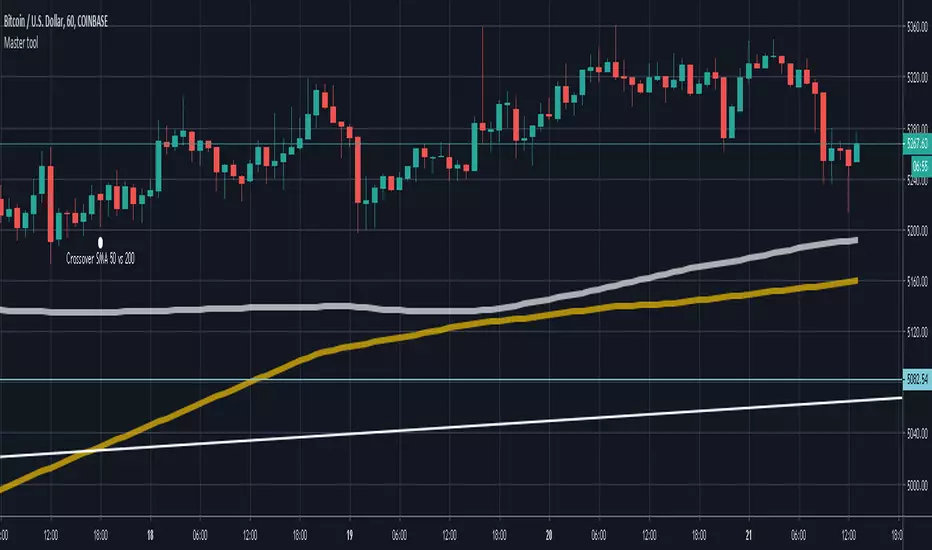
Multiple Moving AveragesThis script shows multiple moving averages and has an indicator when they are about to cross. Depending on the scale you probably will need to adjust the values to have a working cross indicator.
Crossover
Moving Average CrossoverIt was planned as an addition to Moving Average Smoothness Benchmark and Profitable Moving Average Crossover , but can be used standalone.
Supports 62 types of well-known moving averages and allows full-featured customization.
Supported types of averages and filters:
AEMA , Adaptive Exponential MA (by Vitali Apirine)
AHMA , Ahrens MA (by Richard D. Ahrens)
ALMA , Arnaud Legoux MA (by Arnaud Legoux and Dimitris Kouzis-Loukas)
ALF , Adaptive Laguerre Filter (by John F. Ehlers)
AMA , Adaptive MA (by Vitali Apirine)
ARSI , Adaptive RSI
BAMA , Bryant Adaptive MA (by Michael R. Bryant)
BF2 , Butterworth Filter with 2 poles
BF3 , Butterworth Filter with 3 poles
DEMA , Double Exponential MA (by Patrick G. Mulloy)
DWMA , Double Weighted (Linear) MA
EDCF , Ehlers Distance Coefficient Filter (by John F. Ehlers)
EDSMA , Ehlers Deviation-Scaled MA (by John F. Ehlers)
EHMA , Exponential Hull MA
EMA , Exponential MA
EVWMA , Elastic Volume Weighted MA (by Christian P. Fries)
FRAMA , Fractal Adaptive MA (by John F. Ehlers)
GF1 , Gaussian Filter with 1 pole
GF2 , Gaussian Filter with 2 poles
GF3 , Gaussian Filter with 3 poles
GF4 , Gaussian Filter with 4 poles
HFSMA , Hampel Filter on Simple Moving Average
HFEMA , Hampel Filter on Exponential Moving Average
HMA , Hull MA (by Alan Hull)
HWMA , Henderson Weighted MA (by Robert Henderson)
IDWMA , Inverse Distance Weighted MA
IIRF , Infinite Impulse Response Filter (by John F. Ehlers)
JAMA , Jurik Adaptive MA (by Mark Jurik)
JMA , Jurik MA (by Mark Jurik, )
KAMA , Kaufman Adaptive MA (by Perry J. Kaufman)
LF , Laguerre Filter (by John F. Ehlers)
LMA , Leo MA (by ProRealCode' user Leo)
LSMA , Least Squares MA (Moving Linear Regression)
MAMA (by John F. Ehlers)
FAMA , Following Adaptive MA (by John F. Ehlers)
MD , McGinley Dynamic (by John R. McGinley)
MHLMA , Middle-High-Low MA (by Vitali Apirine)
MNMA , McNicholl MA (by Dennis McNicholl)
NSMA , Moving Average 3.0 on SMA (by Manfred G. Dürschner)
NEMA , Moving Average 3.0 on EMA (by Manfred G. Dürschner)
NWMA , Moving Average 3.0 on WMA (by Manfred G. Dürschner)
NVWMA , Moving Average 3.0 on VWMA (by Manfred G. Dürschner)
PEMA , Pentuple Exponential MA (by Bruno Pio)
PWMA , Parabolic Weighted MA
QMA , Quick MA (by John McCormick)
QEMA , Quadruple Exponential MA (by Bruno Pio)
REMA , Regularized Exponential MA (by Chris Satchwell)
RMA , Running MA (by J. Welles Wilder)
RMF , Recursive Median Filter (by John F. Ehlers )
RMTA , Recursive Moving Trend Average (by Dennis Meyers)
SHMMA , Sharp Modified MA (by Joe Sharp)
SMA , Simple MA
SSF2 , Super Smoother Filter with 2 poles (by John F. Ehlers)
SSF3 , Super Smoother Filter with 3 poles (by John F. Ehlers)
SWMA , Sine Weighted MA
TEMA , Triple Exponential MA (by Patrick G. Mulloy)
TMA , Triangular MA (generalized by John F. Ehlers)
T3 , (by Tim Tillson)
VIDYA , Variable Index Dynamic Average (by Tushar S. Chande)
VWMA , Volume Weighted MA (by Buff P. Dormeier)
WMA , Weighted (Linear) MA
ZLEMA , Zero Lag Exponential MA (by John F. Ehlers and Ric Way)


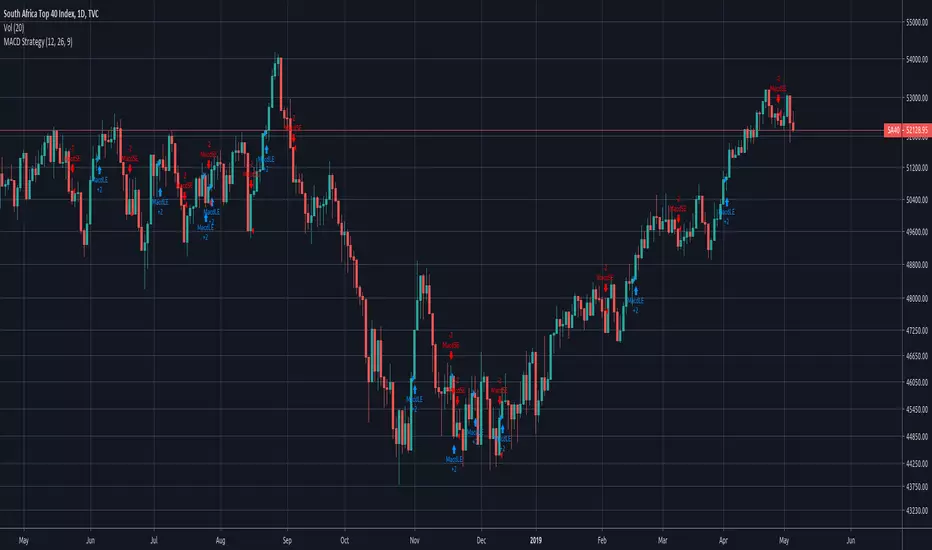
Simple MACD Strategy - CrossoverSimple MACD Crossover Strategy
No secret sauce here!
Script was requested by user
Simple Moving Average from Justin DartHi All,
This is my 1st script, what I want it to do is cut down on some of the SMA on my chart...
At the same time figure out , how to make a buy call that makes sense ( I Need work on it )...
I'm open to your input and your help...
Thanks...
Justin
EmaBreakOutA simple yet effective Indicator meant to give you buy and sell signals based on crossovers
Version 1.0
Sell order still needs some work and have ideas to add macd crossover etc

DW-3 EMA Signal LineWhen the EMA is Green the Near EMA is above the Far EMA
When the EMA is Red the EMA Far is above the EMA Near
The color changes when the EMA Near and EMA Far cross
The single line EMA is the EMA Signal line
The EMA Signal line can be set at any look back period.
Changing the EMA Signal will not change when the EMA Near and EMA Far cross, or when the color of the EMA Signal changes
Changing the Look Back Period of the EMA Signal will change how near or far it is from current price
You can change the look back period of any of the EMAs
What this does for you.....
This allows you to implement an EMA Cross while only displaying 1 EMA on the chart.
This means less clutter and allows you to adjust your "warning track" for exit rules.
In other words your EMA for your exit rule does not have to be one of the EMAs crossing.
You can tighten your exit rule EMA closer or give it more room without effecting the cross parameter.
Notice that in these images the point at which the EMA changes color (the crossover) does not change
but the proximity to current price of the EMA Signal line does.
//@version=3
study("DW-3 EMA Signal Line",overlay=true)
//SMAs
// Open Source
//======================================================
EMA_Near = input(defval=8, type=integer)
EMA_Signal = input(defval=14, type=integer)
EMA_Far = input(defval=21, type=integer)
EMAblue = sma(close,EMA_Near)
EMAred = sma(close,EMA_Far)
//color = SMAblue > SMAred ? #6DBEE5 : red
color = EMAblue > EMAred ? lime : red
plot(ema(close,EMA_Signal),color=color,linewidth=4)

RPS Moving Average CrossThis indicator is a powerful SMA and EMA Cross tool, that gives the trader better perception on the trend and gives potential BUY (UP arrow) and SELL (DOWN arrow) signals.
Highly configurable and gives deep customization, valuing individual preferences.
How to trade using this tool:
Buy @ Bullish 5 X 8 and Sell @ Bearish 5 X 8 (Suitable for Intra-Day Traders)
Buy @ Bullish 10 X 21 and Sell @ Bearish 10 X 21 (Suitable for Day Traders)
Buy @ Bullish 21 X 50 and Sell @ Bearish 21 X 50 (Suitable for Swing Traders)
Buy @ Bullish 50 X 200 and Sell @ Bearish 50 X 200 (Suitable for Investors)
Hit Like, if you find any value in this tool.
Share your trading experience using this tool in the comments section.
Thank you!
~RPS~

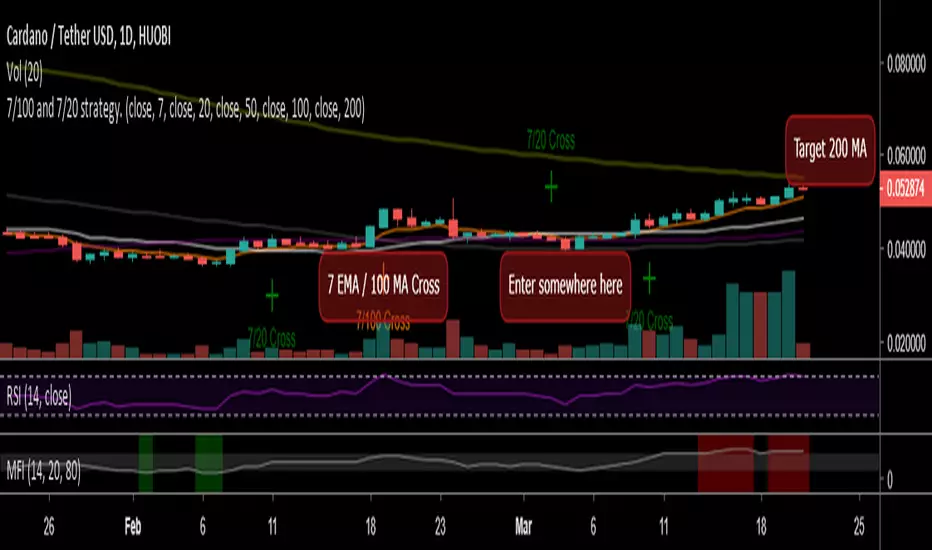
7/100 and 7/20 strategyBased on TradingRoomApp 100/7 Crossover Strategy.
Strategy (Daily TF):
🔹Wait for 7 EMA to cross over 100 MA.
🔹Wait for 2 confirmation candles above.
🔹Enter on pullback near 20 MA.
🔹Target 200 MA / 70.6% Fib from highest high to lowest low.
🔹Average returns 50-150% in 4-8 weeks for good volume ALTs.
This is a seasonal strategy which is relevant for trading between October 2018 and next few months.
**** 4 Alerts in One! ****
For all crossovers and crossunders you will get an alarm with just one alert set.
Instructions to set an alert:
- Right click in the chart and choose 'Add alert...' or ALT + A.
- Choose '7/100 and 7/20 strategy' in 'Condition' dropdown menu'
- In second dropdown 'fastEMA' is selected automatically, you can leave it as it is
- In third dropdown '7/100 and 7/20 strategy' is already selected also and you can leave it as it is
- After that choose your other options and save the Alert.
TEMA CrossoverTEMA is the Best Moving Average in terms of lag reduction.
Use this indicator to gauge the direction of the trend with the lowest lag possible.
TEMA CrossoverTEMA is the Best Moving Average in terms of lag reduction.
Use this indicator to gauge the direction of the trend with minimum amount of lag.

Dual EMA/SMA + Cross [SH]
I was missing an indicator that could show both an EMA and an MA with selectable source (open, close etc.) at the same time.
- Individually selectable EMA or MA.
- Option to highlight the bar where the MA's cross.
- Individually selectable source.
Not being pro it makes sense to have several indicators in one.
I hope someone finds this indicator useful.
Shaslund

The 6 Line Death PunchIf you are looking to discover what trend you are in, you need to first what direction the price is going in...
I've been using and testing a mixture of EMA's and SMA's for a long time and I've found that these ones are by far the best.
EMA 3
EMA 8
MA 20
EMA 55
MA 100
MA 200
EMA 3 & 8 Crossover is a good method for confirming a coin going to the upside or to the downside.
EMA 8 is known as the Trigger Line (trademarked brand) as one of the fib numbers it shows good support or resistance of a trend.
MA 20 universal way of seeing trend direction in the stock market, works well with crypto too.
EMA 55, another trusty fib number. Works very well and could trade off that alone as support and resistance.
MA 100 and MA 200. Long ranged moving averages which govern the overall longer-term trend.
LONG ENTRY
Option 1 - 3/8 crossover
Option 2 - Candles above EMA 8
Option 3 - Candles above MA 20
Option 4 - Candles Above EMA 55.
SHORT ENTRY
Option 1 - 3/8 crossover
Option 2 - Candles below EMA 8
Option 3 - Candles below MA 20
Option 4 - Candles below EMA 55.

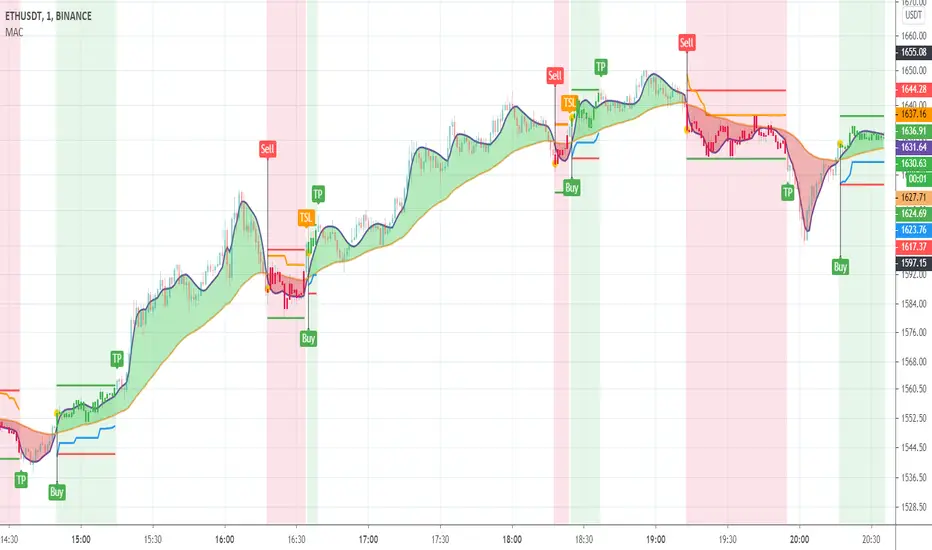
Jurik JMA/DWMA MACDHello friends,
Meet the Jurik JMA/DWMA MACD — an oscillator version of the crossover system originally recommended by Mark Jurik. It combines the Jurik Moving Average (JMA) and the Double Weighted Moving Average (DWMA) to form a smooth yet highly responsive convergence/divergence signal.
🛠 How It Works
Unlike standard EMA-based MACDs, this version uses Jurik's advanced non-lagging smoothing method to eliminate noise without sacrificing responsiveness , resulting in exceptionally clear and timely momentum readings.
I use the best original JMA clone available on TradingView — its behavior closely matches the genuine Jurik algorithm.
As Mark Jurik stated:
“Of all the different combinations of moving average filters to use for a MACD oscillator, we prefer using the JMA–DWMA combination.”
This oscillator measures the distance between JMA and DWMA, revealing when short-term momentum diverges from the longer-term trend. The result is a non-lagging MACD-style signal that highlights shifts in trend strength, early reversals, and exhaustion zones — all with Jurik-level smoothness and precision.
🔥 Key Features
Non-lagging, noise-reduced oscillator response
Peak highlighting
Built-in alerts for bullish and bearish peaks
If you'd like access or have any questions, feel free to reach out to me directly via DM.
👋 Good luck and happy trading!
Tập lệnh trả phí

Jurik JMA/DWMA CrossoverThis is a crossover system that was recommended by Mark Jurik. The system consists of Jurik Moving Average (JMA) and Double Weighted Moving Average (DWMA). In case of Jurik Moving Average I use the best original JMA' clone on TradingView that has the almost identical behaviour as the original one.
As Mr. Jurik noticed:
" JMA is ideal for the fast moving average line because it is quick to respond to reversals, is smooth and can be set to have no overshoot. DWMA (double weighted moving average) is ideal for the slower line as is tends to delay reversing direction until JMA crosses it."
Reference: www.jurikres.com

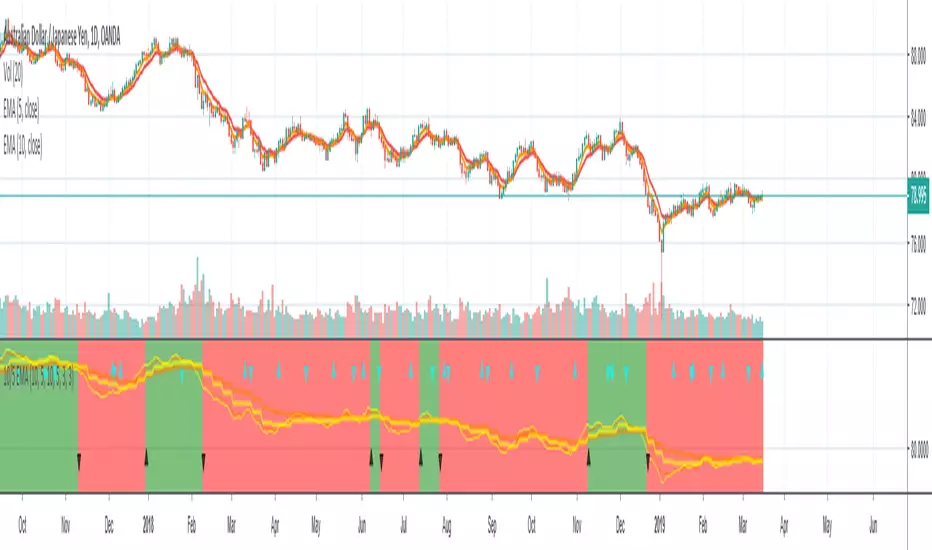
10/5 Weekly/Daily EMAs with ConfirmationsPlots Daily and Weekly 10 & 5 EMAs (but fully customizable to your own).
In addition to plotting the EMAs it color coordinates trend bias and has cross confirmation signals.
Philosophy and how to read:
I use this indicator when trading strictly on the daily timeframe. I have not tested it on other timeframes.
In my trade system I start with both the monthly and weekly charts to define overall bias.
Here’s the general rule of thumb.
10 EMA is direction (bias) and 5 EMA is price.
If 5EMA is below 10EMA there is a bear bias. If 5EMA is above 10EMA there is a bull bias.
This indicator will plot both the daily and weekly 10 & 5 EMAs.
It will also color code the background based on how these EMAs relate to each other.
Light red typically is just the daily is confirmed bear (typically because it could be either or)
Dark red, both daily and weekly in confirmed bear.
Light green, typically just daily is confirmed bull (typically because it could be either or)
Dark green, both daily and weekly in confirmed bull.
In addition to background highlight there is confirmation crosses.
The daily confirmation cross is default yellow triangle.
Down triangle is 5 crossing the 10 downward.
Up triangle is the 5 crossing the 10 upward.
The weekly confirmation is the same only is aqua color.
Generally, on a color change you want to see one or both confirmation in the direction of the bias change.
If you only want to plot the daily bias in the options unclick the setting: Include Weekly Background Plotting. Unclicking this will remove the background coloring for the weekly bias. This might be helpful if you only want to see the strength of what the weekly timeframe is telling you.
Also, I’m primarily a trend trader but I also do have a reversal system I trade with lower R:R parameters.
A good reversal confirmation signal I’ve noticed is the instrument that you are trading should go through a cycle of light color to dark color.
You could also create alerts with this indicator based on just signals. When the signal fires the value will be 1.
Future Updates:
I want to find some way to correlate the distance between these EMAs to enhance the signal. Also to include a velocity component. Plus a few more things.
If you like this indicator please like and leave a comment down below.
Decent Martingale Strategy [Pinescript v3]In my experimentation to add some sort of hedging to trades, I stumbled on the Martingale roulette betting strategy.
If it works in the casino, why not here?
The principle is simple:
If you lose a trade, immediately go the opposite direction and double your bet.
In this case, we're just applying a multiplier.
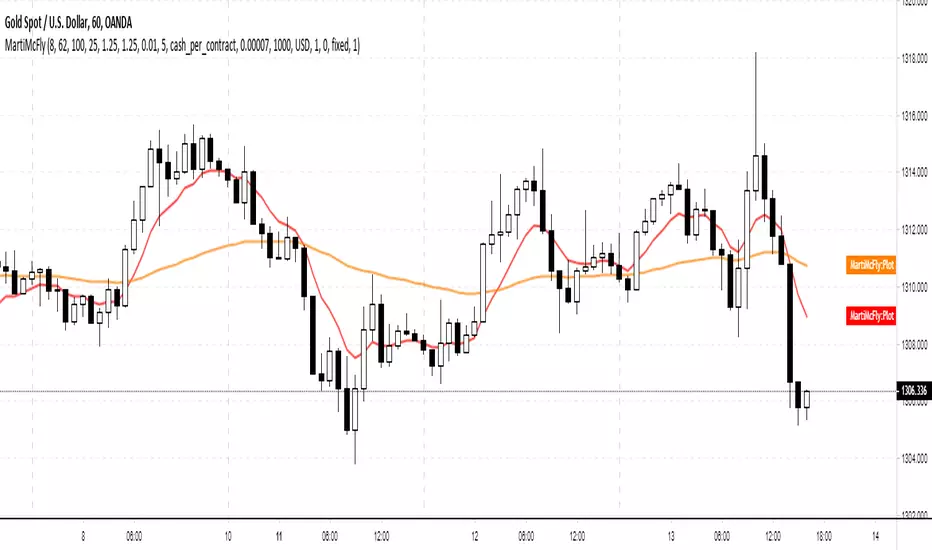
The strategy is a simple EMA crossover - defaulted to my favorite periods 8 and 62.
Enjoy :) I'll make a new one that's contained in a function, so you can simply implement it in your own strategy and have it monitor winning/losing trades automatically.
Cheers,
DasanC
CryptoMatt GainMaker for ChartBulls StudentsThis script is intended for the ChartBulls Trading Students. The code is now open, so you can customize however you like. Cheers

Bitazu MA 5,10Displays 5,10 MAs on a single indicator.
Useful for Crypto trading and reduced the number of indicators needed to view multiple EMAs
When shorter MA crosses over the longer it's a good sign of Bullish/Bearish reversal.
This sentiment is more true at longer timeframes, such as daily candles, as the trend has more momentum.

Bitazu MA 10,20Displays 10, 20 MAs on a single indicator.
Useful for Crypto trading and reduced the number of indicators needed to view multiple MAs
When shorter MA crosses over the longer it's a good sign of Bullish/Bearish reversal.
This sentiment is more true at longer timeframes, such as daily candles, as the trend has more momentum.

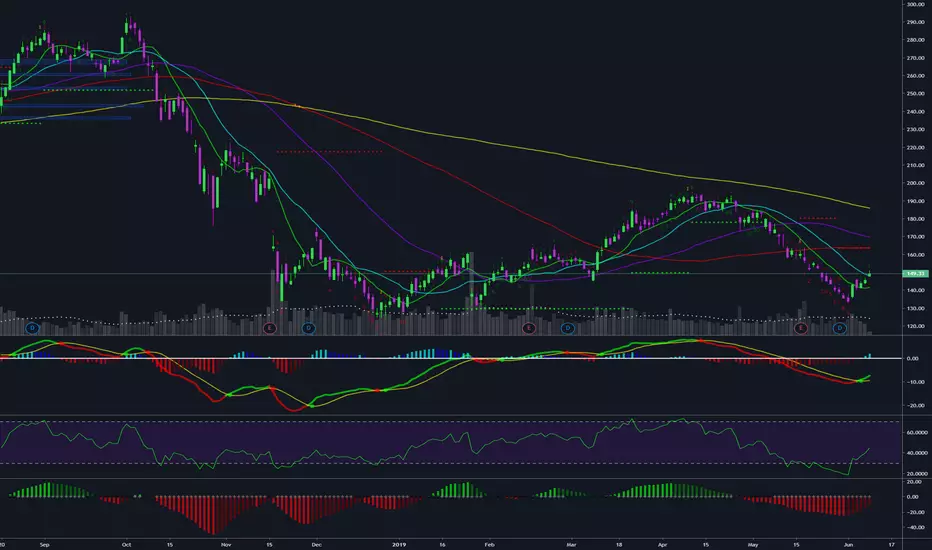
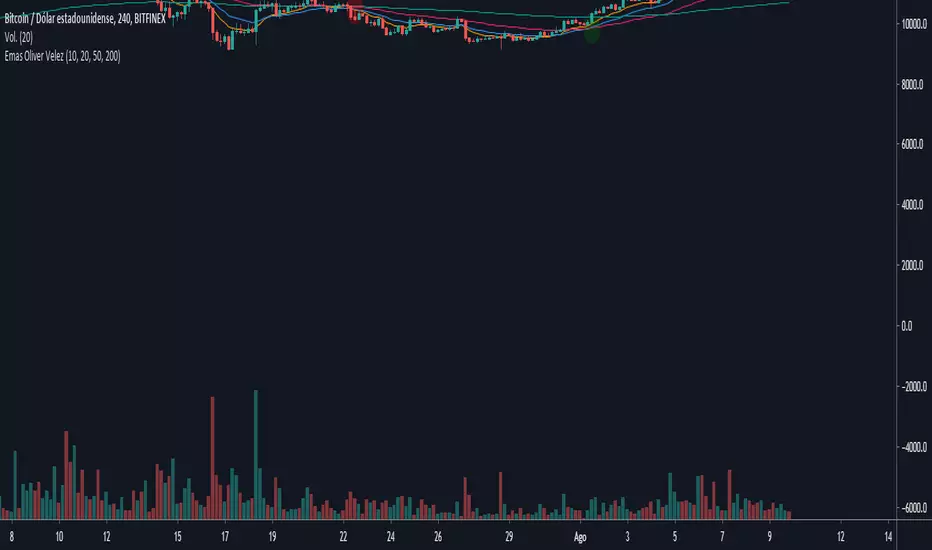
GVT pump detectoruse this to get in on gvt pumps (1h charts).
3 indicators to look for:
1) the price has closed the 1h chart above the orange 200ma line.
2) the fast blue ema 7 has crossed over the 200ma
3) the price action is above the white mid cap line and in the faint green zone).
how to use:
1) buy when the indicator along the bottom turns green
2) sell when the price goes outside of the top white band (or at latest when it comes and closes back inside) - EW/fib will guide this.
3) set SL at mid band
4) do not enter trade if red along the bottom or if green but the previous steps have passed.
