Unbounded RS from RSITransforms classic RSI into an unbounded oscillator using a logit transform, reducing 0–100 saturation and making momentum shifts and divergences near overbought/oversold levels much clearer.
Chu kỳ

Pi Cycle BTC Top + Pre-Alert BandsPi Cycle BTC Top + Pre-Alert Bands is an advanced implementation of the classic Pi Cycle Top model, designed for Bitcoin cycle analysis on higher timeframes (especially 1D BTCUSD/BTCUSD·INDEX).
The original Pi Cycle Top uses two moving averages:
• 111-day SMA (short MA)
• 350-day SMA ×2 (long MA)
A Pi Top is signaled when the 111 SMA crosses above the 350×2 SMA. Historically, this has occurred near major BTC cycle highs.
This script extends that idea with a 3-step early-warning sequence:
• Pi Green – early compression: short/long MA ratio crosses upward into the green band (convergence from below is required).
• Pi Yellow – mid-cycle warning: only fires if a valid Green has already occurred in the same cycle.
• Pi Cycle Top – final top: the classic Pi Cycle cross, limited to one top signal per cycle. After a top, no new Yellow or Top signals can appear until a new Green event starts the next cycle.
Background shading shows the active phase (Green / Yellow / late-cycle zone), so you can see at a glance where BTC is within its Pi-based macro structure.
All logic is non-repainting: request.security() uses lookahead_off and no future data is accessed.
Typical use
This indicator is intended as a macro-cycle timing and risk-awareness tool, not a stand-alone entry system. Many traders use it to:
• Watch for Pi Green as the start of a potential late-cycle advance.
• Treat Pi Yellow as a rising-risk environment and tighten risk management.
• Use the Pi Cycle Top as a historical high-risk zone where large profit-taking or hedging may be considered.
Always combine this with your own analysis (trend, volume, on-chain, macro) before making decisions.
How to set alerts
Add the indicator to your chart (1D BTCUSD or BTCUSD·INDEX recommended).
Click Alerts → Condition → Pi Cycle BTC Top + Pre-Alert Bands.
Choose one of:
• Pi Cycle – Green Pre-Alert (early convergence)
• Pi Cycle – Yellow Pre-Alert (after Green only)
• Pi Cycle – TOP (Single per Cycle, after Green)
Use “Once per bar close” for higher-timeframe reliability.
Disclaimer
This tool is for educational and analytical purposes only. The Pi Cycle concept is based on historical behavior and does not guarantee future results. This is not financial advice; always do your own research and manage risk appropriately.

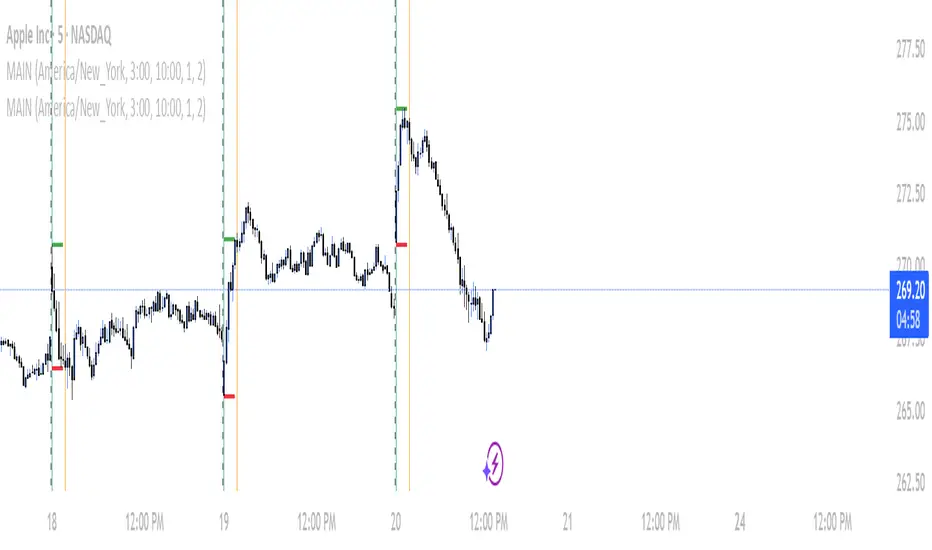
Institutional Volume Flow (IVF) with VWAP & Zones. Accumulation Zone (Green Background)Logic: Signals potential institutional buying at the low.Conditions: The current close price is below VWAP $\text{(close} < \text{VWAP)}$, AND there has been at least one Aggressive Buy (IVF) bar within the last $\text{N}$ bars.2. Manipulation Zone (Red Background)Logic: Signals a Stop Hunt or False Breakout where the market briefly takes out a previous extreme before reversing with institutional conviction.Conditions:False Break High: Current high is a new 2-bar high, immediately followed by an Aggressive Sell (IVF) bar.False Break Low: Current low is a new 2-bar low, immediately followed by an Aggressive Buy (IVF) bar.3. Compression Zone (Purple Background)Logic: Signals a period of low volatility where price is "coiling up" for a large move.Conditions: The bar's range $\text{(high} - \text{low)}$ is consistently small (less than a multiplier of the Average True Range (ATR)) for a specific number of bars.The zones are plotted using bgcolor() for a visual area on the chart and plotshape() to mark the specific bar where the condition is met. Manipulation is given the highest plotting priority to ensure it's visible over other zones if conditions overlap.Would you like me to elaborate on the typical trading strategy associated with any of these three zones (Accumulation, Manipulation, or Compression)?

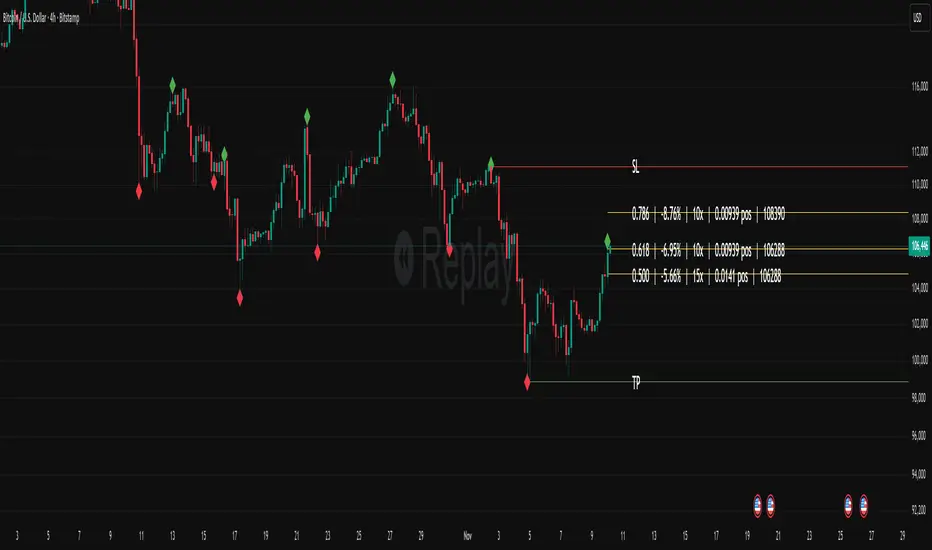
Fibonacci Set-upThe indicator plots Fibonacci retracements based on recent lows and highs.
Additionally it calculates position size, max leverage, max drawdown and pricelevels.
Breakouts & Pullbacks [Trendoscope®]🎲 Breakouts & Pullbacks - All-Time High Breakout Analyzer
Probability-Based Post-Breakout Behavior Statistics | Real-Time Pullback & Runup Tracker
A professional-grade Pine Script v6 indicator designed specifically for analyzing the historical and real-time behavior of price after strong All-Time High (ATH) breakouts. It automatically detects significant ATH breakouts (with configurable minimum gap), measures the depth and duration of pullbacks, the speed of recovery, and the subsequent run-up strength — then turns all this data into easy-to-read statistical probabilities and percentile ranks.
Perfect for swing traders, breakout traders, and anyone who wants objective, data-driven insight into questions like:
“How deep do pullbacks usually get after a strong ATH breakout?”
“How many bars does it typically take to recover the breakout level?”
“What is the median run-up after recovery?”
“Where is the current pullback or run-up relative to historical ones?”
🎲 Core Concept & Methodology
Indicator is more suitable for indices or index ETFs that generally trade in all-time highs however subjected to regular pullbacks, recovery and runups.
For every qualified ATH breakout, the script identifies 4 distinct phases:
Breakout Point – The exact bar where price closes above the previous ATH after at least Minimum Gap bars.
Pullback Phase – From breakout candle high → lowest low before price recovers back above the breakout level.
Recovery Phase – From the pullback low → the bar where price first trades back above the original breakout price.
Post-Recovery Run-up Phase – From the recovery point → current price (or highest high achieved so far).
Each completed cycle is stored permanently and used to build a growing statistical database unique to the loaded chart and timeframe.
🎲 Visual Elements
Yellow polyline triangle connecting Previous ATH / Pullback point(start), New ATH Breakout point (end), Recovery point (lowest pullback price), and extends to recent ATH price.
Small green label at the pullback low showing detailed tooltip on hover with all measured values
Clean, color-coded statistics table in the top-right corner (visible only on the last bar)
Powerful Statistics Table – The Heart of the Indicator
The table constantly compares the current situation against all past qualified breakouts and shows details about pullbacks, and runups that help us calculate the probability of next pullback, recovery or runup.
🎲 Settings & Inputs
Minimum Gap
The minimum number of bars that must pass between breaking a new ATH and the previous one.
Higher values = stricter filter → only the strongest, cleanest breakouts are counted.
Lower values = more data points (useful on lower timeframes or very trending instruments).
Recommendation:
Daily charts: 30–50
4H charts: 40–80
1H charts: 100–200
🎲 How to Use It in Practice
This indicator helps investors to understand when to be bullish, bearish or cautious and anticipate regular pullbacks, recovery of markets using quantitative methods.
The indicator does not generate buy/sell signals. However, helps traders set expectations and anticipate market movements based on past behavior.

Weekly price boxWeekend Trap / Custom Timebox Analyzer
This indicator allows traders to define a specific time window (e.g., the "Weekend Trap" period from Friday to Sunday, or a full weekly range) and automatically draws a box highlighting the price action during that session. It is designed to help visualize gaps, ranges, and trend direction over specific timeframes.
Key Features
Dynamic Range Detection: automatically draws a box connecting the Highest High and Lowest Low occurring between your start and end times.
Trend Visualization: The box changes color dynamically based on price performance:
Bullish (Blue): Close is higher than the Open of the defined period.
Bearish (Red): Close is lower than the Open of the defined period.
Smart Labeling: Displays a customizable label (default: "Box") along with the real-time Percentage Change of the period. The label is positioned intelligently outside the box to avoid cluttering the price action.
Flexible Timing:
Supports standard intraday sessions (e.g., Mon 09:00 to Mon 17:00).
Supports "wrap-around" sessions (e.g., Friday 23:00 to Sunday 17:00).
New: Supports full-week monitoring (e.g., Friday to Friday) by handling start times that are later than end times on the same day.
Fully Customizable:
Configure specific Bullish and Bearish colors (Border, Background, Text).
Adjust line styles (Solid, Dashed, Dotted) and widths.
Select days via easy-to-use dropdown menus.
How to Use
Time Settings:
Select your Start Day and Time (e.g., Friday 23:00).
Select your End Day and Time (e.g., Sunday 17:00).
Note: Times are based on the Chart/Exchange time.
Visual Settings:
Go to the settings menu to define your preferred colors for Bullish and Bearish scenarios.
Toggle the Label on/off and adjust text size.
Use Cases
Weekend Gaps: Monitor price action that occurs during off-hours or between market close and open.
Opening Range Breakouts: Define the first hour of trading to see the initial range.
Weekly Profiles: Set the start and end day to the same day (e.g., Friday to Friday) to visualize the entire week's range and net performance.
Built with Pine Script™ v6

Diodato 'All Stars Align' Signal (Trend Filtered)This indicator implements the Diodato "All Stars Align" strategy, a breadth-based system designed to identify high-probability reversal points by analyzing internal market strength rather than just price action. It works by monitoring Advancing versus Declining issues and volume across the exchange to detect moments of extreme market panic. When these internal breadth metrics hit specific oversold thresholds and align simultaneously with a standard Stochastic oscillator, the script signals a potential bottom.
I have modified this version to strictly enforce trend alignment. The signals are now filtered so that they will only appear if the 50 SMA is trading above the 200 SMA. This ensures that the indicator only highlights buying opportunities during established uptrends while completely filtering out signals during bearish market regimes.
You should use this tool to time entries during market pullbacks. A green cross indicates that one of the major breadth components has aligned with oversold Stochastics, while a purple cross indicates a stronger signal where both volume and issue-based breadth metrics have triggered together.

Relative Performance Areas [LuxAlgo]The Relative Performance Areas tool enables traders to analyze the relative performance of any asset against a user-selected benchmark directly on the chart, session by session.
The tool features three display modes for rescaled benchmark prices, as well as a statistics panel providing relevant information about overperforming and underperforming streaks.
🔶 USAGE
Usage is straightforward. Each session is highlighted with an area displaying the asset price range. By default, a green background is displayed when the asset outperforms the benchmark for the session. A red background is displayed if the asset underperforms the benchmark.
The benchmark is displayed as a green or red line. An extended price area is displayed when the benchmark exceeds the asset price and is set to SPX by default, but traders can choose any ticker from the settings panel.
Using benchmarks to compare performance is a common practice in trading and investing. Using indexes such as the S&P 500 (SPX) or the NASDAQ 100 (NDX) to measure our portfolio's performance provides a clear indication of whether our returns are above or below the broad market.
As the previous chart shows, if we have a long position in the NASDAQ 100 and buy an ETF like QQQ, we can clearly see how this position performs against BTSUSD and GOLD in each session.
Over the last 15 sessions, the NASDAQ 100 outperformed the BTSUSD in eight sessions and the GOLD in six sessions. Conversely, it underperformed the BTCUSD in seven sessions and the GOLD in nine sessions.
🔹 Display Mode
The display mode options in the Settings panel determine how benchmark performance is calculated. There are three display modes for the benchmark:
Net Returns: Uses the raw net returns of the benchmark from the start of the session.
Rescaled Returns: Uses the benchmark net returns multiplied by the ratio of the benchmark net returns standard deviation to the asset net returns standard deviation.
Standardized Returns: Uses the z-score of the benchmark returns multiplied by the standard deviation of the asset returns.
Comparing net returns between an asset and a benchmark provides traders with a broad view of relative performance and is straightforward.
When traders want a better comparison, they can use rescaled returns. This option scales the benchmark performance using the asset's volatility, providing a fairer comparison.
Standardized returns are the most sophisticated approach. They calculate the z-score of the benchmark returns to determine how many standard deviations they are from the mean. Then, they scale that number using the asset volatility, which is measured by the asset returns standard deviation.
As the chart above shows, different display modes produce different results. All of these methods are useful for making comparisons and accounting for different factors.
🔹 Dashboard
The statistics dashboard is a great addition that allows traders to gain a deep understanding of the relationship between assets and benchmarks.
First, we have raw data on overperforming and underperforming sessions. This shows how many sessions the asset performance at the end of the session was above or below the benchmark.
Next, we have the streaks statistics. We define a streak as two or more consecutive sessions where the asset overperformed or underperformed the benchmark.
Here, we have the number of winning and losing streaks (winning means overperforming and losing means underperforming), the median duration of each streak in sessions, the mode (the number of sessions that occurs most frequently), and the percentages of streaks with durations equal to or greater than three, four, five, and six sessions.
As the image shows, these statistics are useful for traders to better understand the relative behavior of different assets.
🔶 SETTINGS
Benchmark: Benchmark for comparison
Display Mode: Choose how to display the benchmark; Net Returns: Uses the raw net returns of the benchmark. Rescaled Returns: Uses the benchmark net returns multiplied by the ratio of the benchmark and asset standard deviations. Standardized Returns: Uses the benchmark z-score multiplied by the asset standard deviation.
🔹 Dashboard
Dashboard: Enable or disable the dashboard.
Position: Select the location of the dashboard.
Size: Select the dashboard size.
🔹 Style
Overperforming: Enable or disable displaying overperforming sessions and choose a color.
Underperforming: Enable or disable displaying underperforming sessions and choose a color.
Benchmark: Enable or disable displaying the benchmark and choose colors.

Aspects of Mars-Saturn by BTThis script displays the most commonly used aspects between Mars and Saturn. It uses a +/-2 degree orb (deviation), meaning the script shows the dates when the calculated distance between Mars and Saturn is within a 2 degree deviation of a major aspect.
Most of the astrological applications uses 3 degree or more for orb however this will cause chart overload. So please keep in mind to consider a couple of dates before or after if you want to use bigger orb.
The script includes an option to plot only the start date of sequential aspect events to reduce visual clutter and improve chart clarity. It currently covers dates from 2020 to 2030, but more will be added soon.
Currently available aspects:
Conjunction - 0 Degree
Opposition - 180 Degree
Trine - 120 Degree
Square - 90 Degree
Sextile - 60 Degree
Inconjunction - 150 Degree
Semi-Sextile - 30 Degree
Semi-Square - 45 Degree
Sesquiquadrate - 135 Degree

Trading Sessions [QuantAlgo]🟢 Overview
The Trading Sessions indicator tracks and displays the four major global trading sessions: Sydney, Tokyo, London, and New York. It provides session-based background highlighting, real-time price change tracking from session open, and a data table with session status. The script works across all markets (forex, equities, commodities, crypto) and helps traders identify when specific geographic markets are active, which directly correlates with changes in liquidity and volatility patterns. Default session times are set to major financial center hours in UTC but are fully adjustable to match your trading methodology.
🟢 Key Features
→ Session Background Color Coding
Each trading session gets a distinct background color on your chart:
1. Sydney Session - Default orange, 22:00-07:00 UTC
2. Tokyo Session - Default red, 00:00-09:00 UTC
3. London Session - Default green, 08:00-16:00 UTC
4. New York Session - Default blue, 13:00-22:00 UTC
When sessions overlap, the color priority is New York > London > Tokyo > Sydney. This means if London and New York are both active, the background shows New York's color. The priority matches typical liquidity and volatility patterns where later sessions generally show higher volume.
→ Color Customization
All session colors are configurable in the Color Settings panel:
1. Click any session color input to open the color picker
2. Select your preferred color for that session
3. Use the "Background Transparency" slider (0-100) to adjust opacity. Lower values = more visible, higher values = more subtle
4. Enable "Color Price Bars" to color candlesticks themselves according to the active session instead of just the background
The Color column in the info table shows a block (█) in each session's assigned color, matching what you see on the chart background.
→ Information Table Breakdown
→ Timeframe Warning
If you're viewing a timeframe of 12 hours or higher, a red warning label appears center-screen. Session boundaries don't render accurately on high timeframes because the time() function in Pine Script can't detect intra-bar session changes when each bar spans multiple sessions. The warning tells you to switch to sub-12H timeframes (e.g., 4H, 1H, 30m, 15m, etc.) for proper session detection. You can disable this warning in Color Settings if needed, but session highlighting can be unreliable on 12H+ charts regardless.
→ Time Range Configuration
Every session's time range is editable in Session Settings:
1. Click the time input field next to each session
2. Enter time as HHMM-HHMM in 24-hour format
3. All times are interpreted as UTC
4. Modify these to account for daylight saving shifts or to define custom session periods based on your backtested optimal trading windows
For example, if your strategy performs best during London/NY overlap specifically, you could set London to 08:00-17:00 and New York to 13:00-22:00 to ensure you see the full overlap highlighted.
→ Weekdays Filter
The "Weekdays Only (Mon-Fri)" toggle controls whether sessions display on weekends:
Enabled: Sessions only show Monday-Friday and hide on Saturday-Sunday. Use this for markets that close on weekends (most equities, forex).
Disabled: Sessions display 24/7 including weekends. Use this for markets that trade continuously (crypto).
→ Table Display Options
The info table has several configuration options in Table Settings:
Visibility: Toggle "Show Info Table" on/off to display or hide the entire table.
Position: Nine position options (Top/Middle/Bottom + Left/Center/Right) let you place the table wherever it doesn't block your price action or other indicators.
Text Size: Four size options (Tiny, Small, Normal, Large) to match your screen resolution and visual preferences.
→ Color Schemes:
Mono: Black background, gray header, white text
Light: White background, light gray header, black text
Blue: Dark blue background, medium blue header, white text
Custom: Manual selection of all five color components (table background, header background, header text, data text, borders)
→ Alert Functionality
The indicator includes ten alert conditions you can access via TradingView's alert system:
Session Opens:
1. Sydney Session Started
2. Tokyo Session Started
3. London Session Started
4. New York Session Started
5. Any Session Started
Session Closes:
6. Sydney Session Ended
7. Tokyo Session Ended
8. London Session Ended
9. New York Session Ended
10. Any Session Ended
These alerts fire when sessions transition based on your configured time ranges, letting you automate monitoring of session changes without watching the chart continuously. Useful for strategies that trade specific session opens/closes or need to adjust position sizing when volatility regime shifts between sessions.

Forex Session TrackerForex Session Tracker - Professional Trading Session Indicator
The Forex Session Tracker is a comprehensive and visually intuitive indicator designed specifically for forex traders who need precise tracking of major global trading sessions. This powerful tool helps traders identify active market sessions, monitor session-specific price ranges, and capitalize on volatility patterns unique to each trading period.
Understanding when major financial centers are active is crucial for forex trading success. This indicator provides real-time visualization of the Tokyo, London, New York, and Sydney trading sessions, allowing traders to align their strategies with peak liquidity periods and avoid low-volatility trading windows.
---
Key Features
📊 Four Major Global Trading Sessions
The indicator tracks all four primary forex trading sessions with precision:
- Tokyo Session (Asian Market) - Captures the Asian trading hours, ideal for JPY, AUD, and NZD pairs
- London Session (European Market) - Monitors the most liquid trading period, perfect for EUR, GBP pairs
- New York Session (American Market) - Tracks US market hours, essential for USD-based currency pairs
- Sydney Session (Pacific Market) - Identifies the opening of the trading week and AUD/NZD activity
Each session is fully customizable with individual color schemes, making it easy to distinguish between different market periods at a glance.
🎯 Session Range Visualization
For each active trading session, the indicator automatically:
- Draws rectangular boxes that highlight the session's time period
- Tracks and displays session HIGH and LOW price levels in real-time
- Creates horizontal lines at session extremes for easy reference
- Positions session labels at the center of each trading period
- Updates dynamically as new highs or lows are formed within the session
This visual approach helps traders quickly identify:
- Session breakout opportunities
- Support and resistance zones formed during specific sessions
- Range-bound vs. trending session behavior
- Key price levels that institutional traders are watching
📱 Live Information Dashboard
A sleek, professional information panel displays:
- Real-time session status - Instantly see which sessions are currently active
- Color-coded indicators - Green dots for active sessions, gray for closed sessions
- Timezone information - Confirms your current timezone settings
- Customizable positioning - Place the dashboard anywhere on your chart (Top Left, Top Right, Bottom Left, Bottom Right)
- Adjustable size - Choose from Tiny, Small, Normal, or Large text sizes for optimal visibility
The dashboard provides at-a-glance awareness of market conditions without cluttering your chart analysis.
⚙️ Extensive Customization Options
Every aspect of the indicator can be tailored to your trading preferences:
Session-Specific Controls:
- Enable/disable individual sessions
- Customize colors for each trading period
- Adjust session times to match your broker's server time
- Toggle background highlighting on/off
- Show/hide session high/low lines independently
General Settings:
- UTC Offset Control - Adjust timezone from UTC-12 to UTC+14
- Exchange Timezone Option - Automatically use your chart's exchange timezone
- Background Transparency - Fine-tune the opacity of session highlighting (0-100%)
- Session Labels - Show or hide session name labels
- Information Panel - Toggle the live status dashboard on/off
Style Settings:
- Turn session backgrounds ON/OFF directly from the Style tab
- Maintain clean charts while keeping all analytical features active
🔔 Built-in Alert System
Stay informed about session openings with customizable alerts:
- Tokyo Session Started
- London Session Started
- New York Session Started
- Sydney Session Started
Set up notifications to never miss important market opening periods, even when you're away from your charts.
---
How to Use This Indicator
For Day Traders:
1. Identify High-Volatility Periods - Focus your trading during London and New York session overlaps for maximum liquidity
2. Monitor Session Breakouts - Watch for price breaks above/below session highs and lows
3. Avoid Low-Volume Periods - Recognize when major sessions are closed to avoid false signals
For Swing Traders:
1. Mark Key Levels - Use session highs and lows as support/resistance zones
2. Track Multi-Session Patterns - Observe how price behaves across different trading sessions
3. Plan Entry/Exit Points - Time your trades around session openings for better execution
For Currency-Specific Traders:
1. JPY Pairs - Focus on Tokyo session movements
2. EUR/GBP Pairs - Monitor London session activity
3. USD Pairs - Track New York session volatility
4. AUD/NZD Pairs - Watch Sydney and Tokyo sessions
---
Technical Specifications
- Pine Script Version: 5
- Overlay Indicator: Yes (displays directly on price chart)
- Maximum Bars Back: 500
- Drawing Objects: Up to 500 lines, boxes, and labels
- Performance: Optimized for real-time data processing
- Compatibility: Works on all timeframes (recommended: 5m to 1H for session tracking)
---
Installation & Setup
1. Add to Chart - Click "Add to Chart" after copying the script to Pine Editor
2. Configure Timezone - Set your UTC offset or enable "Use Exchange Timezone"
3. Customize Colors - Choose your preferred color scheme for each session
4. Adjust Display - Enable/disable features based on your trading style
5. Set Alerts - Create alert notifications for session starts
---
Best Practices
✅ Combine with Price Action - Use session ranges alongside candlestick patterns for confirmation
✅ Watch Session Overlaps - The London-New York overlap (1300-1600 UTC) typically shows highest volatility
✅ Respect Session Highs/Lows - These levels often act as intraday support and resistance
✅ Adjust for Your Broker - Verify session times match your broker's server clock
✅ Use Multiple Timeframes - View sessions on both lower (15m) and higher (1H) timeframes for context
---
Why Choose Forex Session Tracker Pro?
✨ Professional Grade Tool - Built with clean, efficient code following TradingView best practices
✨ Beginner Friendly - Intuitive design with clear visual cues
✨ Highly Customizable - Adapt every feature to match your trading style
✨ Performance Optimized - Lightweight code that won't slow down your charts
✨ Actively Maintained - Regular updates and improvements
✨ No Repainting - All visual elements are fixed once the session completes
---
Support & Updates
This indicator is designed to provide reliable, accurate session tracking for forex traders of all experience levels. Whether you're a scalper looking for high-volatility windows or a position trader marking key institutional levels, the Forex Session Tracker Pro delivers the insights you need to make informed trading decisions.
Happy Trading! 📈
---
Disclaimer
This indicator is a tool for technical analysis and should be used as part of a comprehensive trading strategy. Past performance does not guarantee future results. Always practice proper risk management and never risk more than you can afford to lose. Trading forex carries a high level of risk and may not be suitable for all investors.

Buyers in Control █ OVERVIEW
The "Buyers in Control" indicator identifies periods when buying pressure dominates the market by combining three key technical factors:
✓ Price Momentum - Price trading above exponential moving average
✓ Volume Confirmation - Current volume exceeding average (strong participation)
✓ RSI Strength - Momentum indicator confirming bullish bias
When all three conditions align, the indicator signals that buyers are in control of the market.
█ HOW IT WORKS
The indicator evaluates three independent conditions:
1. PRICE POSITION: Close > EMA(21)
→ Confirms price is in an uptrend
2. VOLUME SURGE: Volume > SMA(20) × 1.2
→ Validates that the move has genuine buying interest
3. MOMENTUM: RSI(14) > 50
→ Ensures bullish momentum is present
Only when ALL three conditions are true does the indicator confirm buyer control.
█ KEY FEATURES
• Real-time Dashboard - Shows status of each condition (✓/✗)
• Visual Alerts - Green background + labels when buyers take control
• EMA Reference Line - Visual trend indicator
• Customizable Parameters - Adjust sensitivity for any market/timeframe
• Built-in Alerts - Notification when control shifts to buyers
• Clean Code - Well-documented Pine Script v6
█ SETTINGS
Price Momentum:
- EMA Length (default: 21) - Shorter = faster signals, Longer = more conservative
Volume Confirmation:
- Volume Multiple (default: 1.2) - Higher = requires stronger volume
- Volume SMA Length (default: 20) - Lookback period for average volume
RSI Momentum:
- RSI Length (default: 14) - Standard RSI calculation period
- RSI Threshold (default: 50) - Minimum RSI for buyer control
Display:
- Toggle background, labels, EMA line, and customize colors
█ USE CASES
• Trend Confirmation - Validate bullish moves before entering long positions
• Filter Weak Rallies - Avoid low-volume pumps that often reverse
• Multi-Timeframe Analysis - Check buyer control across multiple charts
• Alert System - Get notified when market regime shifts to buyers
█ BEST PRACTICES
✓ Works best in trending markets (avoid choppy/ranging conditions)
✓ Combine with support/resistance for optimal entries
✓ Test different EMA lengths for your specific asset/timeframe
✓ Use alongside risk management rules (stop losses, position sizing)
✓ Consider the dashboard to see which conditions are missing
█ TIMEFRAMES
Suitable for all timeframes:
• Intraday: 1m-15m (use EMA 9 for faster signals)
• Swing: 1h-4h (default settings work well)
• Position: Daily-Weekly (use EMA 50 for conservative signals)
█ TECHNICAL NOTES
• Pine Script v6 - Latest version for optimal performance
• No repainting - All calculations based on closed bar data
• Lightweight - Minimal CPU usage
• Open Source - Full code available for review and modification
█ ALERT CONDITIONS
1. "Buyers Take Control" - Fires when all three conditions become true
2. "Buyers Lose Control" - Fires when any condition breaks
█ LIMITATIONS
⚠ Not a standalone trading system - use as a confluence tool
⚠ May generate false signals in sideways/choppy markets
⚠ Volume data unavailable on some forex pairs (use tick volume)
⚠ Lagging by nature - confirmatory indicator, not predictive
█ CREDITS
Indicator combines classic technical analysis principles:
• EMA for trend direction
• Volume analysis for validation
• RSI for momentum confirmation
No proprietary algorithms - transparent, time-tested methods.

Swing Point PnL PressureThis indicator visualizes the cumulative profit potential of bulls and bears based on recent swing highs and lows — offering a unique lens into trend maturity, sentiment imbalance, and exhaustion risk.
🟢 Bull PnL rises as price moves above prior swing lows — reflecting unrealized gains for long positions
🔴 Bear PnL rises as price drops below prior swing highs — capturing short-side profitability
Over time, these curves diverge during strong trends, revealing which side is in control. But when they converge, it often signals that the dominant side is losing steam — a potential turning point where profit-taking, traps, or reversals may emerge.
This tool doesn’t predict tops or bottoms — it tracks the emotional and financial pressure building on each side of the market. Use it to:
Spot trend exhaustion before price confirms it
Identify profit parity zones where sentiment may flip
Time accumulation or distribution phases with greater confidence
Whether you’re swing trading or analyzing macro structure, this indicator helps you see what price alone can’t: who’s winning, who’s trapped, and who’s about to give up.

SNS 2TimeFrame 1-Candles Indicator contains 2 time frame candles. once higher candle green and lower candle smoothed then it will consider as bullish.


Elder's Complete Trading SystemKey Features:
✅ ENHANCED SIGNALS (🔥 symbols) = ALL conditions perfectly aligned:
Weekly trend confirmation
Daily pullback/rally against trend
Multiple indicator convergence
Divergence detection
Volume confirmation
Proper channel positioning
✅ Standard Signals = Basic Triple Screen requirements met
✅ Comprehensive Dashboard shows real-time status of ALL indicators
✅ Automatic Stop Loss & Target Calculation based on 2% rule
✅ Multiple Alert Types for different signal strengths
What Makes This "Perfect":
Implements EVERY major concept from the book:
Triple Screen (3 timeframes)
Elder-ray (Bull/Bear Power)
Force Index (Price + Volume)
MACD-Histogram with divergences
Multiple oscillators (Stochastic, Williams %R)
Volume analysis
Channel trading
2% Rule risk management
Losers Anonymous principles
Professional-Grade Features:
Multi-timeframe analysis
Divergence detection (most powerful signals)
Risk/reward calculation
Position sizing suggestions
Visual stop loss & target lines
Comprehensive alerting system
Follows Elder's Philosophy:
Quality over quantity
Risk management FIRST
Multiple confirmation required
Clear visual feedback
Educational reminders built-in
Best Practices:
Use on DAILY charts primarily
Set higher timeframe to WEEKLY
Only take ENHANCED signals for highest probability
ALWAYS follow the 2% rule
Check the dashboard before every trade
Wait for ALL confirmations to align
This is the most comprehensive Dr. Elder indicator possible—combining every trading principle from his book into one powerful system!

Global M2 Money Supply Growth (GDP-Weighted)📊 Global M2 Money Supply Growth (GDP-Weighted)
This indicator tracks the weighted aggregate M2 money supply growth across the world's four largest economies: United States, China, Eurozone, and Japan. These economies represent approximately 69.3 trillion USD in combined GDP and account for the majority of global liquidity, making this a comprehensive macro indicator for analyzing worldwide monetary conditions.
════════════════════════════════════════════
🔧 KEY FEATURES:
📈 GDP-Weighted Aggregation
Each economy is weighted proportionally by its nominal GDP using 2025 IMF World Economic Outlook data:
• United States: 44.2% (30.62 trillion USD)
• China: 28.0% (19.40 trillion USD)
• Eurozone: 21.6% (15.0 trillion USD)
• Japan: 6.2% (4.28 trillion USD)
The weights are fully adjustable through the indicator settings, allowing you to update them annually as new IMF forecasts are released (typically April and October).
⏱️ Multiple Time Period Options
Choose between three calculation methods to analyze different timeframes:
• YoY (Year-over-Year): 12-month growth rate for identifying long-term liquidity trends and cycles
• MoM (Month-over-Month): 1-month growth rate for detecting short-term monetary policy shifts
• QoQ (Quarter-over-Quarter): 3-month growth rate for medium-term trend analysis
🔄 Advanced Offset Function
Shift the entire indicator forward by 0-365 days to test lead/lag relationships between global liquidity and asset prices. Research suggests a 56-70 day lag between M2 changes and Bitcoin price movements, but you can experiment with different offsets for various assets (equities, gold, commodities, etc.).
🌍 Individual Country Breakdown
Real-time display of each economy's M2 growth rate with:
• Current percentage change (YoY/MoM/QoQ)
• GDP weight contribution
• Color-coded values (green = monetary expansion, red = contraction)
📊 Smart Overlay Capability
Displays directly on your main price chart with an independent left-side scale, allowing you to visually correlate global liquidity trends with any asset's price action without cluttering the chart.
🔧 Customizable GDP Weights
All GDP values can be adjusted through the indicator settings without editing code, making annual updates simple and accessible for all users.
════════════════════════════════════════════
📡 DATA SOURCES:
All M2 money supply data is sourced from ECONOMICS (Trading Economics) for consistency and reliability:
• ECONOMICS:USM2 (United States)
• ECONOMICS:CNM2 (China)
• ECONOMICS:EUM2 (Eurozone)
• ECONOMICS:JPM2 (Japan)
All values are normalized to USD using current daily exchange rates (USDCNY, EURUSD, USDJPY) before GDP-weighted aggregation, ensuring accurate cross-country comparisons.
══════════════════════════════════════════════
💡 USE CASES & APPLICATIONS:
🔹 Liquidity Cycle Analysis
Track global monetary expansion/contraction cycles to identify when central banks are coordinating loose or tight monetary policies.
🔹 Market Timing & Risk Assessment
High M2 growth (>10%) historically correlates with risk-on environments and rising asset prices across crypto, equities, and commodities. Negative M2 growth signals monetary tightening and potential market corrections.
🔹 Bitcoin & Crypto Correlation
Compare with Bitcoin price using the offset feature to identify the optimal lag period. Many traders use 60-70 day offsets to predict crypto market movements based on liquidity changes.
🔹 Macro Portfolio Allocation
Use as a regime filter to adjust portfolio exposure: increase risk assets during liquidity expansion, reduce during contraction.
🔹 Central Bank Policy Divergence
Monitor individual country metrics to identify when major central banks are pursuing divergent policies (e.g., Fed tightening while China eases).
🔹 Inflation & Economic Forecasting
Rapid M2 growth often leads inflation by 12-18 months, making this a leading indicator for future inflation trends.
🔹 Recession Early Warning
Negative M2 growth is extremely rare and has preceded major recessions, making this a valuable risk management tool.
════════════════════════════════════════════
📊 INTERPRETATION GUIDE:
🟢 +10% or Higher
Aggressive monetary expansion, typically during crises (2001, 2008, 2020). The COVID-19 period saw M2 growth reach 20-27%, which preceded significant inflation and asset price surges. Strong bullish signal for risk assets.
🟢 +6% to +10%
Above-average liquidity growth. Central banks are providing stimulus beyond normal levels. Generally favorable for equities, crypto, and commodities.
🟡 +3% to +6%
Normal/healthy growth rate, roughly in line with GDP growth plus 2% inflation targets. Neutral environment with moderate support for risk assets.
🟠 0% to +3%
Slowing liquidity, potential tightening phase beginning. Central banks may be raising rates or reducing balance sheets. Caution warranted for high-beta assets.
🔴 Negative Growth
Monetary contraction - extremely rare. Only occurred during aggressive Fed tightening in 2022-2023. Strong warning signal for risk assets, often precedes recessions or major market corrections.
════════════════════════════════════════════
🎯 OPTIMAL USAGE:
📅 Recommended Timeframes:
• Daily or Weekly charts for macro analysis
• Monthly charts for very long-term trends
💹 Compatible Asset Classes:
• Cryptocurrencies (especially Bitcoin, Ethereum)
• Equity indices (S&P 500, NASDAQ, global markets)
• Commodities (Gold, Silver, Oil)
• Forex majors (DXY correlation analysis)
⚙️ Suggested Settings:
• Default: YoY calculation with 0 offset for current liquidity conditions
• Bitcoin traders: YoY with 60-70 day offset for predictive analysis
• Short-term traders: MoM with 0 offset for recent policy changes
• Quarterly rebalancers: QoQ with 0 offset for medium-term trends
════════════════════════════════════════════
📋 VISUAL DISPLAY:
The indicator plots a blue line showing the selected growth metric (YoY/MoM/QoQ), with a dashed reference line at 0% to clearly identify expansion vs. contraction regimes.
A comprehensive table in the top-right corner displays:
• Current global M2 growth rate (large, prominent display)
• Individual country breakdowns with their GDP weights
• Color-coded growth rates (green for positive, red for negative)
════════════════════════════════════════════
🔄 MAINTENANCE & UPDATES:
GDP weights should be updated annually (ideally in April or October) when the IMF releases new World Economic Outlook forecasts. Simply adjust the four GDP input parameters in the indicator settings - no code editing required.
The relative GDP proportions between the Big 4 economies change very gradually (typically <1-2% per year), so even if you update weights once every 1-2 years, the impact on the indicator's accuracy is minimal.
════════════════════════════════════════════
💭 TRADING PHILOSOPHY:
This indicator embodies the principle that "liquidity drives markets." By tracking the combined M2 money supply of the world's largest economies, weighted by their economic size, you gain insight into the fundamental liquidity conditions that underpin all asset prices.
Unlike single-country M2 indicators, this GDP-weighted approach captures the true global picture, accounting for the fact that US monetary policy has 2x the impact of Japanese policy due to economic size differences.
Perfect for macro-focused traders, long-term investors, and anyone seeking to understand the "tide that lifts all boats" in financial markets.
════════════════════════════════════════════
Created for traders and investors who incorporate global liquidity trends into their decision-making process. Best used alongside other technical and fundamental analysis tools for comprehensive market assessment.
⚠️ Disclaimer: M2 money supply is a lagging macroeconomic indicator. Past correlations do not guarantee future results. Always use proper risk management and combine with other analysis methods.


J&C Indicator 20/40 MA4H SMA Signal Map (20/40) Strategy
Timeframe: 4-Hour
Overview:
This is a momentum-based trend confirmation system using dual moving averages. The strategy identifies potential entry points when price action aligns with moving average positioning.
LONG Signal:
Triggers when the market demonstrates bullish momentum with price confirming an upside breakout while both moving averages are in a favorable uptrend alignment.
SHORT Signal:
Triggers when the market demonstrates bearish momentum with price confirming a downside breakdown while both moving averages are in a favorable downtrend alignment.
Key Features:
Uses a 20-period and 40-period simple moving average on the 4-hour timeframe
Filters out false signals by requiring multi-factor confirmation
Generates clear visual alerts with background highlighting
Real-time dashboard showing current MA values and trend direction
Sound/notification alerts for immediate signal awareness
Best Used For:
Swing trading on higher timeframes with proper risk management and support from additional confluence factors on your trading setup.
