ICT Unicorn Model [Kodexius]ICT Unicorn Model is a market structure and imbalance confluence tool that automatically detects high probability “Unicorn” setups by combining three key elements into a single, clean script:
-A first, clean break of that swing level (displacement style break)
-A Fair Value Gap that overlaps a breaker candle body range
Instead of plotting every pivot or every imbalance independently, the script waits for a specific sequence: price establishes a valid swing, breaks that swing for the first time, and prints a setup only when the resulting context aligns with a valid, volatility filtered FVG and a clearly defined breaker range.
Each detected setup is drawn directly on the chart with labeled zones (Breaker and FVG) and is then actively monitored. If price violates the breaker boundary based on your chosen invalidation basis (Close or Wick), the setup is marked inactive and can optionally be removed to keep the chart clean.
This indicator is designed for traders who work with ICT style concepts such as liquidity runs, displacement, breaker blocks, and imbalance reversion, and who want a structured, rules based visualization rather than discretionary drawing.
🔹 Features
🔸 Fair Value Gap Detection With Volatility Filtering
Bullish and bearish FVGs are detected using classic three candle imbalance logic. To avoid low quality gaps during compression, the script applies an ATR based minimum size filter using the “FVG Min Size (ATR Multiplier)” input. Only gaps larger than ATR * threshold are considered valid.
🔸 First Break Validation (Clean Break Logic)
A key part of the model is identifying a “first break” of a swing level. The script checks whether the swing price has already been invalidated between the swing bar and the current bar. If it has, the swing is ignored. This helps reduce repeated signals and focuses on fresh structural breaks.
🔸 Breaker and FVG Confluence With Overlap Requirement
After a valid break occurs, the script defines a breaker range using the body of the swing candle (open and close). A setup is only created if this breaker body range overlaps the detected FVG price range. This overlap requirement is what filters many “almost” conditions and keeps signals more selective.
Bullish Unicorn:
Bearish Unicorn:
🔸 Configurable Invalidation Basis (Close or Wick)
You can choose how a setup fails:
-Close: invalidation requires a candle close beyond the breaker boundary
-Wick: invalidation occurs as soon as any wick crosses beyond the breaker boundary
This allows the tool to adapt to different trading styles, from conservative confirmation to more sensitive risk control.
🔸 Automatic Cleanup of Failed Setups
If “Delete Invalidated Setups” is enabled, the script removes the breaker box, FVG box, and label as soon as the setup is invalidated. If disabled, the zones remain visible for review while the setup is marked inactive internally.
🔸 Clear Chart Visuals
Each setup plots:
-A labeled Breaker zone box
-A labeled FVG zone box
-A directional Unicorn label (Bull or Bear) that updates position as the chart advances
Colors for bullish and bearish structures are fully configurable.
🔸 Alert Conditions
Two alert conditions are provided:
-Bullish Unicorn Setup Detected
-Bearish Unicorn Setup Detected
Alerts trigger only on the bar a new setup is created.
🔹 Calculations
This section summarizes the main computations used internally. The goal here is to explain the model mechanics rather than reproduce every implementation detail.
1. Swing Detection (Pivot High / Pivot Low)
Swing levels are detected using a symmetric pivot definition with “Swing Length” bars on both sides:
float ph = ta.pivothigh(high, swingLength, swingLength)
float pl = ta.pivotlow(low, swingLength, swingLength)
When a pivot is confirmed, its price and originating bar index are stored:
-Swing High: price = pivot high, isHigh = true
-Swing Low: price = pivot low, isHigh = false
The script keeps a limited history (most recent swings) to stay efficient.
2. Fair Value Gap Detection
FVGs use the classic three candle displacement imbalance:
Bullish FVG condition
bool isBullFVG = high < low
Bullish gap range is defined as:
-Top = low
-Bottom = high
Bearish FVG condition
bool isBearFVG = low > high
Bearish gap range is defined as:
-Top = low
-Bottom = high
3. ATR Based Minimum Gap Filter
ATR is computed (length 14), then the gap size is compared against a user threshold:
float atr = ta.atr(14)
bool validBullFVG = isBullFVG and (bullFvgTop - bullFvgBot) > (atr * fvgThreshold)
bool validBearFVG = isBearFVG and (bearFvgTop - bearFvgBot) > (atr * fvgThreshold)
This prevents very small imbalances from generating setups in low volatility conditions.
4. “First Break” Check Using Level Invalidation Scan
Before accepting a swing break, the script scans forward from the swing bar to the current bar to confirm the level has not already been breached. The scan can be based on wick or close:
-Wick mode: uses high or low
-Close mode: uses close
Conceptually:
priceToCheck = mode == "Wick" ? (checkBelow ? low : high) : close
If a prior breach is found, the swing is treated as already invalidated and is ignored for setup creation.
5. Break Of Structure Condition
Bullish break requirement
A bullish setup requires breaking a stored swing high with bullish body intent:
-close > swingHighPrice
-open < close
Bearish break requirement
A bearish setup requires breaking a stored swing low with bearish body intent:
-close < swingLowPrice
-open > close
An additional proximity filter is applied in the bearish branch to reduce weak or overly extended breaks by requiring the prior close to be reasonably near the swing level.
6. Breaker Range Construction
Once a qualifying swing is found, the breaker range is derived from the body of the swing candle (the candle at the swing bar index). The body boundaries are:
float breakerTop = math.max(bOpen, bClose)
float breakerBot = math.min(bOpen, bClose)
This models the breaker as the candle body range rather than full wick range, which typically produces more practical invalidation boundaries.
7. Overlap Test Between Breaker and FVG
A setup is only created if the breaker body overlaps the FVG zone. Conceptually the script rejects cases where one range is fully above or fully below the other:
-If there is no overlap, no setup is created
-If overlap exists, the Unicorn setup is valid
8. Active Monitoring and Invalidation
Each setup remains active until invalidated. Invalidation is evaluated every bar using your selected basis:
-Close basis: compares close to breaker boundary
-Wick basis: compares high or low to breaker boundary
Bullish invalidation
Setup fails if price crosses below breaker bottom.
Bearish invalidation
Setup fails if price crosses above breaker top.
If deletion is enabled, all drawings related to that setup are removed immediately on invalidation.
9. Drawing Updates and Object Lifecycle
Breaker and FVG boxes are extended to the right while the setup is active to keep zones visible into the near future. The Unicorn label is also repositioned as new bars print so the most recent context stays readable.
Ict


Universal Po3 Profiler [Pro +] | cephxsUNIVERSAL Po3 PROFILER 🧪
All concepts used in the development of this indicator are open source and available to all on youtube.
Credits go out to Michael J. H. (ICT) as the one putting it out there for all.
A refined approach to multi-timeframe structural analysis. Clean visuals. Precise signals. Nothing more than what matters.
OVERVIEW
Built for traders who value clarity over complexity, this profiler distills institutional price delivery concepts into a visually cohesive overlay. It maps higher timeframe structure directly onto your chart while detecting key divergence patterns across correlated assets.
The design philosophy is intentional minimalism—every element earns its place on your chart. No redundant indicators. No visual noise. Just the structural context you need to frame your trading decisions.
📷 Full indicator overview showing HTF candles, CISD lines, and SMT divergences on a 5m YM chart
CORE FEATURES
🧪 Multi-Timeframe Profiling
Automatically profiles up to three higher timeframes based on your chart's resolution. The system intelligently selects appropriate HTF pairings—or lets you override with manual control. 0 stress, minimal input overload.
Auto Mode: Adapts HTF selection to your chart timeframe
Profiler Source: Choose which HTF defines your structural boundaries
Directional Bias: Filter profiling to bullish or bearish setups only
📷 Side-by-side comparison; Auto mode on 5m chart vs 15m chart showing different HTF selections
🔀 SMT DIVERGENCE DETECTION
Identifies Smart Money divergences between correlated assets in real-time. When the primary asset makes a structural move that correlated pairs fail to confirm by moving in-sync, the system flags potential reversals.
Tracks divergences across multiple HTF sessions
Supports both normal and inverse correlations
Independent chart and HTF candle visualization
Automatic invalidation when divergence resolves
Configurable asset pairs with correlation library integration that is updated regularly
📷 SMT divergence example, ES vs YM showing bearish divergence at session highs
📐 CISD DETECTION & FIBONACCI PROJECTIONS
Change in State of Delivery (CISD) marks the moment price starts to deliver in the opposing direction of where it previously went. The system identifies these pivotal transitions and projects optional Fibonacci extensions to map potential price targets.
Automatic stretch calculation from opposing candle sequences
Confirmation-based detection (not predictive)
Fibonacci projections with customizable levels (-1 to -4.5)
Size filtering to eliminate noise on smaller moves
Visual invalidation when structure breaks
📷 Confirmed CISD with Fibonacci projection levels (other features disabled to highlight)
📷 Multiple CISDs showing bullish and bearish examples simultaneously
🎯 MANIPULATION AREA PROFILING
Detects sweep-and-reversal sequences within HTF candle boundaries. The profiling system identifies when price sweeps the immediate previous candle's extreme then confirms directional commitment after a candle close.
How the manipulation area is calculated (it is not a magic level, it's a simple division : ) )
For C3 : is measured from the Open of C3 to the quadrant C.E of C2
For C4 : is measured from the Open of C4 to the Upper Quadrant (25/75) of C3.
All Based on openly-sourced ICT Concepts
Po3 area visualization on profiler HTF
Sweep line tracking at structural levels
C1/C2/C3 phase progression
Bias filtering for directional focus
📷 Manipulation area highlighting Po3 zone with sweep lines
HTF CANDLE VISUALIZATION
Projects higher timeframe candles to the right of your chart, providing structural context without cluttering price action. Full credit for the base logic used in building this goes to @fadizeidan.
Up to 3 HTF layers with independent candle counts
PSP (Precision Swing Point) divergence detection on candles
Clean, adjustable styling
Session labels with countdown timers
INPUTS
Directional Bias
Po3 Profiling Bias: Auto / Bullish / Bearish — filters manipulation area detection
CISD/SSMT Bias: Auto / Bullish / Bearish — filters divergence detection
HTF Configuration
Auto Mode: Enabled by default. Automatically configures HTF timeframes
HTF 1/2/3: Manual timeframe selection when Auto Mode disabled
Profiler Source: Which HTF defines profiling boundaries
SMT Settings
Enable SMT: Master toggle for divergence detection
Show on Chart: Render divergence lines on price chart
Show on HTF Candles: Render divergence lines on HTF candle visuals
Asset Selection: Configure correlated pairs and inversion settings
CISD Settings
Show CISD: Enable change in state detection
Fibonacci Projections: Enable extension level plotting
Level Configuration: Toggle individual fib levels (-1 through -4.5)
Profiler Status Bar
Position: 9 positions including center options
Styling: Size, bold toggle, custom colors
---
RECOMMENDED USAGE
Start with Auto Mode enabled to learn the HTF relationships
Set your directional bias if you have a higher timeframe thesis
Watch for SMT divergences at session extremes
Use CISD confirmations to identify structural shifts
Reference Fibonacci projections for potential targets
Optimal Timeframes:
Scalping: 1m-3m charts (profiles to 15m-90m)
Intraday: 5m-15m charts (profiles to 1H-4H / Optionally 6H)
Swing: 1H-4H charts (profiles to Daily-Weekly)
---
CORRELATED ASSETS
The SMT system works with major correlations including:
Index Futures: CME_MINI:ES1! , CME_MINI:NQ1! , CBOT_MINI:YM1!
Forex Majors: FOREXCOM:EURUSD , FOREXCOM:GBPUSD , TVC:DXY
Crypto: BINANCE:BTCUSDT , BINANCE:ETHUSDT
Crypto Futures: CME:BTC1! , CME:ETH1!
---
NOTES
This version does not include alert conditions. Visual-first design.
It will be easier to understand if you have a preliminary knowledge of the concepts beforehand
This is not a learning instrument on it's own and could have bugs, Know it for yourself so you can identify bugs if any.
---
DISCLAIMER
This indicator is provided for educational and analytical purposes only. It does not constitute financial advice, and no representation is made regarding future performance.
Trading involves substantial risk of loss. Always conduct your own analysis and use proper risk management. Past structural patterns do not guarantee future price behavior.
---
CREDITS
Inspiration and HTF candle plotting boilerplate: @fadizeidan
Asset correlation library: fstarcapital
Development: cephxs & fstarcapital
---
CHANGELOG
v1.0: Initial Pro+ release — SMT divergences, CISD detection, multi-HTF Po3 profiling


QTheory [SSMT]QTheory –
This indicator is built on Quarterly Theory (developed by Daye)
🔹 Quarterly Theory
Markets often unfold in repeating quarterly cycles (Q1–Q4) across multiple timeframes — yearly, monthly, weekly, daily, 90-minute, and even micro cycles. By dividing price action into these quarters, traders can better anticipate structural shifts, accumulation/distribution phases, and liquidity runs.
🔹 Sequential SMT (SSMT)
Sequential SMT extends standard SMT (Smart Money Technique) by comparing multiple assets (such as FX majors) to identify divergences across quarters.
🔹 Features of QTheory
Automatic detection of quarterly cycles across multiple timeframes.
Visual cycle boxes & customizable dividers.
Integrated SSMT signals with divergence line visualization.
DFR (Defining Range) with Fibonacci levels.
Support for up to 5 comparison assets, with inversion options.
Auto-cycle selection for seamless multi-timeframe adaptation.
Extensive customization for colors, opacity, and signal display.
🔹 How it works
QTheory divides price data into consistent “quarters” across multiple timeframes. Within each cycle, it tracks highs, lows, and divergences, then overlays this information as boxes, dividers, and optional signals on your chart. Traders can use these visual cues to better align entries and exits with institutional market behavior patterns.
🔹 How to use it
Enable the desired cycle type (e.g., weekly, daily, 90-minute) from the settings.
Toggle boxes, dividers, and signals depending on your trading style.
Use SSMT divergences and DFR Fibs to anticipate a reversal
Compare against other assets (e.g., DXY or correlated pairs) to refine confluence.
Enable "Show Weekends" for Crypto.
⚠️ Disclaimer: This tool is for educational purposes only. It does not constitute financial advice. Always perform your own analysis and risk management.

RF True Structure Engine PROD. V1RF True Structure Engine V1 is a fractal–based market structure indicator that identifies the current active swing leg and bias in real time. It automatically tracks Strong/Weak Highs and Lows, marks MSS (Market Structure Shifts) and BOS (Breaks of Structure) using candle-close confirmation, and plots clean right-side structure levels with an optional midline for quick leg context.
It also includes an optional HTF structure overlay and a compact multi-timeframe bias table (up to 5 timeframes) so you can instantly see whether higher/lower timeframes are bullish or bearish.
Built for clarity and consistency — structure first, noise filtered out.

Midnight Opening RangeScript to find the Midnight Opening Range.
This script is to find the Fibonacci levels authored by ICT himself in the 2025 Mentorship. If the Fib levels and prices are inside the line you will need to increase the offset to your liking.
Make sure you check on that before saying is not working
Customizable Macro If you’re strategy relies on time then this indicator allows you to customize specific time windows to show so you no longer have to manually keep track of the time.
ICT MTF FVG BPR Toolkit [D4A}The ICT MTF FVG BPR Toolkit encompasses the following 5 components:
- Fair Value Gaps - current timeframe
- Fair Value Gaps - higher timeframe
- BPR - Balanced Price Range
- Long Wicks - which are considered to be gaps by ICT
- Immediate Rebalance - it leaves no gaps, but is as important in assessing current workflow
This is advanced Fair Value Gaps script that uses trading methodology taught by ICT trader. To use it effectively it requires at least some basic knowledge of Smart Money Concepts (SMC) as outlined in ICT's lectures found on YT. I may publish another SMC related scripts in future if this kind of tool is useful to anybody.
The idea behind this work, is to have all the necessary tools related to Fair Value Gaps in one script that is easy to use (requires SMC knowledge), fully customizable and will keep the chart as clutter free as possible. Since, I could not find a ready-made script which would tick all my requirements, I created this new script, partially by borrowing some ideas and code from existing open source projects that I liked. Rather than re-inventing the wheel, I focused on adopting and improving existing solutions and have them work together in one tool that could present the information accurately and in a polished way, where the trader can customize almost everything. Full credit goes to other coders, who tackled this subject before me, but particularly to:
QuantVue
LuxAlgo
pmk07
The script have these unique features:
- Can present FVGs from up to 3 different timeframes at any given interval
- The amount and interval of higher timeframe FVGs is fully customizable
- FVGs can be displayed based on size
- Volume Imbalance can be included as part of FVG (as recommended by ICT)
- Higher timeframe FVGs can have quadrants displayed along with C.E. (based on ATR filter)
- Both current and higher timeframe FVGs can be displayed in different ways depending on price interactions
- BPR which works on current timeframe only
- Long Wick detection logic has been slightly changed from the original LuxAlgo code
- Immediate Rebalance code has been simplified and re-focused on clarity
-----------------
Disclaimer
The information contained in my Scripts/Indicators/Ideas/Algos/Systems does not constitute financial advice or a solicitation to buy or sell any securities of any type. I will not accept liability for any loss or damage, including without limitation any loss of profit, which may arise directly or indirectly from the use of or reliance on such information.
All investments involve risk, and the past performance of a security, industry, sector, market, financial product, trading strategy, backtest, or individual's trading does not guarantee future results or returns. Investors are fully responsible for any investment decisions they make. Such decisions should be based solely on an evaluation of their financial circumstances, investment objectives, risk tolerance, and liquidity needs.
My Scripts/Indicators/Ideas/Algos/Systems are only for educational purposes!

FVG BOS SMC Liquidity Analyzer - Ambrosia-Prime - Basic v1.0# 📘 USER GUIDE
# FVG BOS Volume Volatility Entry/TP/SL Liquidity Analyzer
## 🆓 FREE Basic v1.0 | by Ambrosia-Prime
---
## 📋 TABLE OF CONTENTS
1. (#what-is-this-indicator)
2. (#settings-explained)
3. (#understanding-the-tables)
4. (#your-first-trade)
5. (#free-vs-premium)
6. (#faq)
---
## 🎯 WHAT IS THIS INDICATOR?
The **FVG Analyzer** is a professional trading tool based on **Smart Money Concepts (SMC)** and **ICT strategies**. It automatically detects:
✅ **Fair Value Gaps (FVG)** - Market imbalances
✅ **Break of Structure (BOS)** - Trend confirmations
✅ **Multi-Timeframe Analysis** - 4H, 1H, 15m, 5m, 1m
✅ **Entry, Stop-Loss & Take-Profit** - Automatic level calculation
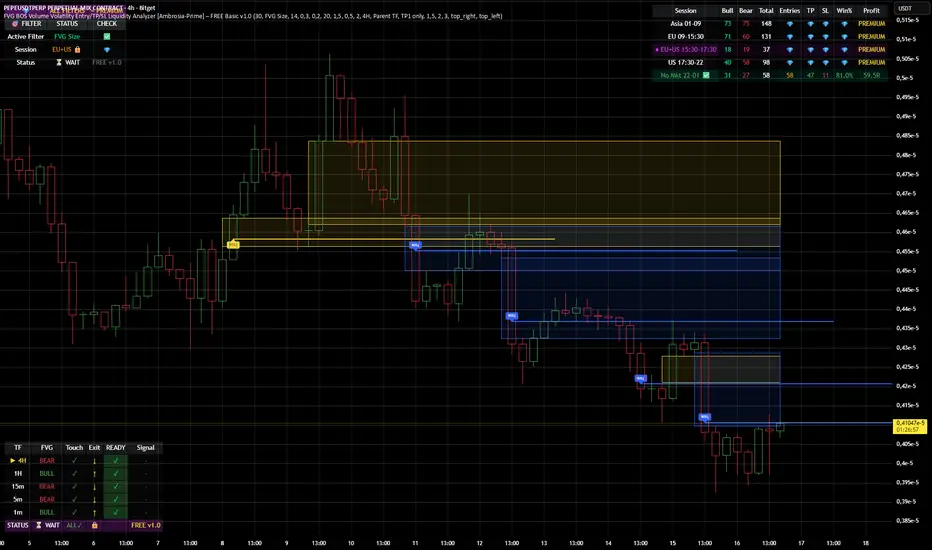
### The Debug Table shows you everything:
| TF | FVG | Touch | Exit | READY | Signal |
|-----|------|-------|------|-------|--------|
| ► 4H| BULL | ✓ | ↑ | ✓ | LONG |
| 1H | BULL | ✓ | ↑ | ✓ | LONG |
| 15m | BULL | ✓ | ↑ | ✓ | LONG |
When all timeframes show **READY** → **ENTRY SIGNAL!**
---
## ⚙️ SETTINGS EXPLAINED
### 👁 DISPLAY SETTINGS
| Setting | Description |
|---------|-------------|
| Show Bullish FVG | Display yellow FVG boxes |
| Show Bearish FVG | Display blue FVG boxes |
| Show BOS lines | Break of Structure lines |
| Show Session Stats | Statistics table (top right) |
| Show Debug Table | Cascade status (bottom left) |
| Show Entry/SL/TP | Entry lines on signals |
### 🎯 BASIC FILTER (Choose ONE)
In the **FREE Version** you can only activate **1 filter** at a time:
| Filter | What it does |
|--------|--------------|
| **None** | No filter active |
| **FVG Size** | Only FVGs larger than X × ATR |
| **Volume** | Only on above-average volume |
| **Volatility** | Only on normal volatility (not too wild) |
| **BOS only with FVG** | BOS only when open FVG exists |
| **Fill Delete** | FVG disappears when completely filled |
> 💎 **PREMIUM:** Use all 15+ filters simultaneously!
### 🔄 TOUCH + EXIT CASCADE
| Setting | Options | Recommendation |
|---------|---------|----------------|
| Cascade Parent TF | 4H, 1H, 15m | **4H** for Swing |
| Confirm EXIT by WICK | ON/OFF | **ON** for more signals |
| Entry Trigger Level | Lowest/Middle/Parent | **Parent TF** |
| Require ALL TFs | ON/OFF | **ON** for quality |
### 📊 TP SETTINGS
| Setting | Description |
|---------|-------------|
| TP Mode | TP1 only / TP1+TP2 / TP1+TP2+TP3 |
| TP1 Risk:Reward | e.g. 1.5 = 1.5× your risk |
| TP2 Multiplier | e.g. 2.0 = 2× TP1 |
| TP3 Multiplier | e.g. 3.0 = 3× TP1 |
---
## 📈 UNDERSTANDING THE TABLES
### 📍 Filter Status (Top Left)
```
┌─────────────────────────────────────┐
│ 💎 │ ALL FILTERS │ = PREMIUM │
├─────────────────────────────────────┤
│ Active Filter │ FVG Size │ ✅ │
│ Session │ EU 🔒 │ 💎 │
│ Status │ ⏳ WAIT │FREE v1.0│
└─────────────────────────────────────┘
```
- **Active Filter:** Your selected filter
- **Session:** Current trading session
- 🔒 = Locked (PREMIUM only)
- ✅ = Unlocked (No Market 22-01 CET)
- **Status:** WAIT / 🟢 LONG / 🔴 SHORT
### 📊 Session Stats (Top Right)
```
┌──────────────────────────────────────────────────────────┐
│ Session │Bull│Bear│Total│Entries│TP│SL│Win%│Profit│
├──────────────────────────────────────────────────────────┤
│ Asia 01-09 │173 │161 │ 334 │ 💎 │💎│💎│ 💎 │PREMIUM│
│ EU 09-15:30 │131 │146 │ 277 │ 💎 │💎│💎│ 💎 │PREMIUM│
│ EU+US 15:30-17:30│ 37 │ 42 │ 79 │ 💎 │💎│💎│ 💎 │PREMIUM│
│ US 17:30-22 │ 95 │106 │ 201 │ 💎 │💎│💎│ 💎 │PREMIUM│
│ No Mkt 22-01 ✅ │ 42 │ 52 │ 94 │ 14 │14│ 0│100%│ 9.8R │
└──────────────────────────────────────────────────────────┘
```
**In FREE you see:**
- ✅ Bull/Bear/Total FVGs for **ALL** sessions
- ✅ Complete stats only for **No Market (22-01 CET)**
- 💎 Other sessions = **PREMIUM**
### 🔍 Debug Table (Bottom Left)
Shows the **live status** of the cascade:
| Symbol | Meaning |
|--------|---------|
| ► | Parent timeframe (selected) |
| BULL/BEAR | FVG direction |
| ✓ (Touch) | Price touched the zone |
| ↑/↓ (Exit) | Price exited the zone |
| ✓ (READY) | Timeframe is ready |
| LONG/SHORT | Signal direction |
---
## 🚀 YOUR FIRST TRADE
### Preface - Why this Indicator is Different
This indicator can filter so **aggressively** that you receive few or almost no signals. **That was exactly my goal!**
I don't need 500 entries per day staring at a chart all day long.
**I only need 1-3 signals per day - and they should work.**
That was the goal. Quality over quantity.
---
### Step-by-Step Guide:
**1. Create a Watchlist**
- Create a watchlist in TradingView
- Add as many charts as your account allows
- Add the indicator to all charts
**2. Set up Alerts**
- Go to the **4H chart**
- Set up the alert:
- **FREE:** Only "No Market" session (22-01 CET)
- **PREMIUM:** All sessions available
- Select "Any Entry Signal"
**3. React to Alert Signal**
- When an alert comes → Switch to the chart
- Check the **Session Stats Table** (top right)
- There you see: Entry, TP, SL, Win%, Profit
**4. Optimize Entry**
- Open the **Settings** (gear icon)
- Adjust the **TP** until you win all trades
- *(Sometimes profit is higher when you lose one trade but have a higher TP)*
- When you've found the best profit result:
- **Take the set TP minus 10-20%**
- *(We don't want to be greedy, but we want to win!)*
**5. Manage Trade**
- The **SL price** is already provided
- The **TP price** adjusts to your settings
- Set your trade accordingly
**6. Done!**
- Start the trade
- Wait for the next signal on another chart
- Repeat!
---
### ⚠️ Important Note
> Remember: A trade can always hit SL!
> Only trade with money you can afford to lose.
>
> I wish you great success and let me know how successful you were.
> **I will read every comment and answer to the best of my ability.**
---
## 💎 FREE vs PREMIUM
### *Coming soon - Currently in Release Testing*
### What you get with FREE:
| Feature | FREE 🆓 |
|---------|---------|
| FVG Detection (all TFs) | ✅ |
| BOS Detection | ✅ |
| Cascade Logic | ✅ |
| Debug Table | ✅ |
| Session Stats Table | ✅ |
| Entry/SL/TP Lines | ✅ |
| Filters | **1 at a time** |
| Trading Sessions | **Only No Market (22-01)** |
| Alerts | **Only No Market** |
### What you get with PREMIUM:
| Feature | PREMIUM 💎 |
|---------|------------|
| Everything from FREE | ✅ |
| **15+ filters simultaneously** | ✅ |
| **All sessions unlocked** | ✅ |
| → Asia (01-09) | ✅ |
| → EU (09-15:30) | ✅ |
| → EU+US Overlap (15:30-17:30) | ✅ |
| → US (17:30-22) | ✅ |
| **Alerts for all sessions** | ✅ |
| **Session-based TP optimization** | ✅ |
| **HTF Zone Confluence Filter** | ✅ |
| **Structure Filter (HH/HL/LH/LL)** | ✅ |
| **RR Filter** | ✅ |
| **Trend EMA Filter** | ✅ |
| **Candle Quality Filter** | ✅ |
| **Cooldown Filter** | ✅ |
| **FVG Age Filter** | ✅ |
### 🚀 PREMIUM EDITION (Exclusive!)
The Premium version has **two different entry logics** - that's why the testing phase is still ongoing.
Finds setups with **10-100% potential!**
---
## ❓ FAQ
### "Why don't I see any entries?"
**Possible reasons:**
1. **Wrong session:** FREE only works 22:00 - 01:00 CET
2. **Cascade not READY:** All TFs must show ✓
3. **Filter blocking:** Check your active filter
4. **Already in trade:** "Single Trade" allows only 1 trade
### "What do the colors mean?"
| Color | Meaning |
|-------|---------|
| 🟡 Yellow | Bullish FVG / Entry line |
| 🔵 Blue | Bearish FVG |
| 🟢 Green | TP line / Positive |
| 🔴 Red | SL line / Negative |
| 🟣 Purple | EU+US Overlap Session |
### "Which timeframe should I use?"
| Your Style | Chart TF | Cascade Parent |
|------------|----------|----------------|
| Scalping | 1m - 5m | 15m |
| Daytrading | 5m - 15m | 1H |
| Swing | 15m - 1H | 4H |
### "Can I change the sessions?"
- **FREE:** No, only No Market (22-01) is available.
- **PREMIUM:** Yes, all sessions + session-based TP values!
---
## 📞 WANT MORE?
### Unlock PREMIUM:
- ✅ All Sessions
- ✅ All Filters
- ✅ 2 Entry Logics
- ✅ Priority Support
### Contact & Support:
📊 **TradingView:** (www.tradingview.com)
---
## 📜 CHANGELOG
### v1.0 FREE (December 2024)
- Initial Release
- Multi-TF FVG Detection
- BOS Detection
- Cascade Logic
- 1 Filter (Dropdown)
- No Market Session (22-01)
- Session Statistics
- Debug Table
---
## ⚠️ DISCLAIMER
This indicator is an **analysis tool** and not financial advice.
Trading involves risks. Past results do not guarantee future profits.
Only trade with capital you can afford to lose.
---
**Good luck with your trading! 🚀**
*Your Ambrosia-Prime*
---
*© 2024 Ambrosia-Prime. All rights reserved.*
Intermarket SSMT Table [Pogiest]General
Intermarket Sequential Smart Money Technique (IMSSMT) is a Quarterly Theory concept that identifies divergences (extreme highs/lows) when comparing different market triads to another market triad in two consecutive quarters.
SSMT involves identifying divergences in a correlated asset triad that occurs consecutively from the previous quarter to the current quarter to predict new phases of price, a shift in market sentiment, and also potential trend reversals. An SSMT divergence occurs when one or two assets makes a new high or low, but the other asset or assets does not, signaling a potential shift in market direction. A Hidden SSMT Divergence occurs when one or two assets’ closing price closes higher or lower than the other one or two assets’ closing price. However, with potential gaps in price, an opening price can also be the extreme when comparing assets for divergences. Hidden SSMT divergence compares the candle bodies while a Standard SSMT divergence compares the highs and lows. Both types of SSMTs are considered to be cracks in correlation and can be used to identify potential new phases of price whether it be a reversal, retracement, consolidation, and continuation.
Credit of concepts/ideas: ICT & TraderDaye
What Makes This Indicator Unique
The indicator table is designed to be used on any symbol the trader is viewing. For example, the indicator is shown on an NQ chart while selecting three symbols in the Forex triad in settings. The indicator will request the separate data from the symbols selected and display the data within the table. The table does not rely on data on the chart being viewed. Instead of switching charts, the table is used to track other market triads for SSMTs (standard & hidden) while viewing other markets simultaneously.
The indicator has the ability to display Standard SSMTs, Hidden SSMTs, or both simultaneously in real-time, tick by tick in the time period selected in a correlated asset triad within the table. Toggle modes for each type of SSMT will run independently (runs when enabled) and therefore, optimizes performance. The user is able to select three different tickers in settings instead of limiting to pairs. In addition, the indicator has “Invert” toggle options to track both Standard and Hidden SSMTs for assets with negative correlations.
How the Indicator Table Works
The indicator functions to track any divergences from the previous quarter to the current quarter. In addition, the indicator tracks the current status even when there are no divergences (see phase column below).
Timeframe Column:
1. Displays up to two different timeframes to monitor.
Asset Columns:
1. Display up to three different assets to monitor.
2. Cells display “Bull” in green background color or “Bear” in red background color showing the current state of each candle and updates in real-time tick by tick.
Phase Column:
Displays the current status from the previous quarter to the current quarter. The status updates in real-time tick by tick.
1. “F/S” indicates there are no current SSMT divergences between the previous quarter to the current quarter and all assets have not swept the previous quarter, a “failure swing”.
2. “HH” is displayed when all assets have swept the previous quarter’s extreme high. (Higher High)
3. “LL” is displayed when all assets have swept the previous quarter’s extreme low. (Lower Low) See screenshot with drawings below.
4. SSMT indicates there is an SSMT from the previous quarter to the current quarter. Red background is a bearish SSMT (divergence at the highs) or green background is a bullish SSMT (divergence at the lows). If the SSMT becomes invalid (i.e. the last asset sweeps the extreme high/low), then the table will update to display either “HH” or “LL” depending on the extreme it swept. See screenshot with drawings below.
5. “Both” indicates there are SSMT divergences at both the extremes highs and lows. If an SSMT on one side gets deleted, then the cell will automatically update to display the SSMT that is still intact. See screenshot with drawings below.
Invert Toggle Option:
When this setting is turned on, the asset column cells will display the inverted color of the live chart to show assets are in-sync. It will track the inverted swing points for SSMTs, higher highs, lower lows, etc. For example, if EUR and GBP are making lower highs, while DXY (Inverted toggle on), makes a lower low on the actual live chart, it will display “SSMT”.
NOTE:
Scanning function per timeframe to detect SSMTs:
Weekly HTF: Scans 4HR bars
Daily HTF: Scans 1HR bars
6HR/4HR HTF: Scans 15m bars
1HR HTF: Scans 5m bars
5m HTF: Scans 1m bars
The script has fixed lookback periods for bars to ensure the appropriate data is being captured. The higher the timeframe the user selects in settings while viewing on an extremely lower timeframe, the indicator may give inaccurate readings:
Recommended Chart Timeframes:
For best performance and accuracy, view your chart on a timeframe close to or lower than the scan timeframe:
Weekly HTF → View on 1H-4H chart
Daily HTF → View on 1H-4H chart
6HR/4HR HTF → View on 5m-15m chart
90M HTF → View on 3m-15m chart
1H HTF → View on 1m-15m chart
The indicator will attempt to scan further back if needed, but extremely low chart timeframes (e.g., 1m) with high HTF (e.g., Weekly) may still have limitations.
In addition, the indicator bases the SSMT off the previous quarter’s time range to the current quarter’s time range. If there are discrepancies in the time ranges (start to end of higher timeframe period selected), the SSMTs may display differently than what is viewed on the chart. For example, indices open at 18:00 est on a new trading day, so the time ranges matches throughout the day. However, in Forex, EUR and GBP opens at 17:00 est while DXY opens later, so the time ranges may be off (i.e. 6 hour timeframe). For best use, select time periods that matches throughout the day.
Usage
Traders can use both types of SSMT divergences to anticipate potential reversals in points of interest such as higher timeframe swing points, supply/demand zones, higher timeframe imbalances, key levels, etc. This indicator can also be beneficial in identifying cracks in correlation via Hidden SSMT when there are no divergences off the highs and lows. Divergences can come in different forms relating to Intermarket SSMT. For example, if one market triad is all making lower lows while the other market triad is making higher highs, this can be deemed a divergence between the two markets. Another example would be one market triad all makes lower lows while another market triad makes a bullish SSMT. This can potentially signal a bullish move up. SSMT divergences (standard and hidden) can be used as a confirmation tool with other confluences to identify trend direction with respect to points of interest, higher timeframe order-flow, lower timeframe order-flow, etc. In addition, having both a Standard SSMT and Hidden SSMT divergence display could potentially signal a reversal. It is up to the trader to gauge the price action at the time.
Settings
1. Choose up to three different assets to monitor.
Note: If only two are selected, the indicator will only display the two selected and compare the two assets for divergences. If one is selected, a warning sign will be displayed to select at least two assets.
2. Choose up to two different timeframes. Option to deselect timeframes.
3. Enable/disable standard or hidden SSMT.
4. Option to enable alerts. Alerts include the different phases in the table (i.e. SSMT, HH, LL, and Dual SSMT [both standard & hidden) for each timeframe.
5. Toggle option to show/hide the table. Toggle option to show/hide the “Title Row” which is the first row at the top of the table.
6. Adjust the table positioning to be displayed on the chart.
7. Option to change text size in the table cells. This will also increase/decrease the size of the table.
Risk Disclaimer
This indicator is for educational and informational purposes only and does not constitute financial advice. All trading and investment decisions remain solely the responsibility of the user.
Trading involves a high degree of risk, and past performance is not indicative of future results.
Always conduct your own research and consult with a qualified financial professional before making any trading decisions.
By using this indicator, users acknowledge they understand these risks and accept full responsibility for their trading decisions and outcomes.

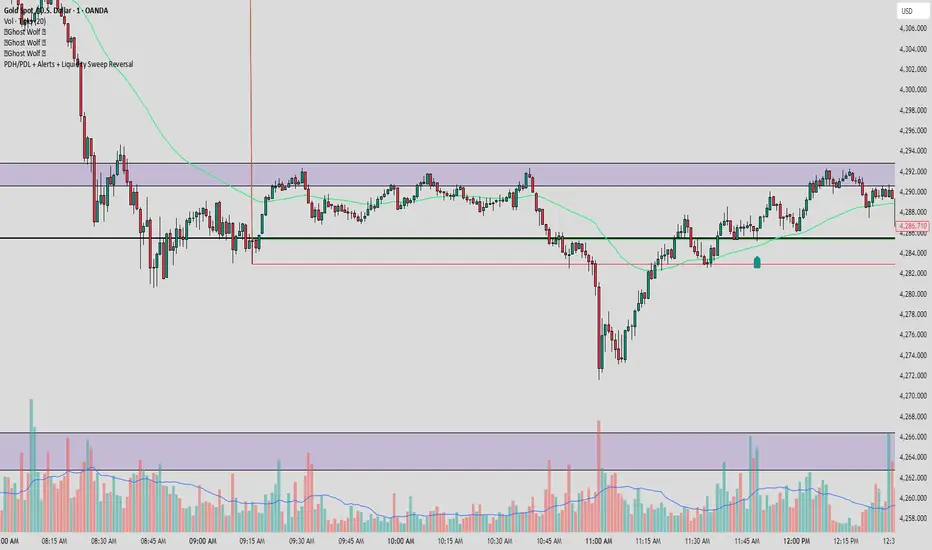
PDH/PDL + Alerts + Liquidity Sweep ReversalThis indicator is designed for traders who utilize Price Action to identify high-probability reversal zones at daily liquidity levels. It automatically plots the Previous Day High (PDH) and Previous Day Low (PDL) and monitors them for institutional "fake-outs" or liquidity sweeps.
Core Functionality
Daily Liquidity Levels: Automatically fetches and plots the PDH and PDL with custom labels and line styles.
Strict Reversal Logic: Unlike standard breakout indicators, this script looks for specific "trap" behavior where price pierces a level and is immediately rejected.
Institutional Precision Tooltips: Includes built-in precision guides for Wick Percentages and Lookback counts based on professional trading standards.
The "Strict Reversal" Setup
The indicator only triggers a Buy/Sell label when three specific criteria are met:
The Lookback: The level must have been respected as a boundary for a user-defined number of candles (Default: 7), confirming its strength.
The Sequence: The candle must open on the "safe" side of the level, pierce through it to grab liquidity, and then close back on the original side.
The Rejection (Wick %): The candle must leave a significant wick (Default: 72%). This 72% threshold aligns with the 2.5x Wick-to-Body ratio, signaling a violent institutional rejection.
Alert Options
The script features four consolidated alert conditions for seamless automation:
Sell Signal (Rejection): Triggers on strict bearish wick sweeps at key levels.
Buy Signal (Rejection): Triggers on strict bullish wick sweeps at key levels.
Price Cross Up: Alerts when price breaks above either PDH or PDL.
Price Cross Down: Alerts when price breaks below either PDH or PDL.
How to Use
Scalping: Use a 3–5 candle lookback on the 1m or 5m timeframe.
Intraday Reversals: Use the 7–10 candle lookback on the 5m or 15m timeframe for standard SMC setups.
Swing Trading: Use the 15+ candle lookback on the 1h or 4h timeframe to target major daily liquidity pools.
CRT+ Advance Engulfing | @stefandimovCRT+ Lite implements institutional-style Candle Range Theory logic to identify displacement-driven engulfing structures with precision.
The script focuses on wick-based liquidity grabs, strict body closes, and optional higher-timeframe confirmation to highlight structurally valid bullish and bearish reversals.
Includes a Daily-only multi-market scanner and a compact dashboard for fast top-down analysis.
Designed for traders who prioritize structure, execution precision, and HTF alignment.

Auction Imbalance And Rebalance IndicatorThis indicator marks areas of Internal Range Liquidity along with Ecternal Range Liquidity

SmartMoney BOS Pro [Stansbooth]
## ✨ BOS + ICT RSI Indicator — Trade Like Smart Money ✨
The market doesn’t move randomly — it moves with **structure**, **liquidity**, and **institutional intent**.
This indicator is built to help you see exactly that.
Powered by **Break of Structure (BOS)** and advanced **ICT concepts**, this tool highlights when the market is truly shifting direction or continuing with strength — the same way **smart money** trades.
To make every setup even stronger, a **smart RSI confirmation** is seamlessly integrated, helping you stay out of weak trades and focus only on **high-quality, high-probability opportunities**.
### 🔥
What Makes It Special?
• Clear and accurate BOS signals
• ICT-based market structure & liquidity insight
• RSI confirmation to reduce false entries
• Clean visuals — no clutter, no confusion
• Designed for scalpers, intraday & swing traders
🎯
Who Is This For?
If you’re tired of lagging indicators…
If you want to understand **why** price moves…
If you want to trade with confidence instead of guessing…
This indicator is for you.
📊
Markets Supported:
Forex • Crypto • Stocks • Indices
Stop chasing price.
Start trading ** structure, liquidity, and smart money**.
🚀 **See the market differently. Trade better.**
Previous Time Based Dealing Ranges [Pro +] | cephxsPrevious Time Based Dealing Ranges 🧪
Visualize previous and current higher timeframe dealing ranges with dual-box OHLC representation, extending reference lines, and HTF candle displays.
OVERVIEW
This indicator displays time-based dealing ranges from higher timeframes directly on your chart. It shows the complete price action structure of previous (or current/forming) periods using a dual-box system: one box for the full High-Low range and another for the Open-Close body. Reference lines extend from key levels to help identify potential support, resistance, and mean reversion zones.
Perfect for traders who use ICT concepts, market structure analysis, or any methodology that relies on understanding where price has been relative to previous dealing ranges.
KEY FEATURES
Dual-Box Range Visualization: Each range displays two boxes - the full H-L range (outer) and the O-C body (inner) - giving immediate visual context of candle structure
Multiple Timeframes: Support for 4H, 6H, 1D, 1W, 1M, and 3M ranges
Previous/Current Mode: View completed ranges (Previous) or the forming range (Current) with real-time updates
Auto Mode: Automatically selects the appropriate range based on your chart timeframe
Reference Lines: Extending lines from High, Mid, Low (or Quadrants: H/75/M/25/L) with trade-into detection
HTF Candle Display: Visual HTF candles positioned to the right of price for context
6H Session Support: Session-aware ranges for Asia, London, NY AM, and NY PM with labeled names
Open Line: Vertical line marking the range's opening price/time
Imbalance Detection: Fair Value Gaps and Volume Imbalances highlighted on HTF candles
MODE OPTIONS
Previous/Current: Previous shows the last completed range. Current shows the forming range with dynamic H/L/C updates
Auto/Manual: Auto selects range by chart TF. Manual lets you choose specific ranges
Extend Box (Current): In Current mode, extends the box's right edge as price develops
AUTO MODE TIMEFRAME LOGIC
Chart < 15m → 6H Range
Chart 15m-1H → 1D Range
Chart 1H-6H → 1W Range
Chart 6H-1D → 1M Range
Chart > 1D → 3M Range
INPUTS
Mode
Mode: Previous/Current - Choose completed or forming range
Auto/Manual: Auto selects range by chart TF, Manual lets you choose
Extend Box (Current): Extends box right edge with price (Current mode only)
Previous Ranges
Range 1: Enable/disable, select timeframe (4H/6H/1D/1W/1M/3M), max display count
Range 2: Second range layer for multi-timeframe analysis
Reference Lines
Line Mode: Levels (H/M/L) or Quadrants (H/75/M/25/L)
Line Style: Solid, dashed, or dotted
Line Thickness: 1-4 pixels
Show Labels: Toggle reference line labels
Label Offset: Distance of labels from current price (1-20 bars)
HTF Candle Levels: Show mini H/M/L lines on HTF candles
Open Line: Vertical line at range open with customizable style
Range Boxes & Colors
Show Range Boxes: Toggle box visibility (lines remain visible)
Per-Range Colors: Customize box and line colors for each timeframe (4H, 6H, 1D, 1W, 1M, 3M)
HTF Candle Styling
Show HTF Candles: Toggle HTF candle display
Body/Border/Wick Colors: Customize bull and bear candle appearance
Padding/Buffer/Width: Control candle spacing and size
Labels
HTF Label: Show timeframe label above/below candles
Remaining Time: Countdown timer to candle close
Label Position: Top, Bottom, or Both
Label Alignment: Align across timeframes or follow individual candles
Imbalance
Fair Value Gap: Highlight FVGs on HTF candles
Volume Imbalance: Highlight VIs on HTF candles
HOW TO USE
Add the indicator to your chart
Choose Previous or Current mode based on your analysis preference
Use Auto mode for intelligent range selection, or Manual to select specific timeframes
Reference lines extend from range levels - watch for price reactions at H/M/L
In Current mode, observe how the range develops with real-time updates
Use the HTF candles on the right for quick multi-timeframe context
REFERENCE LINE LABELS
Labels follow this format:
Previous mode: pD-H (previous Daily High), pW-M (previous Weekly Mid), p6H-London-L (previous 6H London Low)
Current mode: D-H (Daily High), W-M (Weekly Mid), 6H-Asia-L (6H Asia Low)
6H SESSION NAMES
Asia: 18:00-00:00 ET
London: 00:00-06:00 ET
NYAM: 06:00-12:00 ET
NYPM: 12:00-18:00 ET
RECOMMENDED TIMEFRAMES
1-5 minute charts: 6H or 1D ranges
15-60 minute charts: 1D or 1W ranges
4H charts: 1W or 1M ranges
Daily charts: 1M or 3M ranges
Or simply use Auto mode to let the indicator choose the optimal range.
TIPS
The Mid (M) level often acts as equilibrium - watch for mean reversion plays
High and Low levels are more often than not, key to reversals
In Current mode, watch how price interacts with the forming range boundaries
Combine with your existing analysis for confluence
DISCLAIMER
This indicator is for educational and informational purposes only.
Past performance does not guarantee future results.
Always use proper risk management and never risk more than you can afford to lose.
Trading involves substantial risk of loss and is not suitable for all investors.
CREDITS
Original Base HTF candle Plotting Logic by fadizeidan. Put on Steroids by cephxs & fstarcapital.
CHANGELOG
Pro + v1.0: Added Previous/Current mode, 4H range, dual-box visualization, reference lines with trade-into detection, session-aware 6H labels, open line, Auto mode with intelligent TF selection

Ghost Scalp Protocol By [@Ash_TheTrader]
# 👻 GHOST SCALP PROTOCOL
### 💀 Stop Getting Trapped. Start Tracking the Banks.
Most retail traders lose because they enter exactly where institutions are exiting. They get caught in **"Stop Hunts"** and **"Fake-Outs."**
The **Ghost Scalp Protocol** is not just an indicator; it is a complete institutional trading system designed for **M1 & M5 Scalpers**. It combines **Smart Money Concepts (SMC)** with a **Physics-Based Momentum Engine ($p=mv$)** to detect high-probability reversals.
---
### ⚛️ THE LOGIC: 3-STAGE CONFIRMATION
This algorithm does not rely on lagging indicators. It uses a 3-step "Protocol" to validate every trade:
**1. THE GHOST TRAP (Liquidity Sweeps)**
* The script automatically draws "Ghost Lines" at key Swing Highs/Lows where retail Stop Losses are hiding.
* It waits for price to **sweep** these levels (Stop Hunt).
* **The Signal:** A Neon **Skull (☠️)** appears *only* if price aggressively rejects the level with high volume. This is the "Turtle Soup" pattern.
**2. THE PHYSICS ENGINE ($p = mv$)**
* Momentum is not just price speed; it is **Mass (Volume) x Velocity (Range)**.
* The dashboard calculates the "Force" of every candle.
* **The Signal:** An **Arrow (⬆/⬇)** appears when momentum surges **5x** above the average. This confirms the banks are pushing the move.
**3. BANK BIAS (Elasticity Filter)**
* Markets move like a rubber band.
* The script calculates a hidden "Fair Value" baseline.
* It creates a **Bias**: It only looks for Shorts in **PREMIUM (Shorting)** zones and Longs in **DISCOUNT (Accumulating)** zones.
---
### 📊 THE SMART DASHBOARD (HUD)
A futuristic, non-intrusive Heads-Up Display keeps you focused on the data that matters:
* **🏦 BANK BIAS:** Tells you if Institutions are likely **Accumulating** or **Shorting**.
* **📈 HTF TREND:** Automatically checks the **1-Hour Trend**. Don't fight the tide.
* **🚀 MOMENTUM:** Real-time Physics calculation.
* **Green Text:** Acceleration (Move is getting stronger).
* **Red Text:** Deceleration (Move is dying).
* **🌍 SESSION:** Shows active Bank Sessions (Tokyo, London, NY).
* **⚠️ OVERLAP ALERT:** Flashes GOLD when London & New York are open simultaneously (Peak Volatility).
---
### 🔥 STRATEGY: HOW TO TRADE
Use this checklist to execute high-probability scalps:
#### 📉 SHORT SETUP (SELL)
1. **Liquidity:** Wait for price to break above a **Red Ghost Line** (Sweep Highs).
2. **Signal:** Wait for the **Pink Skull ☠️** (Trap Detected).
3. **Confluence:**
* Dashboard Bias says: **"SHORTING"**
* HTF Trend says: **"BEARISH 📉"** (Optional but recommended).
4. **Entry:** On the Close of the Skull candle.
5. **Stop Loss:** Just above the wick swing high.
#### 📈 LONG SETUP (BUY)
1. **Liquidity:** Wait for price to break below a **Blue Ghost Line** (Sweep Lows).
2. **Signal:** Wait for the **Blue Skull ☠️** (Trap Detected).
3. **Confluence:**
* Dashboard Bias says: **"ACCUMULATING"**
* HTF Trend says: **"BULLISH 📈"** (Optional but recommended).
4. **Entry:** On the Close of the Skull candle.
5. **Stop Loss:** Just below the wick swing low.
---
### 🏆 RECOMMENDED PAIRS & TIMEFRAMES
* **⚡ Best Timeframes:**
* **1 Minute (M1):** For aggressive "Sniper" entries (High Frequency).
* **5 Minute (M5):** The "Gold Standard" for balanced Scalping.
* **15 Minute (M15):** Safer, higher win-rate Day Trading.
* **💎 Best Assets:**
* **Gold (XAUUSD):** Highly effective on liquidity sweeps.
* **Indices:** US100 (Nasdaq), US30 (Dow Jones).
* **Crypto:** BTCUSD, ETHUSD (High volatility).
* **Forex:** GBPUSD, EURUSD (London/NY Session).
---
### 🛠️ SETTINGS & CUSTOMIZATION
* **Surge Factor:** Default is **5.0x**. Lower this to 3.0 if you want more aggressive Momentum Arrows.
* **Smart Sessions:** Automatically converts to **New York Time** (EST) regardless of your location. No more time zone math.
* **Visuals:** Designed with "Ghost Glow" technology—97% transparent backgrounds that look classy and don't clutter your chart.
---
**"The Ghost Algo sees what you can't."**
*Trade Safe. Trade Smart.*
**~ Ash_TheTrader**

RMI Valid FVG & IFVGRMI • Valid FVG & iFVG (Smart Money Concept)
RMI • Valid FVG & iFVG is a precision-focused Fair Value Gap indicator designed for traders who follow Smart Money Concepts (SMC) / ICT logic and want to filter out low-quality, random gaps.
This indicator does not plot every FVG.
It highlights only structurally relevant FVGs that form in the direction of the trend and have a high probability of being filled.
Core Features
Bullish & Bearish Fair Value Gaps
Inverse Fair Value Gaps (iFVG)
Trend-aligned FVG filtering
Automatic invalidation after mitigation
Clean background zones for clear visibility
Optimized for intraday trading
Adjustable settings for scalping, intraday & swing trading
Smart Filtering Logic
FVGs are validated using market structure context
Only FVGs that form within the active trend are displayed
Weak or low-probability gaps are ignored
Inverse FVGs appear after strong displacement and rejection
Zones are visually faded once mitigated
This helps reduce chart noise and keeps the focus on high-probability reaction zones.
Best Use Cases
Entry refinement after BOS / CHoCH
Confluence with liquidity grabs
Premium / discount zone trading
Intraday & session-based trading
Works well with ICT, SMC, price action & structure-based strategies
Recommended Timeframes
Scalping: M1 – M5
Intraday (default): M5 – M15
Swing Trading: M15 – H1
(Default settings are optimized for intraday trading.)
Important Notes
This is not a signal indicator
No repainting
No buy/sell arrows
Designed as a decision-support tool, not an automated system
Always combine with proper risk management and confirmation.
RMI • Precision over noise.
Trade structure, not randomness.

Ghost Protocol: Smart Money HUD [Ash_TheTrader]👻 GHOST PROTOCOL: The Institutional HUD
"Stop trading blind. Start seeing where the Smart Money is hiding."
Most indicators lag. They tell you what happened. Ghost Protocol tells you what is happening right now by combining two powerful concepts: Volume Absorption (Whale Defense) and Kinematic Physics (Price Velocity).
This is not just an indicator; it is a complete Heads-Up Display (HUD) for scalpers and day traders on NQ, ES, Gold, and Crypto.
🧠 The Concept: Why It Works
Retail traders lose money for two reasons:
Selling into a bottom (where Whales are absorbing orders).
Buying a fake breakout (where price lacks the energy to continue).
Ghost Protocol solves both by visualizing the invisible battle between aggressive orders (Retail) and passive limit orders (Institutions).
🛠️ The 3 Core Features
1. The "Ghost Walls" (Reversal Detector) 🛡️
What it is: Detects when massive volume hits the market but Price fails to progress. This is Absorption. A "Whale" is using a Limit Order Wall to absorb panic selling or FOMO buying.
The Visual:
🟢 Green Ghost Bubble + Beam: Buyers are absorbing sellers. (Bullish Wall).
🔴 Red Ghost Bubble + Beam: Sellers are absorbing buyers. (Bearish Wall).
Sticky Tech: The bubbles "stick" to the wicks perfectly, regardless of zoom level.
2. The "Velocity Terminal" (Breakout Validator) 🚀
What it is: A Physics Engine for price. It calculates Jerk (Change in Acceleration). Standard breakouts often fail, but a breakout with high "Jerk" (Surge) rarely comes back.
The Visual:
🟣 Plasma Purple Candle: Valid Breakout. Price is moving with high physical energy. Safe to follow.
⚪ Grey/Dull Candle: Fakeout. Price broke a level but lacks energy. The move is likely a trap.
3. The Smart Money Dashboard 💻
A sleek, "Classy" panel in the bottom right corner.
Monitors both engines simultaneously:
GHOST WALL: Scans for Reversals (Buy/Sell Walls).
VELOCITY: Scans for Momentum (Surge/Fakeout).
🎯 How to Trade This Script
Strategy A: The "Whale Reversal" (Scalping)
Step 1: Wait for price to push hard into a level.
Step 2 : A Ghost Wall (Ghost Icon 👻) appears.
Step 3 : A vertical Neon Beam lights up the background.
Action: Take the reversal immediately. Place stop loss just behind the bubble.
Strategy B: The "Physics Breakout" (Trend Following)
Step 1: Price breaks a key resistance or support level.
Step 2: Look at the candle color.
If it is Plasma Purple: ENTER. The physics engine confirms true momentum.
If it is Grey: WAIT. It is likely a fakeout designed to trap you.
⚙️ Settings & Customization
Bubble Distance: Adjust how close the Ghost bubbles sit to the candles.
Sensitivity: Tune the "Jerk Threshold" for the physics engine.
Visuals: Toggle the Background Beams, Dashboard size, and Neon colors to fit your dark/light mode setup.
Created by @Ash_TheTrader Trade with the Whales, not against them.
IFVGs [NINE]Overview
The IFVG Indicator is a precision-engineered tool designed to identify and display Inversion Fair Value Gaps (IFVGs), a powerful price action concept rooted in ICT (Inner Circle Trader) methodology. This indicator automatically detects when price closes through an existing Fair Value Gap, causing the zone to "invert" and flip its directional bias, signaling potential areas of institutional interest for future price reactions.
What is an Inversion Fair Value Gap?
A Fair Value Gap (FVG) is a three-candle pattern where a gap exists between the wicks of the first and third candles, representing an imbalance in price delivery. These zones often act as magnets for price to return and "fill" the inefficiency.
An Inversion Fair Value Gap (IFVG) occurs when price doesn't just tap into an FVG, it closes through it with a candle body. This "inversion" transforms the zone:
A Bullish FVG that gets closed through becomes a Bearish IFVG (potential resistance/supply zone)
A Bearish FVG that gets closed through becomes a Bullish IFVG (potential support/demand zone)
IFVGs represent areas where the market has shown its hand — institutional order flow has aggressively moved through a prior inefficiency, and the inverted zone now becomes a point of interest for potential reversals or continuations.
Key Features
Automatic IFVG Detection
The indicator continuously monitors for Fair Value Gaps and automatically converts them to IFVGs when price body closes through the zone. No manual identification required.
Multiple Display Styles
Choose from four distinct visualization modes to match your chart aesthetic:
Level — Clean, minimal single line at the IFVG extreme (top for bullish, bottom for bearish)
Normal — Filled zone with dashed borders and dot label
Minimalist — High/low boundary lines with connecting link
Classic — Filled box with 50% midline only
Full Customization
Independent colors for bullish and bearish IFVGs
Adjustable transparency for zone fills
Optional 50% midline (Consequent Encroachment level)
Flexible label styles: "IFVG" or "+/−" notation
Multiple label sizes: Tiny, Small, Normal, Large
Smart Extension Options
Extend to Current Bar — Zones dynamically extend as price progresses
Extend to Confirmation — Zones end at the bar where inversion occurred
Manual Offset — Fine-tune extension length in bars
Clustered IFVG Filter
Prevents chart clutter by ensuring only one IFVG per direction forms within a 5-bar cooldown period. When a single candle closes through multiple FVGs, only the first IFVG of that directional series is displayed — eliminating redundant signals and keeping your chart clean.
FVG Lookback Control
Limit which FVGs can become IFVGs based on their age. Options include 10, 50, 100, 200, or 300 bars. This filters out old, stale FVGs that may create less relevant inversions.
Session Time Filters
Optional time-based filtering allows you to focus on specific trading sessions:
Configurable session windows (e.g., 9:30 AM - 12:00 PM)
Support for two independent session filters
Multiple timezone options including New York, London, Tokyo, and more
Volume Imbalance Detection
Optionally include Volume Imbalances (VIs) — gaps between candle bodies rather than wicks — expanding the scope of detectable inefficiencies.
Invalidation Tracking
IFVGs are automatically invalidated when price closes back through the zone in the opposite direction, with optional display of invalidated zones.
How to Use
Entry Confirmation
IFVGs serve as areas for trade entries. When price returns to a confirmed IFVG:
Bullish IFVG — Look for long entries as price taps the zone from above
Bearish IFVG — Look for short entries as price taps the zone from below
Settings Reference
Inversion Fair Value Gaps
Show IFVGs? — Master toggle for IFVG display
Style — Level, Normal, Minimalist, or Classic
Transparency % — Zone fill opacity (0-100)
Historical Display — Maximum IFVGs to show per direction
Bullish/Bearish Colors — Independent color selection
Show Invalidated? — Display IFVGs that have been invalidated
Extend IFVGs? — Enable dynamic zone extension
Extension Mode — Current Bar or Confirmation
Manual Offset — Additional bars to extend
High/Low Lines — Show boundary lines (Minimalist style)
50% Midline — Show Consequent Encroachment level
Show Labels? — Display zone labels
Label Style — IFVG or +/− notation
FVG Lookback — Maximum age of FVGs that can invert
Clustered Filter — Prevent multiple same-direction IFVGs in quick succession
Volume Imbalances — Include body gaps in detection
Session Filters
Enable 1st/2nd Time Filter — Activate session filtering
Session Times — Define active trading windows
Timezone — Reference timezone for session calculations
Disclaimer
This indicator is provided for educational and informational purposes only. It is not financial advice, and nothing contained herein constitutes a recommendation, solicitation, or offer to buy or sell any securities, options, or other financial instruments.
Trading involves substantial risk of loss and is not suitable for all investors. Past performance is not indicative of future results. You should carefully consider your investment objectives, level of experience, and risk appetite before making any trading decisions.
The developer of this indicator makes no representations or warranties regarding the accuracy, completeness, or reliability of the information provided. You are solely responsible for your own trading decisions and any profits or losses that may result.
Always conduct your own research and consider seeking advice from a licensed financial professional before trading.

SMT (ICT Concepts)Overview
Smart Money Technique (SMT) Divergence is a price action analysis method derived from Inner Circle Trader (ICT) methodology. This indicator automatically detects SMT divergences by comparing price movements across correlated financial instruments, identifying moments when assets that typically move together begin to diverge - a phenomenon often associated with potential price reversals.
An SMT divergence occurs when one instrument makes a new swing high or low while a correlated instrument fails to confirm that move. This failure to confirm suggests that the instrument may be positioning for a reversal, as the divergence indicates a lack of conviction in the current price direction across related markets.
Theoretical Foundation
What is SMT Divergence?
In correlated markets, instruments tend to move in tandem. For example, the E-mini S&P 500 (ES) and E-mini Nasdaq 100 (NQ) futures typically make swing highs and lows together due to their shared exposure to U.S. equity markets. When this correlation breaks down at key swing points, it creates an SMT divergence.
Bullish SMT Divergence:
The chart instrument creates a lower low compared to a previous swing low, while the correlated comparison instrument creates a higher low (or fails to make a lower low). This divergence at the lows suggests potential buying pressure and a possible bullish reversal.
Bearish SMT Divergence:
The chart instrument creates a higher high compared to a previous swing high, while the correlated comparison instrument creates a lower high (or fails to make a higher high). This divergence at the highs suggests potential selling pressure and a possible bearish reversal.
Why SMT Divergences Matter
SMT divergences are considered significant because they may indicate:
Accumulation or distribution occurring in one instrument but not the other
Relative strength or weakness between correlated assets
Potential exhaustion of the current trend
Early warning signs before major reversals
Indicator Features
Multi-Timeframe SMT Detection
This indicator provides simultaneous SMT detection on two timeframes:
Current Timeframe (CTF) Detection:
The indicator scans for SMT divergences on the chart's active timeframe using multiple pivot lookback periods (3, 5, 8, 13, 21, and 34 bars). This multi-period approach ensures detection of both short-term and intermediate swing points, reducing the likelihood of missing valid divergences while filtering out noise.
Higher Timeframe (HTF) Detection:
Simultaneously, the indicator monitors a higher timeframe for SMT divergences using pivot periods of 3, 5, 8, 13, and 21 HTF candles. Higher timeframe signals generally carry more significance as they represent larger market structure.
Automatic Timeframe Pairing:
When enabled, the indicator automatically selects an appropriate higher timeframe based on your chart's current timeframe:
Sub-1 minute charts pair with 5-minute
1-2 minute charts pair with 15-minute
3-4 minute charts pair with 30-minute
5 minute charts pair with 1-hour
6-9 minute charts pair with 1-hour
15 minute charts pair with 4-hour
16-59 minute charts pair with Daily
1-4 hour charts pair with Weekly
Daily charts pair with Monthly
Combined Signal Detection:
When an SMT divergence is detected on both the current timeframe and higher timeframe at the same price pivots, the indicator combines these into a single enhanced signal. Combined signals display both timeframes in the label and use the higher timeframe styling to emphasize their increased significance.
Automatic Symbol Correlation
The indicator includes comprehensive automatic symbol selection based on the instrument you are viewing. When Auto SMT is enabled, the indicator intelligently selects correlated comparison symbols.
Index Futures Correlations:
E-mini Contracts:
NQ (Nasdaq 100) compares with ES (S&P 500) and YM (Dow Jones)
ES (S&P 500) compares with NQ (Nasdaq 100) and YM (Dow Jones)
YM (Dow Jones) compares with NQ (Nasdaq 100) and ES (S&P 500)
RTY (Russell 2000) compares with ES (S&P 500) and NQ (Nasdaq 100)
Micro Contracts:
MNQ (Micro Nasdaq) compares with MES (Micro S&P) and MYM (Micro Dow)
MES (Micro S&P) compares with MNQ (Micro Nasdaq) and MYM (Micro Dow)
MYM (Micro Dow) compares with MNQ (Micro Nasdaq) and MES (Micro S&P)
M2K (Micro Russell) compares with MES (Micro S&P) and MNQ (Micro Nasdaq)
Metals Futures Correlations:
Standard Contracts:
GC (Gold) compares with SI (Silver) and PL (Platinum)
SI (Silver) compares with GC (Gold) and PL (Platinum)
PL (Platinum) compares with GC (Gold) and SI (Silver)
Micro Contracts:
MGC (Micro Gold) compares with SIL (Micro Silver) and PL (Platinum)
SIL (Micro Silver) compares with MGC (Micro Gold) and PL (Platinum)
Energy Futures Correlations:
CL (Crude Oil) compares with RB (RBOB Gasoline) and NG (Natural Gas)
RB (RBOB Gasoline) compares with CL (Crude Oil) and NG (Natural Gas)
NG (Natural Gas) compares with CL (Crude Oil) and RB (RBOB Gasoline)
MCL (Micro Crude) compares with RB (RBOB Gasoline) and NG (Natural Gas)
Major ETF Correlations:
SPY (S&P 500 ETF) compares with QQQ, DIA, and IWM
QQQ (Nasdaq 100 ETF) compares with SPY, DIA, and IWM
DIA (Dow Jones ETF) compares with SPY, QQQ, and IWM
IWM (Russell 2000 ETF) compares with SPY, QQQ, and DIA
Stock Sector Mapping:
When viewing individual stocks, the indicator automatically identifies the stock's sector and selects appropriate sector ETFs for comparison:
Technology Sector (AAPL, MSFT, GOOGL, NVDA, AMD, INTC, etc.):
Primary: QQQ (Nasdaq 100 ETF)
Secondary: XLK (Technology Select Sector SPDR)
Tertiary: SPY (S&P 500 ETF)
Financial Sector (JPM, BAC, GS, MS, WFC, etc.):
Primary: XLF (Financial Select Sector SPDR)
Secondary: KBE (SPDR S&P Bank ETF)
Tertiary: SPY (S&P 500 ETF)
Energy Sector (XOM, CVX, COP, SLB, etc.):
Primary: XLE (Energy Select Sector SPDR)
Secondary: USO (United States Oil Fund)
Tertiary: SPY (S&P 500 ETF)
Healthcare Sector (JNJ, UNH, PFE, MRK, LLY, etc.):
Primary: XLV (Health Care Select Sector SPDR)
Secondary: IBB (iShares Biotechnology ETF)
Tertiary: SPY (S&P 500 ETF)
Consumer Discretionary Sector (TSLA, HD, NKE, MCD, etc.):
Primary: XLY (Consumer Discretionary Select Sector SPDR)
Secondary: SPY (S&P 500 ETF)
Tertiary: QQQ (Nasdaq 100 ETF)
Consumer Staples Sector (PG, KO, PEP, WMT, COST, etc.):
Primary: XLP (Consumer Staples Select Sector SPDR)
Secondary: SPY (S&P 500 ETF)
Tertiary: QQQ (Nasdaq 100 ETF)
Industrial Sector (CAT, BA, HON, UPS, etc.):
Primary: XLI (Industrial Select Sector SPDR)
Secondary: SPY (S&P 500 ETF)
Tertiary: QQQ (Nasdaq 100 ETF)
Materials Sector (LIN, APD, SHW, FCX, NEM, etc.):
Primary: XLB (Materials Select Sector SPDR)
Secondary: GLD (SPDR Gold Shares)
Tertiary: SPY (S&P 500 ETF)
Utilities Sector (NEE, DUK, SO, etc.):
Primary: XLU (Utilities Select Sector SPDR)
Secondary: SPY (S&P 500 ETF)
Tertiary: QQQ (Nasdaq 100 ETF)
Real Estate Sector (AMT, PLD, CCI, etc.):
Primary: XLRE (Real Estate Select Sector SPDR)
Secondary: VNQ (Vanguard Real Estate ETF)
Tertiary: SPY (S&P 500 ETF)
Communication Services Sector (NFLX, DIS, CMCSA, VZ, T, etc.):
Primary: XLC (Communication Services Select Sector SPDR)
Secondary: SPY (S&P 500 ETF)
Tertiary: QQQ (Nasdaq 100 ETF)
Forex Correlations:
EURUSD compares with GBPUSD
GBPUSD compares with EURUSD
Cryptocurrency Correlations:
BTCUSD compares with ETHUSD
ETHUSD compares with BTCUSD
Three-Symbol Comparison
The indicator supports comparison against up to three symbols simultaneously. When multiple comparison symbols show divergence at the same pivot point, all diverging symbols are displayed in the label, providing stronger confluence. For example, if NQ shows divergence with both ES and YM at the same swing high, the label will display "ES1! + YM1!" indicating divergence confirmation from multiple correlated instruments.
Invalidation Logic
SMT divergences are not indefinitely valid. The indicator includes automatic invalidation logic based on price action following the divergence signal.
Invalidation Rules:
Bearish SMT: Invalidates when price trades above the high of the confirmation pivot (right side of the divergence)
Bullish SMT: Invalidates when price trades below the low of the confirmation pivot (right side of the divergence)
The invalidation level is set at the confirmation bar (the second pivot that completes the SMT pattern), not the extreme of both pivots. This approach aligns with the concept that once price exceeds the confirmation point, the divergence setup is no longer valid.
Invalidation Display Options:
Users can choose to show or hide invalidated SMT signals separately for current timeframe and higher timeframe divergences. When shown, invalidated signals can be displayed with different line styles and widths to visually distinguish them from active signals. Separate limits prevent excessive invalidated signals from cluttering the chart (maximum 15 invalidated signals per timeframe type).
Input Settings
General Settings
Enable SMT Detection:
Master toggle to enable or disable all SMT divergence detection. When disabled, no SMT signals will be calculated or displayed.
Direction:
Filter which divergence types to display:
Both: Display both bullish and bearish SMT divergences
Bullish: Display only bullish SMT divergences (divergence at lows)
Bearish: Display only bearish SMT divergences (divergence at highs)
Symbol Settings
Enable Auto SMT:
When enabled, the indicator automatically selects correlated comparison symbols based on the chart instrument using the correlation mappings described above. When disabled, manual symbol inputs are used.
Symbol 1 (with enable toggle):
First comparison symbol. Enabled by default. When Auto SMT is disabled, enter the desired symbol manually.
Symbol 2 (with enable toggle):
Second comparison symbol. Enabled by default. When Auto SMT is disabled, enter the desired symbol manually.
Symbol 3 (with enable toggle):
Third comparison symbol. Disabled by default. Enable for additional confirmation from a third correlated instrument.
Current Timeframe SMT Settings
Show Current TF SMTs:
Toggle visibility of SMT divergences detected on the chart's current timeframe.
Bullish Color:
Color for bullish SMT divergence lines and labels on the current timeframe.
Bearish Color:
Color for bearish SMT divergence lines and labels on the current timeframe.
Line Style:
Style for current timeframe SMT lines (solid, dashed, or dotted).
Line Width:
Width of current timeframe SMT lines (1-4 pixels).
Show Labels:
Toggle visibility of labels on current timeframe SMT divergences.
Label Style:
Normal: Displays full information including timeframe and diverging symbol names
+/-: Displays minimal "+" or "-" characters with full information available in hover tooltip
Label Size:
Size of current timeframe SMT labels (Tiny, Small, Normal, or Large).
Show Invalidated:
Toggle visibility of invalidated current timeframe SMT signals.
Invalidated Line Style:
Line style for invalidated current timeframe SMT signals.
Invalidated Line Width:
Line width for invalidated current timeframe SMT signals.
Higher Timeframe SMT Settings
Show Higher TF SMTs:
Toggle visibility of SMT divergences detected on the higher timeframe.
Auto Timeframe:
When enabled, automatically selects an appropriate higher timeframe based on the chart's current timeframe. When disabled, uses the manually specified timeframe.
Manual Timeframe:
When Auto Timeframe is disabled, specify the higher timeframe to scan for SMT divergences.
Bullish Color:
Color for bullish SMT divergence lines and labels on the higher timeframe.
Bearish Color:
Color for bearish SMT divergence lines and labels on the higher timeframe.
Line Style:
Style for higher timeframe SMT lines (solid, dashed, or dotted).
Line Width:
Width of higher timeframe SMT lines (1-4 pixels).
Show Labels:
Toggle visibility of labels on higher timeframe SMT divergences.
Label Style:
Normal: Displays full information including timeframe and diverging symbol names
+/-: Displays minimal "+" or "-" characters with full information available in hover tooltip
Label Size:
Size of higher timeframe SMT labels (Tiny, Small, Normal, or Large).
Show Invalidated:
Toggle visibility of invalidated higher timeframe SMT signals.
Invalidated Line Style:
Line style for invalidated higher timeframe SMT signals.
Invalidated Line Width:
Line width for invalidated higher timeframe SMT signals.
Visual Representation
Line Display
SMT divergences are displayed as lines connecting the two pivot points that form the divergence:
For bearish SMT: A line connects the previous swing high to the current (higher) swing high
For bullish SMT: A line connects the previous swing low to the current (lower) swing low
The line color indicates the divergence type (bullish or bearish) and whether it was detected on the current timeframe or higher timeframe.
Label Display
Labels are positioned at the midpoint of the SMT line and display:
The timeframe on which the divergence was detected
The symbol(s) that showed divergence with the chart instrument
When using the "+/-" label style, labels show only "+" for bullish or "-" for bearish divergences, with full information accessible via hover tooltip.
All labels use monospace font formatting for consistent visual appearance.
Combined Signals
When the same divergence is detected on both current and higher timeframes, the signals are combined into a single display using higher timeframe styling. The label shows both timeframes (e.g., "M2 + M15") and all diverging symbols, indicating strong multi-timeframe confluence.
Practical Application Guidelines
Signal Interpretation
SMT divergences should be interpreted within the broader market context. Consider the following when evaluating signals:
Market Structure: SMT divergences occurring at key structural levels (previous highs/lows, order blocks, fair value gaps) tend to be more significant.
Timeframe Confluence: Signals appearing on multiple timeframes simultaneously suggest stronger institutional involvement.
Symbol Confluence: Divergences confirmed by multiple comparison symbols indicate broader market disagreement with the current price direction.
Time of Day: SMT divergences during high-volume trading sessions may carry more weight than those during low-liquidity periods.
Limitations and Considerations
Correlation Variability: Correlations between instruments can strengthen or weaken over time. The automatic symbol selection is based on typical correlations but may not always reflect current market conditions.
Pivot Detection Lag: Pivots are only confirmed after subsequent price action, meaning SMT signals appear with some delay after the actual swing point forms.
False Signals: Not all SMT divergences result in reversals. Use additional confirmation methods and proper risk management.
Data Requirements: The indicator requires sufficient historical data and may not function properly on instruments with limited price history.
Technical Notes
The indicator uses multiple pivot detection periods to identify swing points across different scales
Higher timeframe candle tracking is performed on the lower timeframe chart for precise pivot bar indexing
A deduplication system prevents the same divergence from being detected multiple times across different pivot periods
Array-based storage manages active and invalidated SMT signals with automatic cleanup to prevent memory issues
Maximum label and line counts are set to 500 each to accommodate extended analysis periods
Disclaimer
This indicator is provided for educational and informational purposes only. It is designed to assist traders in identifying potential SMT divergences based on historical price data and should not be considered as financial advice or a recommendation to buy or sell any financial instrument.
Trading financial markets involves substantial risk of loss and is not suitable for all investors. Past performance of any trading methodology, including concepts discussed in this indicator, does not guarantee future results. Users should conduct their own research and analysis before making any trading decisions.
The automatic symbol correlations and sector mappings are based on general market relationships and may not accurately reflect current or future correlations. Users are encouraged to verify correlations independently and adjust comparison symbols as needed.
Always use appropriate risk management techniques, including but not limited to position sizing and stop-loss orders. Never risk more capital than you can afford to lose.

Session Killzone & Liquidity Sweep Engine [2025]A session-based market analysis tool designed to visualize key intraday trading sessions and monitor price interaction with session highs and lows.
The script draws configurable session ranges (Asia, London, New York AM, Lunch, and PM) using session-based boxes. For each session, the high and low levels are calculated in real time and projected forward as reference levels.
Each session high and low reacts dynamically to price behavior:
• If price wicks beyond a session level without a candle close beyond it, the level is marked as a liquidity sweep and stops extending.
• If price closes beyond a session level, the level is considered invalidated and removed.
Optional midpoint levels can be displayed for each session. Users can choose whether levels extend only until mitigation or continue beyond it, as well as whether only the most recent session or all past sessions are tracked.
Additional features include:
• Timezone support with proper session alignment
• Session drawing limits to manage chart clutter
• Timeframe filtering to restrict drawings to lower timeframes
• Optional alerts when session highs or lows are broken by a candle close
• Extensive customization for colors, line styles, labels, and visibility
This tool is intended for traders who analyze intraday price behavior around session highs and lows and want a structured way to observe wick-based interactions and level invalidations.

INSTITUTIONAL MOMENTUM [@Ash_TheTrader]⚡ The Impulse Engine: Institutional Velocity & Smart Structure System
Subtitle/Short Description: Stop looking at just Open and Close. Visualize the speed of price action, detect institutional footprints, and trade off dynamic "living" market structure that flips and burns automatically. Developed by @Ash_TheTrader.
The Hidden Dimension of Price Action
Most traders look at a standard candlestick and see four data points: Open, High, Low, and Close.
But this hides the most critical information: The struggle.
Did the buyers step in aggressively in the first 5 minutes, pushing price to highs instantly? (Institutional buying)
Or did it take 59 minutes of slow, grinding effort to reach that high? (Retail exhaustion/Trap)
Standard candles look identical in both scenarios. The Impulse Engine, developed by @Ash_TheTrader, solves this by visualizing the "Speed of Price" (Velocity) directly onto your chart, combined with a state-of-the-art, dynamic market structure system.
It’s not just an indicator; it’s a complete market X-ray.
1. The Velocity Painter: See the Speed ⚡
The core of this system is the Velocity Engine. It looks "inside" your current timeframe bar (using lower timeframe data) to calculate how fast price traveled to its extremes.
It paints the bars based on institutional urgency, allowing you to ignore the noise and focus on the momentum.
The Visual Code:
⚡ NEON CYAN (Bullish Impulse) : Aggressive buying. Price ripped from the open to the high very quickly. This is where the smart money is stepping on the gas.
⚡ NEON MAGENTA (Bearish Impulse): Aggressive selling. Price crashed from the open to the low immediately.
💤 FADED GREY (Exhaustion/Trap): The "grind." Price took a long time to reach its extremes. These are often low-momentum environments or potential traps waiting to reverse.
STANDARD GREEN/RED: Normal market flow with no significant velocity extremes.
"Trade the Neon, Ignore the Grey." — @Ash_TheTrader
2. Smart Structure: "Living" Levels 🏗️
Old-school pivot indicators clutter your chart with endless historical lines that are no longer relevant. The Impulse Engine uses a "Living Structure" algorithm that manages the lifecycle of every support and resistance level.
It only shows you the two most relevant Resistance levels (R1, R2) above price, and the two most relevant Support levels (S1, S2) below price.
Risk-Based Classification:
You choose the structure based on your trading style in the settings:
Scalp Mode: Detects short-term, 5-bar swings. (Thin dotted lines).
Trend Mode: Detects standard trend swings (21-bar). (Dashed lines).
Major Swing: Detects deep, major structural points (60-bar). (Thick solid lines).
The "Flip & Burn" Mechanic (Viral Feature) 🔥
This is where the system gets smart. It understands market mechanics:
The Flip (Role Reversal): If a Resistance level is broken by a candle close, it automatically turns Gold and becomes Support (Flip). The same applies to Support turning into Resistance. You no longer need to guess if an old level will hold from the other side.
The Burn (Auto-Cleaning): If a "Flipped" level is broken again, the system recognizes it has lost its structural integrity. The line is instantly "burned" (removed from the chart).
This ensures your chart only ever shows levels that are active and respected.
3. Whale Signs: The Footprint of Big Money 🐋
Sometimes, velocity isn't enough. You need to see raw power.
The Whale Sign feature detects massive expansions in volatility. It flags any candle whose range is significantly larger (default 2x) than the average of the previous two candles.
💚 Green Triangle + $ (Below Bar): A massive bullish expansion candle. A "Wake Up" call for longs.
❤️ Red Triangle + $ (Above Bar): A massive bearish expansion candle. A warning sign for shorts.
These often precede sustained velocity moves.
4. The Pro HUD (Heads-Up Display) 💻
In the bottom right corner, the dynamic HUD gives you a real-time health check of the current candle.
Status Header: Instantly tells you if the current candle is IMPULSE, EXHAUSTION, or NORMAL.
Live Velocity %: The exact speed score. The text color changes to Neon during impulses and fades to grey during exhaustion.
Mode Info: Reminds you which risk setting you are currently using (e.g., Mode: ).
Signature: The official @Ash_TheTrader stamp of quality.
How to Trade With The Impulse Engine
This system is designed for confluence. Never trade a signal in isolation.
📈 Strategy 1 : The "Velocity Bounce" (Trend Continuation)
Ensure the market is trending (e.g., making higher highs).
Wait for price to pull back to a Smart Support level (Cyan dashed line or Gold "Flip" line).
Trigger: Look for a Neon Cyan Impulse Candle to form right off that support level. This confirms institutions are defending the structure with speed.
📉 Strategy 2: The "Whale Breakout"
Identify a consolidation zone below a Smart Resistance level.
Trigger: A Whale Sign ($) appears on a candle that successfully closes above the Resistance level.
Confirmation: The very next candle should ideally be a Neon Impulse candle continuing the move.
Conclusion
The markets are moved by aggression and speed. By obscuring this data, standard charts put you at a disadvantage.
The Impulse Engine brings this hidden data to the forefront, combining institutional velocity detection with smart, automated market structure that reacts to price just like a professional trader would.
Trade faster, trade smarter.
Developed by @Ash_TheTrader.
(Disclaimer: This tool is for informational purposes only and does not constitute financial advice. Always manage your risk.)
