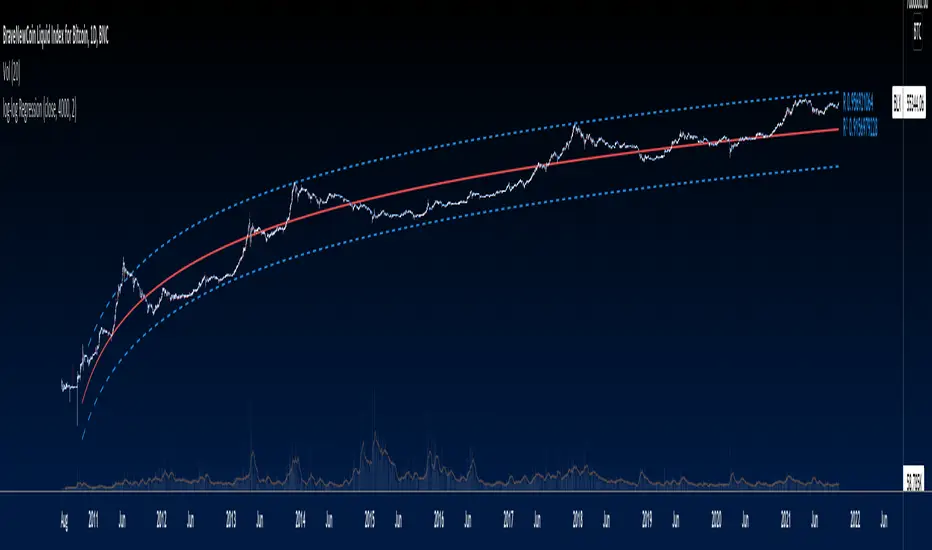
log-log Regression From ArraysCalculates a log-log regression from arrays. Due to line limits, for sets greater than the limit, only every nth value is plotted in order to cover the entire set.
Hồi quy tuyến tính
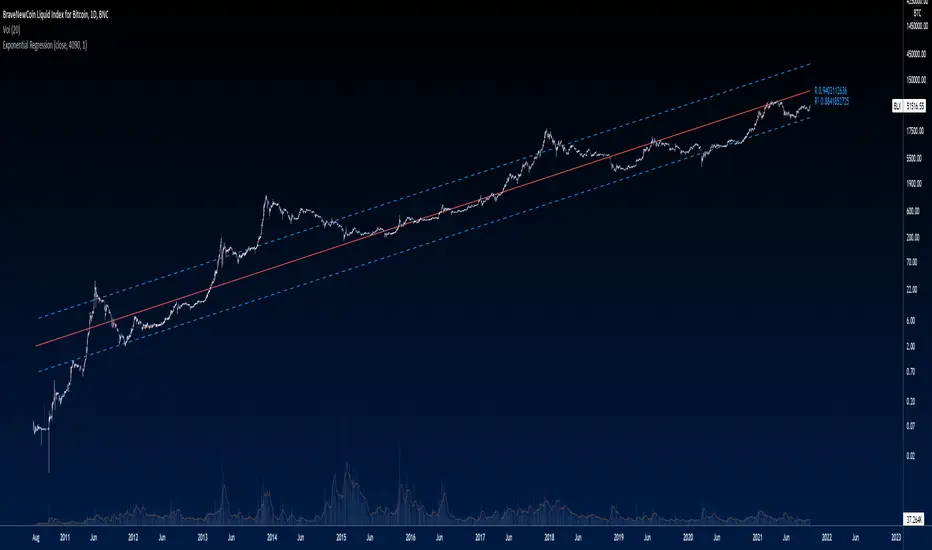
Exponential Regression From ArraysCalculates an exponential regression from arrays. Due to line limits, for sets greater than the limit, only every nth value is plotted in order to cover the entire set.
Smoothed Wave ScalperThis one is a little different.
Instead of layering lots of indicators to filter noise, I'm instead using two different kinds of price averaging to smooth the candles and better define the direction. Just select a smoothing value that fits your chart and timeframe. In theory, this should remove a fair bit of noise (although nothing's perfect)
I've managed to determine when the candles change colour, signifying a potential new trend. When the candle colours do change, an alert is fired. It's as simple as that! Wyckoff wave volume analysis is then applied to each alert to validate the move. Further filtering can be achieved using heikin ashi candles if this is your preference.
Alerts are built in for both the candle colour change and the wave filtered signals (long/short). Use long/short for entries and the colour changes for exits.
I'm currently trading with linear regression to help indentify obvious channels and areas of support/resistance. The candles bouncing down off of the upper band can confirm a downward trend, and bouncing off of the lower band can signify an up trend. It's much easier to see with smoothed candles like these and can give you confidence when trading manually. These bands are rendered automatically, but aren't essential to taking a trade.

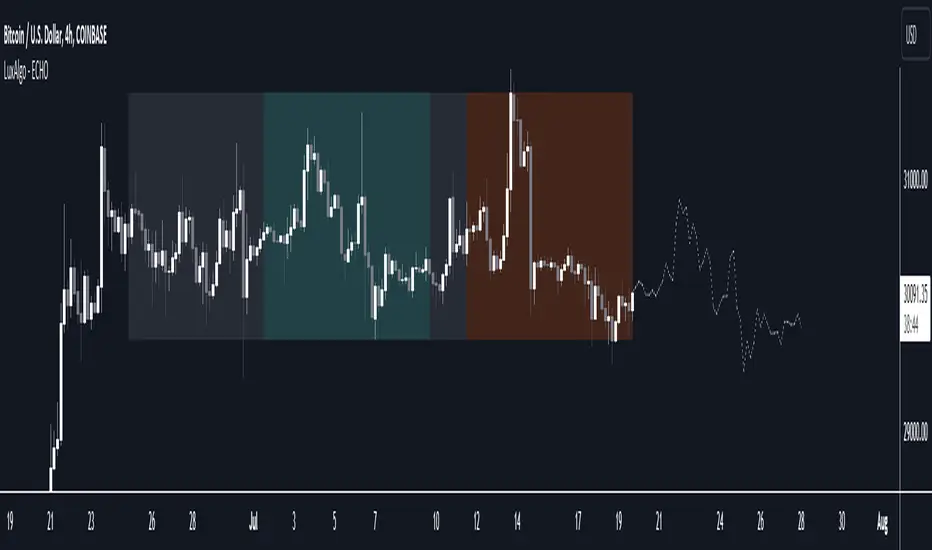
The Echo Forecast [LuxAlgo]This indicator uses a simple time series forecasting method derived from the similarity between recent prices and similar/dissimilar historical prices. We named this method "ECHO".
This method originally assumes that future prices can be estimated from a historical series of observations that are most similar to the most recent price variations. This similarity is quantified using the correlation coefficient. Such an assumption can prove to be relatively effective with the forecasting of a periodic time series. We later introduced the ability to select dissimilar series of observations for further experimentation.
This forecasting technique is closely inspired by the analogue method introduced by Lorenz for the prediction of atmospheric data.
1. Settings
Evaluation Window: Window size used for finding historical observations similar/dissimilar to recent observations. The total evaluation window is equal to "Forecast Window" + "Evaluation Window"
Forecast Window: Determines the forecasting horizon.
Forecast Mode: Determines whether to choose historical series similar or dissimilar to the recent price observations.
Forecast Construction: Determines how the forecast is constructed. See "Usage" below.
Src: Source input of the forecast
Other style settings are self-explanatory.
2. Usage
This tool can be used to forecast future trends but also to indicate which historical variations have the highest degree of similarity/dissimilarity between the observations in the orange zone.
The forecasting window determines the prices segment (in orange) to be used as a reference for the search of the most similar/dissimilar historical price segment (in green) within the gray area.
Most forecasting techniques highly benefit from a detrended series. Due to the nature of this method, we highly recommend applying it to a detrended and periodic series.
You can see above the method is applied on a smooth periodic oscillator and a momentum oscillator.
The construction of the forecast is made from the price changes obtained in the green area, denoted as w(t) . Using the "Cumulative" options we construct the forecast from the cumulative sum of w(t) . Finally, we add the most recent price value to this cumulated series.
Using the "Mean" options will add the series w(t) with the mean of the prices within the orange segment.
Finally the "Linreg" will add the series w(t) to an extrapolated linear regression fit to the prices within the orange segment.
Exponential Regression Channel with novel volatilityThis code is a modified version of the built-in "linear regression" script of Tradingviews which can be plotted correctly on logarithmic charts
The log reg code of Forza was adjusted by altustro to generate an exponential regression (or a correct linear regression on the log scale, this is equivalent).
The standard deviation in the log scale is a better volatility measure which we call novola, and which defines the trend channel displayed in addition to the main indicator.
The exponential regression slope and channel also defines the typical holding time of the stock and the SL/TP boundaries, which are calculated and displayed at the last bar.
The display works both in log and regular scale. But only in the log scale it can be compared to the linear extension, which can also be plotted when activated in the properties.
The underlying exponential fit can not be displayed in regular scale as only lines can be plotted by TV. But with the related script Exponental Regression also the exponential regression can be exactly displayed using a workaround.

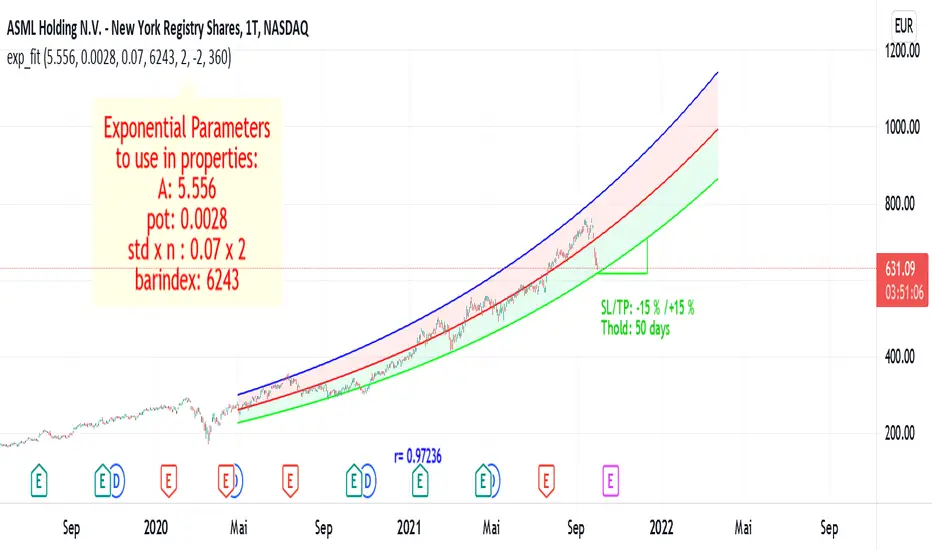
Exponential RegressionIn Tradingview it is not possible to actually display arbitrary non-linear functions retrospectively.
Series objects can only depend on the current or past bars
Thus, while regression is possible, display of a non-linear curve into the past is not possible
This script is a workaround to be able to still display an exponential fit of the last n bars.
It is based on a linear regression of the log(close). The parameters of this regression are printed in the label.
To create the correct plot, these parameters have to be written into the properties of the indicator.
The functions displayed follow the expression exp(A)* exp(pot*t+d)
where d =0 for the center line, and d = +-std * upperMult for the upper and lower line respectiveley.
The parameters of the function are:
amplitude in log scale A
exponent of the exponential function pot
standard deviation of the linear regression std
number of bars of the current chart bindex
multiplicator of the std of the upper and lower exponential line upperMult and lowerMult +
This code is a version of the built-in "linear regression" script of Tradingview alztered by Forza so it can be plotted correctly on logarithmic charts
The code of Forza was further adjusted by altustro to be able to plot the full exponential curve also in regular scale
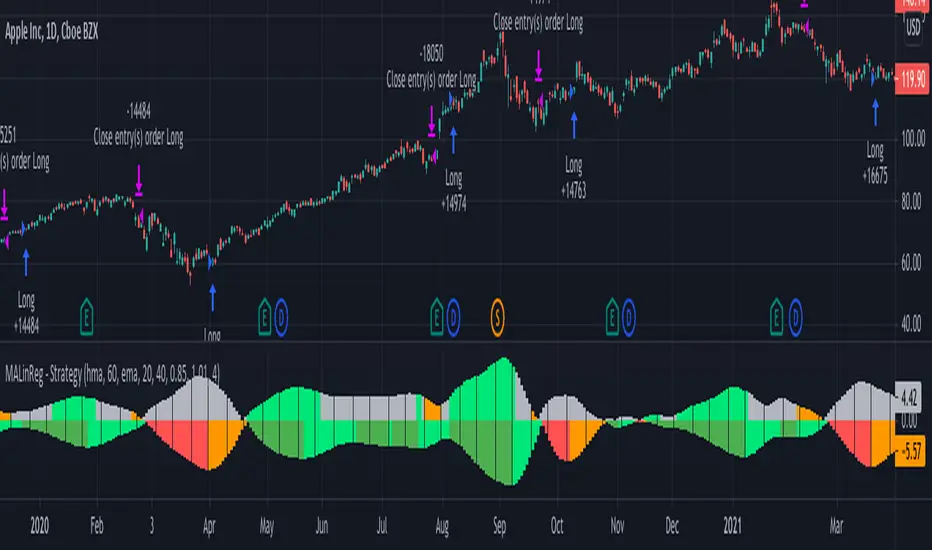
MACD Linear Regression by zdmreBoth the Moving Average Convergence Divergence (MACD) and the Linear Regression (LR) rank among the most popular momentum indicators used in trading. When used in combination with other technical indicators, both MACD and LR can offer value in validating trade opportunities to optimize your risk management practices.
While they represent a similar approach to evaluating trades, the functions of both MACD and LR are distinct, which makes them useful indicators to combine in trade evaluation. Here’s a look at how to use MACD and LR as part of your trade analysis.
***Use it at your own risk
If you have new ideas to improve this indicator then let me know please.
Keep Learning, Keep Earning
US 10 Yr Yield Fair ValueI calculate a fair value of the US 10 year yield applying a rolling regression (default 15 periods) with 2 different ratios.
Entry of long and short are based on differ and exit are based if yield high/low price is below/above the fair value -/+ 1 std dev.
Exit when long is based on if short is indicated or yield is inside the boundary of the FV value (+/-5% of FV for example)
Exit when short is when long is indicated.

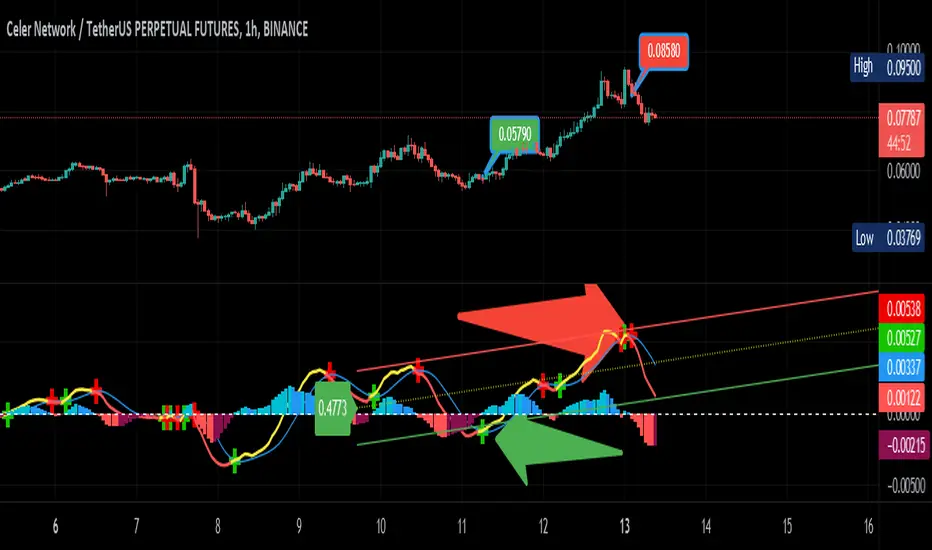
MACandles-LinearRegression-StrategyThis is combination of multiple indicators and strategies. Mainly useful for indexes and to time the entry and exits of indexes. No stoploss used - makes it less desirable for leveraged trades or trading individual stocks.
Let us rewind and look back at some of the indicators/strategies published earlier.
1. Moving Average Candles - this is one of my favourite tool for general trend filtering. Applying supertrend on moving average candles is one of the easiest ways to find reversal in trending market without exiting positions too early. Few scripts published on this basis are:
MA Candles Supertrend
MA Candles Supertrend Strategy
2. VixFix and Linear Regression - this itself is combination of two indicators.
Williams-Vix-Fix-Finds-Market-Bottoms - by @ChrisMoody
Squeeze-Momentum-Indicator - by @LazyBear
I have combined these two indicators to derive VIX-Fix linear regression to find absolute market bottoms. More description here:
VixFixLinReg-Strategy
VixFixLinReg-Indicator
Now, in this strategy, we combine all these together.
Derive moving average candles
Derive momentum of moving average candles
Derive Linear regression on momentum
Optionally, also calculate VIX Fix and Linear regression on VixFix momentum
To find market bottom:
There are two options
1. Use when momentum of MA candles hit bottom (red) and slowly turn up (orange). In aggressiveLong mode, signals are also generated when momentum starts going positive from negative.
2. Use Vix Fix linear regression of MA candles as described in the original script of VixFixLinReg-Strategy
To find market top
Here only Ma candles momentum decreasing is used as signal. If looking for longTrades , exit signal is generated only when momentum is turning negative extreme(orange). Or else, exit signal is generated when momentum has turned neutral.
At this stage, it is very much experimental - use it with caution :)
KINSKI Volume Regression TrendRegression trends are typically used to determine when a price is unusually far from its baseline. The script calculates the linear regression of volume and price to determine the trend direction and strength. This can be used to determine the volume support for upward/downward trends.
As a special feature, this indicator allows you to choose from three (as of 07/20/2021) templates with special presets.
The following templates are available:
"Precise" (Period: 4, Smoothing Factor Type: "DISABLED", Smoothing Factor Length = 1).
"Smooth" (Period: 4, Smoothing Factor Type: "RMA", Smoothing Factor Length = 2)
"Long Term (Period: 20, Smoothing Factor Type: "DISABLED", Smoothing Factor Length = 1)
In the selection for templates, the option "DISABLED" can also be selected. Then the user-defined settings selectable under it take effect. There are the following setting options.
"Length": Adjustable period
"Smoothing Factor: Type": Type of moving average
"Smoothing Factor: Length": Adjustable period
Other setting options are:
Color codes: The color codes are explained in the settings
Display types: "Columns", "Histogram", "Area", "Line", "Stepline"

DAYOFWEEK performance1 -Objective
"What is the ''best'' day to trade .. Monday, Tuesday...."
This script aims to determine if there are different results depending on the day of the week.
The way it works is by dividing data by day of the week (Monday, Tuesday, Wednesday ... ) and perform calculations for each day of the week.
1 - Objective
2 - Features
3 - How to use (Examples)
4 - Inputs
5 - Limitations
6 - Notes
7 - Final Tooughs
2 - Features
AVG OPEN-CLOSE
Calculate de Percentage change from day open to close
Green % (O-C)
Percentage of days green (open to close)
Average Change
Absolute day change (O-C)
AVG PrevD. Close-Close
Percentage change from the previous day close to the day of the week close
(Example: Monday (C-C) = Friday Close to Monday close
Tuesday (C-C) = Monday C. to Tuesday C.
Green % (C1-C)
Percentage of days green (open to close)
AVG Volume
Day of the week Average Volume
Notes:
*Mon(Nº) - Nº = Number days is currently calculated
Example: Monday (12) calculation based on the last 12 Mondays. Note: Discrepancies in numbers example Monday (12) - Friday (11) depend on the initial/end date or the market was closed (Holidays).
3 - How to use (Examples)
For the following example, NASDAQ:AAPL from 1 Jan 21 to 1 Jul 21 the results are following.
The highest probability of a Close being higher than the Open is Monday with 52.17 % and the Lowest Tuesday with 38.46 %. Meaning that there's a higher chance (for NASDAQ:AAPL ) of closing at a higher value on Monday while the highest chance of closing is lower is Tuesday. With an average gain on Tuesday of 0.21%
Long - The best day to buy (long) at open (on average) is Monday with a 52.2% probability of closing higher
Short - The best day to sell (short) at open (on average) is Tuesday with a 38.5% probability of closing higher (better chance of closing lower)
Since the values change from ticker to ticker, there is a substantial change in the percentages and days of the week. For example let's compare the previous example ( NASDAQ:AAPL ) to NYSE:GM (same settings)
For the same period, there is a substantial difference where there is a 62.5% probability Friday to close higher than the open, while Tuesday there is only a 28% probability.
With an average gain of 0.59% on Friday and an average loss of -0.34%
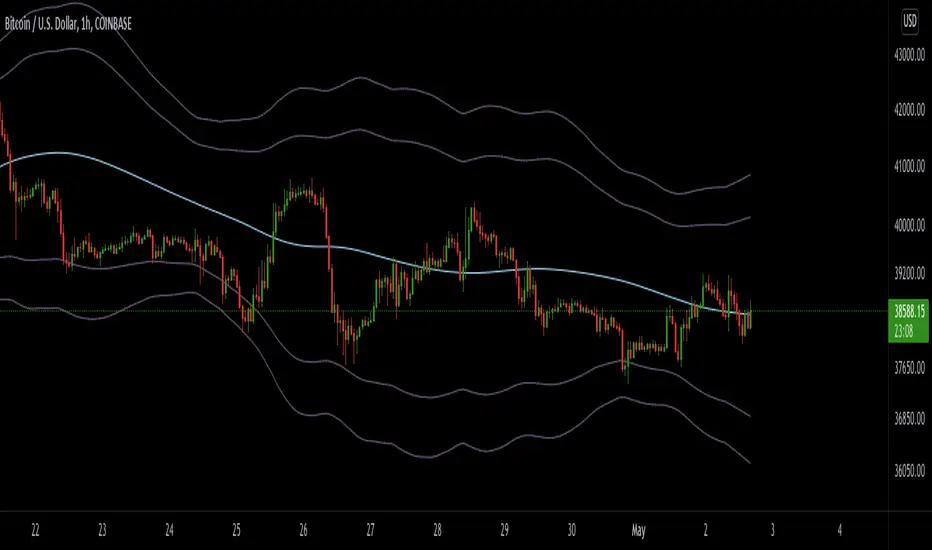
Also, the size of the table (number of days ) depends if the ticker is traded or not on that day as an example COINBASE:BTCUSD
4 - Inputs
DATE RANGE
Initial Date - Date from which the script will start the calculation.
End Date - Date to which the script will calculate.
TABLE SETTINGS
Text Color - Color of the displayed text
Cell Color - Background color of table cells
Header Color - Color of the column and row names
Table Location - Change the position where the table is located.
Table Size - Changes text size and by consequence the size of the table
5 - LIMITATIONS
The code determines average values based on the stored data, therefore, the range (Initial data) is limited to the first bar time.
As a consequence the lower the timeframe the shorter the initial date can be and fewer weeks can be calculated. To warn about this limitation there's a warning text that appears in case the initial date exceeds the bar limit.
Example with initial date 1 Jan 2021 and end date 18 Jul 2021 in 5m and 10 m timeframe:
6 - Notes and Disclosers
The script can be moved around to a new pane if need. -> Object Tree > Right Click Script > Move To > New pane
The code has not been tested in higher subscriptions tiers that allow for more bars and as a consequence more data, but as far I can tell, it should work without problems and should be in fact better at lower timeframes since it allows more weeks.
The values displayed represent previous data and at no point is guaranteed future values
7 - Final Tooughs
This script was quite fun to work on since it analysis behavioral patterns (since from an abstract point a Tuesday is no different than a Thursday), but after analyzing multiple tickers there are some days that tend to close higher than the open.
PS: If you find any mistake ex: code/misspelling please comment.

Support and ResistanceThis indicator shows three types of support and resistance lines: Horizontal, Parallel (using linear regression) and Fibonacci Retracement. Lines can be adjusted or turned on and off in settings. A great tool for setting up entries, exits and locating pivot points.

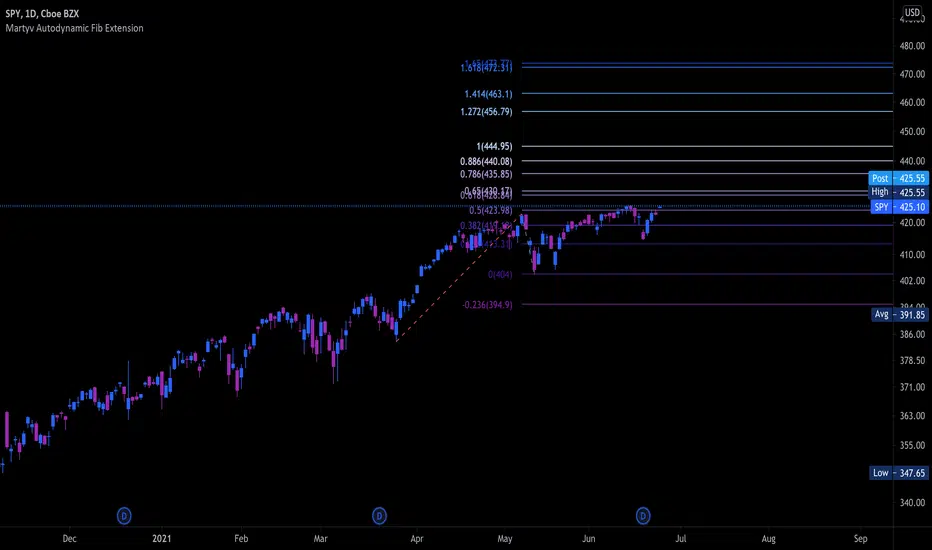
Martyv Auto Fib Extension with Logarithmic SupportSimilar to the Auto Fib Retracement tool - I took the out-of-the-box functionality and added Logarithmic support, as well as nicer colors and easier management of levels. I'm... 90% sure I got the Fib calculations correct. If you see something, say something! Would love any suggestions for improvement.
Grid Bot AutoThis script is an auto-adjusting grid bot simulator. This is an improved version of the original Grid Bot Simulator. The grid bot is best used for ranging/choppy markets. Prices are divided into grids, or trade zones, that will trigger signals each time a new zone is entered. During ranging markets, each transaction is followed by a “take profit.” As the market starts to trend, transactions are stacked (compare to DCA ), until the market consolidates. No signals are triggered above the Upper Limit or Below the Lower Limit. Unlike the previous version, the upper and lower limits are calculated automatically. Grid levels are determined by four factors: Smoothing, Laziness, Elasticity, and Grid Intervals.
Smoothing:
A moving average (or linear regression) is applied to each close price as a basis. Options for smoothing are Linear Regression, Simple Moving Average, Exponential Moving Average, Volume-Weighted Moving Average, Triple-Exponential Moving Average.
Laziness:
Laziness is the percentage change required to reach the next level. If laziness is 1.5, the price must move up or down by 1.5% before the grid will change. This concept is based on Alex Grover’s Efficient Trend Step. This allows the grids to be based on even price levels, as opposed to jagged moving averages.
Elasticity:
Elasticity is the degree of “stickiness” to the current price trend. If the smoothing line remains above (or below) the current grid center without reverting but still not enough to reach the next grid level, the grid line will start to curve toward the next grid level. Elasticity is added to (or subtracted from) the gridline by a factor of minimum system ticks for the current pair. Elasticity of zero will keep the gridlines horizontal. If elasticity is too high, the grid will distort.
Grid Intervals:
Grid intervals are the percentage of space between each grid.
Laziness = 4%, Elasticity = 0. Price must move at least 4% before reaching the next level. With zero elasticity, gridlines are straight.
Laziness = 5%, Elasticity = 100. For each bar at a new grid level, the grid will start “curve” toward the next price level (up if price is greater than the middle grid, down if less than middle grid). Elasticity is calculated by the user-inputted “Elasticity” multiplied by the minimum tick for the current pair (ELSTX = syminfo.mintick * iELSTX)
Try experimenting with different combinations of the Smoothing Length, Smoothing Type, Laziness, Elasticity, and Grid Intervals to find the optimum settings for each chart. Lower-priced pairs (e.g. XRP/ADA/DODGE) will require lower Elasticity. Also note that different exchanges may have different minimum tick values. For example, minimum tick for BITMEX:XBTUSD and BYBIT:BTCUSD is .5, but BINANCE:BTCUSDT and COINBASE:BTCUSD is .01.
s3.tradingview.com
DODGEUSDT, 5min. Laziness: 4%, Elasticity 2.5
Number of Grids: 2. Laziness: 3.75%. Elasticity: 150. Grid Interval 2%.
Settings Overview
Smoothing Length : Smoothing period
Smoothing Type : Linear Regression, Simple Moving Average, Exponential Moving Average, Volume-Weighted Moving Average, Triple-Exponential Moving Average
Laziness : Percentage required for price to move until it reaches the next level. If price does not reach the next level (up or down), the grid will remain the same as previous grid (because it’s lazy).
Elasticity : Amount of curvature toward the next grid, based on the current price trend. As elasticity increases, gridlines will curve up or down by a factor of the number of ticks since the last grid change.
Grid Interval : Percent between grid levels.
Number of Grids : Number of grids to show.
Cooldown : Number of bars to wait to prevent consecutive signals.
Grid Line Transparency : Lower transparencies brighten the gridlines; higher transparencies dim the gridlines. To hide the gridlines completely, enter 100.
Fill Transparency: Lower transparencies brighten the fill box; higher transparencies dim the fill box. To hide the fill box completely, enter 100.
Signal Size : Make signal triangles large or small.
Reset Buy/Sell Index When Grids Change : When a new grid is formed, resetting the index may prevent false signals (experimental)
Use Highs/Lows for Signals : If enabled, signals are triggered as soon as the price touches the next zone. If disabled, signals are triggered after bar closes. Enable this for “Once Per Bar alerts. Disable for “Once Per Bar Close” alerts.
Show Min Tick : If checked, syminfo.mintick is displayed in upper-righthand corner. Useful for estimating Laziness.
Reverse Fill Colors : Default fill for fill boxes is green after buy and red after sell. Check this box to reverse.
Note: The Grid Bot Simulator scripts are experimental and works in progress. Please feel free to comment or contact me if you have suggestions/complaints.

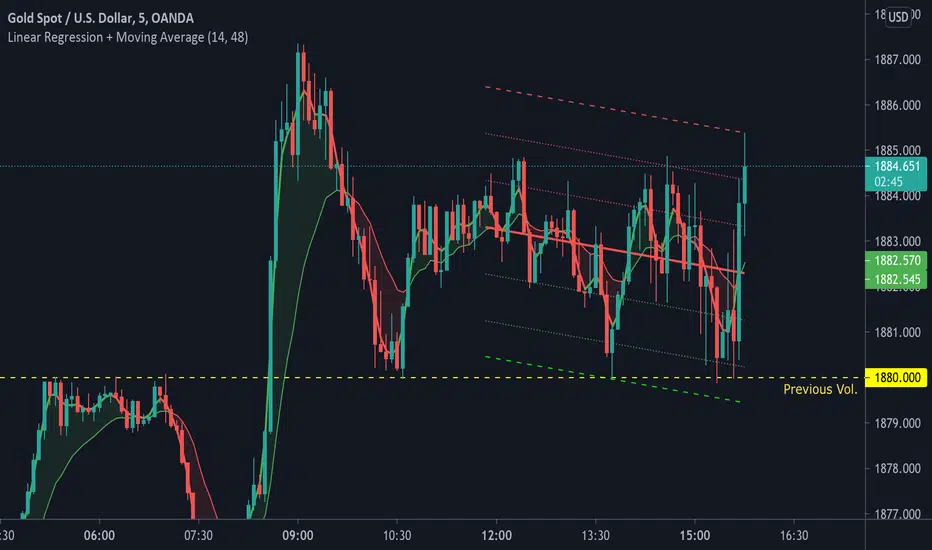
Linear Regression + Moving Average1. Linear Regression including 2 x Standard Deviation + High / Low. Middle line colour depends on colour change of Symmetrically Weighted Moving Average . Green zones indicate good long positions. Red zones indicate good short positions. (Custom)
2. Symmetrically Weighted Moving Average. Colour change depending on cross of offset -1. (Fixed)
3. Exponentially Weighted Moving Average. Colour change depending on cross with Symmetrically Weighted Moving Average. (Custom)
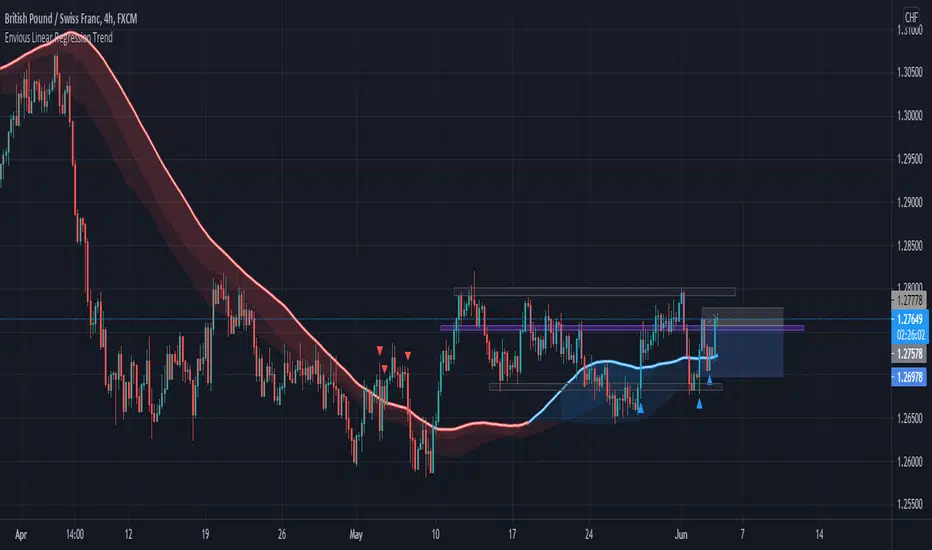
Envious Linear Regression TrendHey traders, this is a linear regression moving average trend indicator that is designed to filter out noise and give you a better insight of the current trend in the market. The design is a linear regression cloud that covers above the price or below the price and it changes colour based on the current dominant line through the crossover and crossunder feature. This indicator should be used as a confluence and not as a "trade the crossover indicator" and it is recommended that you combine this with analysis such as support and resistance to see how the market is doing. This indicator works best with Heikin Ashi candlesticks and it supports all chart types too.
Features:
3 Length Modes that are changeable via input on the settings.
Custom Bar Colour
Crossover Markups
Re-Entry Markups
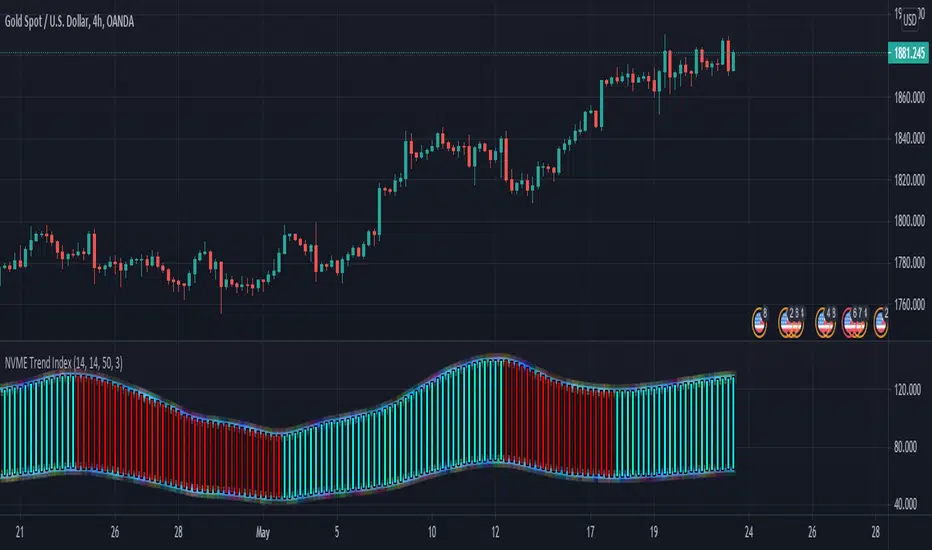
NVME Trend IndexNVME Trend Index is an indicator that confirms the direction of the trend through using a modified linear regression that combines moving averages onto different formulas to create the final result. The main area of the indicator is the columns that are blue and red, these work off the modified linear regression and if a is greater than b then the column will be coloured positively (blue), elsewise it will be negative (red). NVME Trend Index can also be used to identify overbought and oversold zones of the market and due to the way the indicator is outputted it can also be used to identify possible higher highs / lows, lower lows / highs, which can be useful. This can be identified when you zoom out of your charts to see the market structure based on this indicator.
There are only 4 settings to play around with, this is one of our most simplest indicators to use yet.
Setting 1: Index Length : This is a number-based input field that has the minimum value of 5 and maximum value of 30, changing the number inside of here will change how fast / slow the bars will switch trends and this also impacts the values of the column's top and bottom.
Setting 2: Reactivity : This is another number-based input field that has the minimum value of 1 and the maximum value of 200, changing the number inside of here will add towards how fast / slow the bars will switch trends and the lower it is the faster it is, but this will contain some false columns, increasing it will delay the trend switch however remove most false columns.
Setting 3: Trend Scalar : This is another number-based input field that has the minimum value of 10 and the maximum value of 500, changing the number inside of here will impact all of the indicator and the modified linear regression. This will result in smaller or larger columns, faster or slower trend reactions.
Setting 4: Trend Offset : This is the modifier for the trend scalar and this will impact its effectiveness at providing faster / slower trend switches.
This indicator is best combined with NVME Vanquisher X Algorithm, support and resistance analysis or your trading style and our NVME Trend Meter X. Though you could use this, enable the trend cloud feature on NVME Vanquisher and use the calls made.
This script comes with all NVME Scripts.
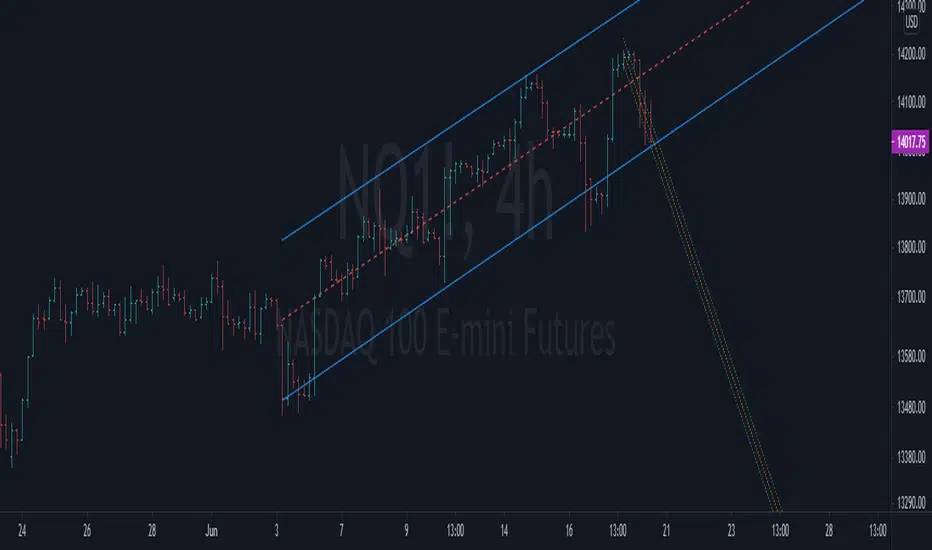
Realtime Optimized Linear Regression Channelthis script is based on "Optimized Linear Regression Channel" by alexgrover, whose page I recommend you to visit, to read the extensive description he provides
the main difference with the original version is the fact that the start point of the channel (left point) is fixed by setting the time (Begin time input).
This way, the channel size is automatically set, meaning that the channel grows larger as new data comes in, while the starting point remains at the same spot
this can be useful to track a new trend that may be forming from an inflection point or pivot, by selecting begin time as the time of the inflection
also, an end date input is provided to limit the size of the channel.
The script provides two channels:
the main channel that contain all data from begin to end time
the best fit channel that finds the best linear fit inside data from begin to end time
one issue that the script has is the limit in the number of points of size of the channel, that if too large then make the channel disappear (sigh)
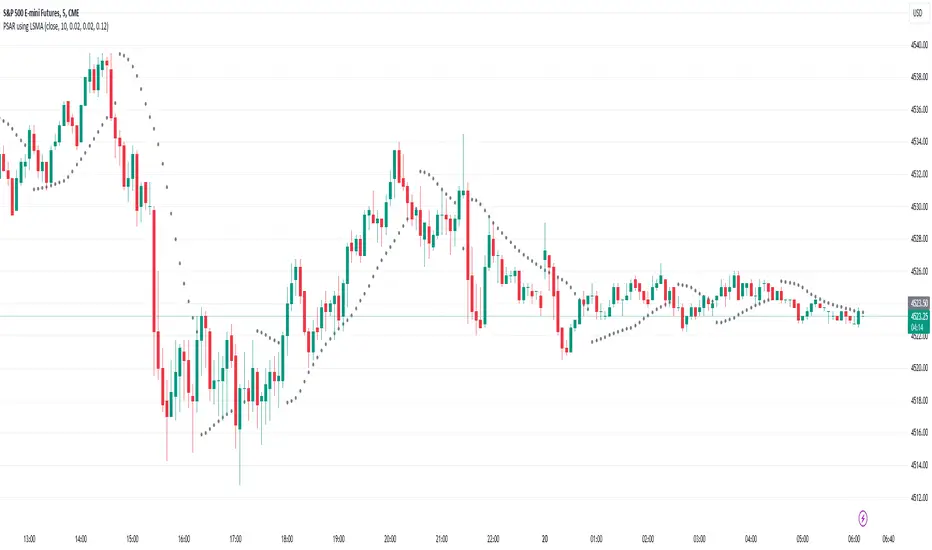
PSAR using Moving Linear Regression (LSMA)Works exactly as the standard PSAR with the only difference that a Moving Linear Regression Line (=Least Squares Moving Average, LSMA) is used as input.
So the PSAR flip is triggered not by price itself but by the LSMA line.
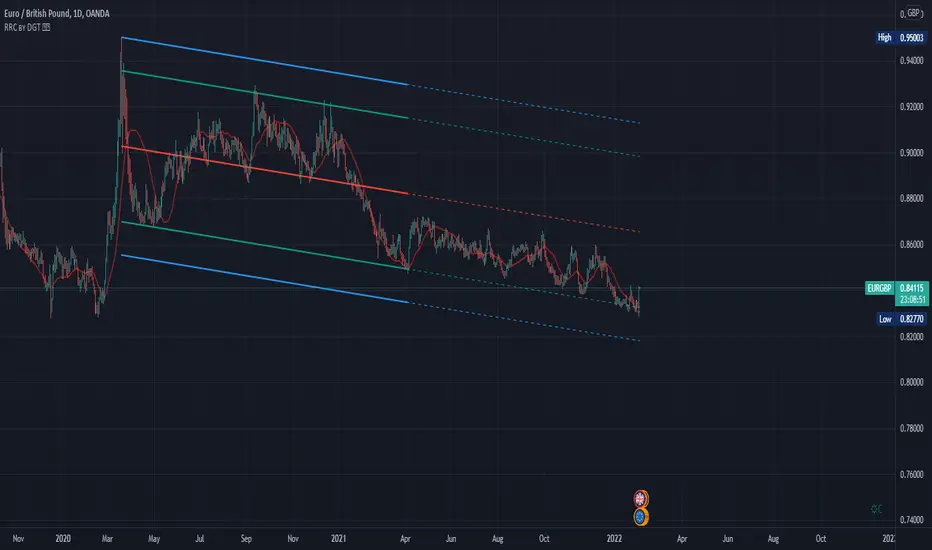
Raff Regression Channel by DGTRᴀꜰꜰ Rᴇɢʀᴇꜱꜱɪᴏɴ Cʜᴀɴɴᴇʟ (RRC)
This study aims to automate Raff Regression Channel drawing either based on ZigZag Indicator or optionally User Preference
The Raff Regression Channel , developed by Gilbert Raff, is based on a linear regression, which is the least-squares line-of-best-fit for a price series, with evenly spaced trend lines above and below . The width of the channel is set by determining the high or low that is the furthest from the linear regression.
Because the channel distance is based off the largest pullback or highest peak within a trend, for effectively drawing and using a Raff Regression Channel it is recommend/required that a Raff Regression Channel is applied to “mature” trends. Knowing this requirement, for better automated drawing results this study benefits from the Zig Zag Indicator, where the Zig Zag indicator is used to help identify price trends and changes in price trends. Option to manually adjust lengths for drawing a Raff Regression Channel is also made available.
Using a Raff Regression Channel
Once The Raff Regression Channel is drawn, covering an existing trend, Exᴛᴇɴꜱɪᴏɴ Lɪɴᴇꜱ are drawn to identify ᴛʜᴇ ꜱᴜᴘᴘᴏʀᴛ﹐ʀᴇꜱɪꜱᴛᴀɴᴄᴇ ᴏʀ ʀᴇᴠᴇʀꜱᴀʟ ᴘᴏɪɴᴛꜱ
The trend is up as long as prices rise within this channel. An uptrend may be reversing (not always, but likely) when price breaks below the channel extension . The trend is down as long as prices decline within the channel. Similarly, a downtrend may be reversing (not always, but likely) when price breaks above the channel extension . Moves outside the channel extensions can be indication of a reversal or can denote overbought or oversold conditions
For further details please refer to education post Raff Regression Channel
█ FEATURES
- AUTO or MANUALLY adjusted Raff Regression Channel and Channel Extentions drawing
- ALERTs, for Linear Regression Line, Raff Regression Upper and Lower Channel Extentions
- LSMA , Least Squares Moving Average, in other words Linear Regression Curve
█ SETTINGS
Setting Loopback and Number of Bars are the most important part for The Raff Regression Channel, where ;
- Lookback, defines where the Raff Regression Channel is starting, it is recommended to set to a trend begining
- Number of Bars, defines how many bars to be assumed for calculation, or simply stated the end of the Raff Regression Channel drawing (not extentions but the main channel, extentions by default will be drawn till the last bar)
Setting of Loopback and Number of Bars is performed eigher automatically based on Zig Zag indicator or users may prefer to set them manually. If selected automatically then
- Deviation and Depth values of Zig Zag indicator are used for calculations (enabling visually plotting of ZigZag Lines will help to identify better visually the points), where ;
Deviation, is a multiplier that affects how much the price should deviate from the previous pivot in order for the bar to become a new pivot.
Depth, affects the minimum number of bars that will be taken into account when building
Short-term traders may wish to apply the channel to small waves of a trend so they can reduce the value of the Deviation and Depth
█ OTHER CHANNEL CONSEPTS
Linear Regression Channels, , what linear regression channels are? and linear regression channel/curve/slope study
Fibonacci Channels, how to apply fibonacci channels and automated fibonacci channels study
Andrews’ Pitchfork, how to apply pitchfork and automated pitchfork study
Special Thanks to @Kiss66000 for his kind suggestion, je vous remercie beaucoup @Kiss66000
Disclaimer :
Trading success is all about following your trading strategy and the indicators should fit within your trading strategy, and not to be traded upon solely
The script is for informational and educational purposes only. Use of the script does not constitute professional and/or financial advice. You alone have the sole responsibility of evaluating the script output and risks associated with the use of the script. In exchange for using the script, you agree not to hold dgtrd TradingView user liable for any possible claim for damages arising from any decision you make based on use of the script
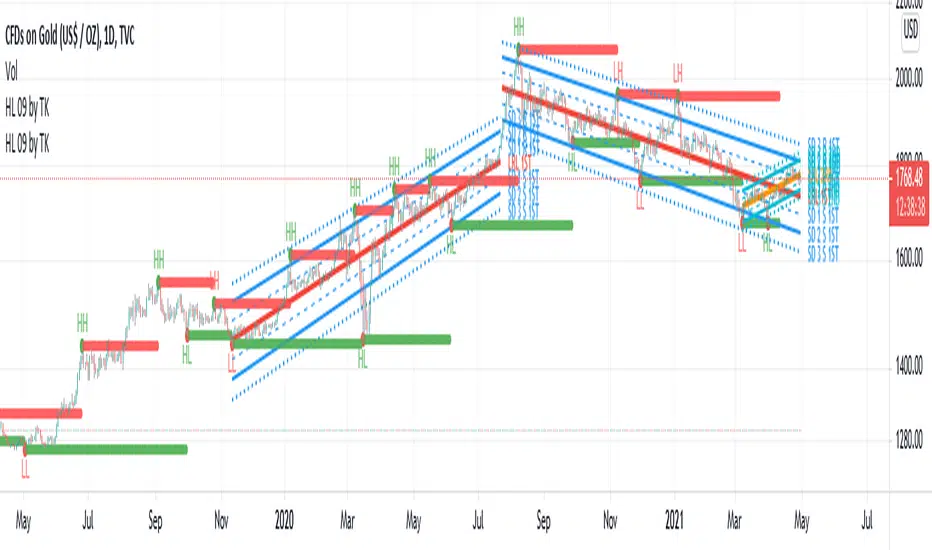
TradiKator 09 HH HL LH LL & Linear Regression
TradiKator 09 HH HL LH LL & Linear Regression indicates whether current price movement exceed the trend or not.
Here, we use Higher High,Higher low, Lower High, Lower Low to identify a possible change of trend.
Also we use 2 Linear Regression Channels (short term & long term) to identify a price trend.
I hope this indicator can help traders to estimate trend change in the essential trading behavior.
1)Higher High,Higher low, Lower High, Lower Low
Higher High and Higher Low indicates a Bull trend
Lower High and Lower Low indicates a Bear trend
Those high low pivot points is a verg good mark to judge if current trend keeps going on or not.
Setting :
Left pivot length
Right pivot length
The longer pivot length is , the less sensetive and more delay you signal will be, especially the right privot
2)Linear Regression Channels
Linear Regression Line – is a line drawn according to the least-squares statistical method which produces a best fit line
The resulting can be used to predict price trend from the same system.
Setting :
Count ---> the length of the Linear Regression, remember more data in interest = less accuracy and bigger sigma
The End bar of Linear Regression ---> If you don't want latest K bar in the Linear Regression interest (they are not in the same trend), then you can move the Linear Regression to earlier bar
This indicator is inspired by GDT who is a great coder.
Known issue:
Not yet.
Multiband - Market TimerThis strategy is made for market timing in the bull markets. Hence, more ideal to use it with index ETFs or high conviction large caps.
This makes use of different custom indicators:
Multi Band Channel - Overbought/Oversold Oscillator
VixFix Linear regression
Regular Linear Regression.
Multi Band Oscillator is used for identifying overbought/oversold state of the instrument. This is used in conjunction with VIXFix Linear Regression to to find market bottoms for entry conditions.
Few parameters are explained below:
CheckBandDistance - If checked checks for narrow bands and ignore signals when crossover happens in narrow bands.
ConsiderOversoldDaysCounter/ConsiderOverboughtDaysCounter - If checked, considers oversold and overbought crossovers only if instrument stays in oversold/overbought state for that many bars.
UseLinearRegressionToOpen/UseLinearRegressionToClose - If checked, combines linear regression along with overbought/oversold condition for entry and exits.
UseVixFixToOpen - Uses VixFixLinear regression to identify market bottom and this condition will be combined with oversold/overbought state. When using VixFixLinearRegression signal, we can allow generating entry signals during non crossover bars. Vix Fix Entry Range sets the max bar for multi band state to be for generating signal. For example, if Vix Fix Entry Range is set to oversold, signal is generated based on VixFix if price is below oversold.
ExitStrategy - This can be trailing/reversal or combined. If set to reversal, exit will happen on state moving out of oversold region. If set to Trailing, stop will be based on trailing stops. Indicator shows what is the present stop value. If set to combined, exit will happen on stages. 30% of the remaining position gets closed upon reversals. State may go into oversold and return back many times before having full exit. If this happens, each time, 30% of the position will be closed. Full position closure happens on hitting training stop.
Candles are colored based on linear regression.
Green -> positive and moving up
Lime -> Positive moving down
Orange -> Negative moving up
Red -> Negative moving down
Purple -> Possible VixFix peak - aka Market bottom
Another snapshot of the script along with Linear regression and VIXFix-LinReg indicators:
Related scripts are found here:
I have not put additional indicators to identify trend. But, can be combined with higher timeframe trend filters to generate better signals. Making this as invite only script as I find it very lucrative to time index ETFs. Please PM me if you want to try this script.
