Combo Backtest 123 Reversal & Ergodic CSI This is combo strategies for get a cumulative signal.
First strategy
This System was created from the Book "How I Tripled My Money In The
Futures Market" by Ulf Jensen, Page 183. This is reverse type of strategies.
The strategy buys at market, if close price is higher than the previous close
during 2 days and the meaning of 9-days Stochastic Slow Oscillator is lower than 50.
The strategy sells at market, if close price is lower than the previous close price
during 2 days and the meaning of 9-days Stochastic Fast Oscillator is higher than 50.
Second strategy
This is one of the techniques described by William Blau in his book
"Momentum, Direction and Divergence" (1995). If you like to learn more,
we advise you to read this book. His book focuses on three key aspects
of trading: momentum, direction and divergence. Blau, who was an electrical
engineer before becoming a trader, thoroughly examines the relationship between
price and momentum in step-by-step examples. From this grounding, he then looks
at the deficiencies in other oscillators and introduces some innovative techniques,
including a fresh twist on Stochastics. On directional issues, he analyzes the
intricacies of ADX and offers a unique approach to help define trending and
non-trending periods.
This indicator plots Ergotic CSI and smoothed Ergotic CSI to filter out noise.
WARNING:
- For purpose educate only
- This script to change bars colors.
M-oscillator
Retail Slayer StrategyRetail Slayer Strategy
Intended Markets: Forex, Indices, Cryptocurrencies, and metals (Gold, Silver)
Timeframe Use: 15 minutes only
Trailing Stop: 35-pips for Forex
The purpose of this strategy is to answer the question many retail traders have: Why does it feel like trades go against me immediately after placing a buy/sell? This strategy puts you into the position of taking trades against the majority of retail traders.
The underlying logic of this strategy involves the use of specific momentum, volatility, intra-week, and intra-day data to determine whether certain extremes that exist in common retail oscillators are truly indicative of a corrective move or a trend reversal. This strategy checks against those conditions to monitor whether certain breaks of certain price ranges are truly honest, or just fake-outs.
The 35-pip trail is intended for all of the Intended Markets listed above (ticks/points where necessary), and the 15-minute chart is also intended for all of the above-Intended Markets. There are options for you to adjust the trailing-stop, profit target, and stop(s) to fine-tune an instrument to your desired settings. However, I would recommend you stick with the 15-min, 35-pip default settings until you are more familiar with how this strategy works.
To utilize this strategy as an alert, simply add it to your chart then click on the Strategy Tester below. You will see a small alarm clock icon next to the cog-wheel - click the Alarm Icon and you can create the alert utilizing this strategy.
You will receive a notification warning you that this strategy can cause issues with repainting, and that is a known issue. However, with any strategy, it pays to confirm and do your own due diligence before committing to any trade. This strategy is intended to help identify and confirm entries in conjunction with your own analysis.
To inquire about access, please send me a PM. Please reach out if you have any questions.

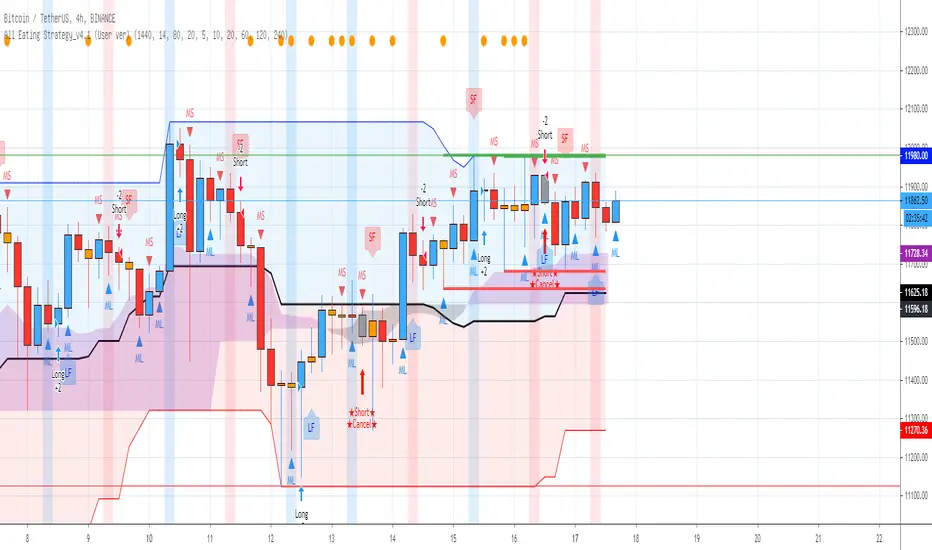
[AngelHouse] All Eating StrategyHello, I'm Angelhouse, a crypto analyst and developer of the index :)
I would like to introduce the newly developed strategic indicators.
- The All Eating indicator is a strategic indicator made for trading in the crypto market.
- This indicator is based on the four-hour time zone, and is a strategic indicator using the intersection of the threshold.
- If the plot is crossed over, busy signal or crossunder, a sell signal is generated.
★ Describe the All Eating Strategy v3.2 indicator
1. Long & Short: You can configure your swing strategy based on the signal.
The All Eating Strategy indicator is based on a four-hour frame. Due to the logic nature, the signal does not match at a time higher than 4 hours. Therefore, we recommend that you use the indicator only in a time zone of 4 hours or less.
Also, the signal does not have 100% accuracy, so even if you configure a strategy based on the signal, it is recommended that you set the break/break line and respond.
2. Long Feel & Short Feel: The signal is also quite reliable. The strength of the signal is that when a strong rise and a strong fall occur, it is almost 100% probability that the signal is sold.
However, the downside is that there may be some offbeat in the transverse section. However, even if the index is offbeat, the loss is small, and if the stock price rises or falls, high expected returns can be expected.
You can use the signal alone, but if you use the Long & Short indicator, you can get better results. If the Long Feel & Short Feel signal is also generated where the Long & Short signal is generated, the probability will be higher, right?
3. Long Signal Cancel / Short Signal Cancel : After the sale signal, if the stock price moves in the opposite direction of the signal, the Long Signal Cancel / Short Signal Cancel signal will be generated. If the signal is triggered, close the sale at a break.
Please wait for the next signal.
4. Candle color: White cans are formed when cans such as the Dojorpoenor hammer are generated. The cans have a meaning of reversal when they occur after a strong rise or fall, and can continue the trend when they occur during an ongoing trend.
5. Single item band: The single item band consists of the strong area (blue area) and the weak area (red area) based on the reference line. Stock prices can indicate additional gains when they are in the bullish zone, and additional declines when they are in the weak zone.
Also, you can recognize the top of the strong zone as the resistance line and the bottom of the weak zone as the support line.
The cloud stand in the single band should be located in front of the band for 26 days, but it is also recognized as a role of support and resistance.
6. 1D Baseline: The line of one bar is recalled to 4 hours. blue when the reference line is positive, red when negative, and gray when horizontal, and red when the reference line is positive,
Or, in the opposite case, it's time to suspect a trend inflection.
※ If you want to obtain access to this indicator with a script dedicated for the first time, please contact the link shown in the signature.
Ehlers Bandpass FilterThis script uses @cheatcountry script to determine Ehlers Bandpass Filter.
Backtest offers 3 capital management tools. One that will always calculate order size as initial capital/close, one that uses the same calculation but adds or substracts profit. The last one allows you to enter manually the size you want to trade.
The time-based stop will close the position after a set number of bars.

Custom Screener with Alerts [QuantNomad]Some time ago I published an example of simple custom screener in PineScript:
The only thing this screener did is created a dynamic label with screener output.
Recently TradingView announced alerts from the strategy with the possibility to add custom messages to alerts.
So using it I was able to create a bit more advanced screener which sends results as alert messages. With tools like Alertatron, you can easily redirect them to Telegram if you want.
It works for 40 symbols (limitation of the number of security calls).
To create your own screener you need to change only screenerFunc. The logic of this function is very simple, it outputs value you want to display in screener and condition based on which your screener should filter your stocks.
To create alerts for this screener create an alert from strategy and use {{strategy.order.alert_message}} as alert message.
Do you know now how to make this screener better? Let me know.
Disclaimer
Please remember that past performance may not be indicative of future results.
Due to various factors, including changing market conditions, the strategy may no longer perform as good as in historical backtesting.
This post and the script don’t provide any financial advice.

HFT Fibonacci Bands BacktesterDefault Settings are meant to be used in XBT/USD chart on 15 min time frame. If you want to use for another asset on another time frame YOU MUST CHANGE THE SETTINGS
This is a Fibonacci bands based trading strategy developed by HFT Research. It is a highly customizable strategy and provides endless opportunities to find profitable trades in the market.
Use Fib BB
This is the main decision maker of the strategy. Tuning the settings of this portion of the strategy will change the outcome the most. We have provided default settings. However, they are only good for 15min chart on Bitcoin . Please adjust accordingly.
Fib BB Length: This setting adjusts the middle line of your Fibonacci Bands. It is the moving average that you take it as base for your Fibonacci bands. Default value is currently 20.
Fib Level to Use for Entry: Here, you adjust which one of the Fibonacci Ratio levels you would like to use for your entry. You can only choose one of the following options.
Fibonacci Ratio 1
This is your Fib ratio level 1 and you can put any number here you would like
Fibonacci Ratio 2
This is your Fib ratio level 2 and you can put any number here you would like
Fibonacci Ratio 3
This is your Fib ratio level 3 and you can put any number here you would like
Please keep in mind that Ratio 1 should be higher than Ratio 2 and Ratio 2 should be higher than Ratio 3.
Use RSI
You can also turn on and off the RSI as well. Alternatively, there is an option to use RSI on a different time frame than you are currently on. For example, if you are looking at the 5min chart to use Bollinger bands but you would like to look at the RSI value on the 15min chart. You can do so by selecting the custom RSI timeframe as well as adjusting the Oversold and Overbought value.
Use CCI
Commodity Channel Index is an indicator developed by Donald Lambert. It is a momentum-based oscillator used to help determine when an investment vehicle is reaching conditions of being overbought or oversold. It also used to asses price trend direction and strength. Default settings are usually the safest and the best fit.
Use VWAP
VWAP stands for volume weighted average price . It is an extremely useful indicator when trading intra-day. It does reset every trading session which is at 00:00 UTC . Instead of looking at x number of candles and providing an average price, it will take into consideration volume that’s traded at a certain price and weigh it accordingly.
Use ADX
ADX stands for average directional index . It is an indicator that measures volatility in the market. Unfortunately, the worst market condition for this strategy is sideways market. ADX becomes a useful tool since it can detect trend. If the volatility is low and there is no real price movement, ADX will pick that up and will not let you get in trades during a sideways market. It will allow you to enter trades only when the market is trending.
Use MA Filters
Lookback: It is an option to look back x number of candles to validate the price crossing. If the market is choppy and the price keeps crossing up and down the moving average you have chosen, it will generate a lot of “noisy” signals. This option allows you to confirm the cross by selecting how many candles the price needs to stay above or below the moving average. Setting it 0 will turn it off.
MA Filter Type: There is a selection of moving averages that is available on TradingView currently. You can choose from 14 different moving average types to detect the trend as accurate as possible.
Filter Length: You can select the length of your moving average. Most commonly used length being 50,100 and 200.
Filter Type: This is our propriety smoothing method in order to make the moving averages lag less and influence the way they are calculated slightly. Type 1 being the normal calculation and type 2 being the secret sauce
Reverse MA Filter: This option allows you to use the moving average in reverse. For example, the strategy will go long when the price is above the moving average. However, if you use the reserve MA Filter, you will go short when the price is above the moving average. This method works best in sideways market where price usually retraces back to the moving average. So, in an anticipation of price reverting back to the moving average, it is a useful piece of option to use during sideway markets.
The backtester assumes the following;
- 1000$ capital
- 0.06% commission based on binance
- 1% risk meaning 100% equity on cross leverage
- Backtest results are starting from 2020
If you want to get access to this indicator please DM me or visit our website.

Script Criptomaníacos FuturesThis Script runs a strategy for long and short entries.
The strategy is based on a breakout system, that enters long or short based on previous support and resistences, and a series of indicators in order to read the trend and momentum of price charts.
We are only able to place entry orders when the background collor indicates price matches with the Trend/Momentum filters, being green for long and red for short trades.
The exit will always based on a trailling stop.
__________________________________________
Esse script roda uma estratégia para entradas em long e short.
A estratégia é baseada em um estratégias de rompimento, que entra Long ou Short baseado em suportes e resistências anteriores, além de uma série de indicadores afim de ler a tendência e o momentum do gráfico de preço.
Só estamos autorizados a emitir ordens de entrada quando o Background indica que o preço concorda com os filtros de Tendência/Momentum, sendo verde para Long (compra) e Short (venda).
A saída sempre vai ser baseada em um método de trailling stop.

SIDD-VortexSidd-Vortex strategy is using Vortex formula to generate 4 signals Bullish1 Bullish2 and Bearish1 Bearish2.
Bullish1 signal is getting generated when smooth ma of VIP is crossing over smooth ma of VIM and smooth VIM is falling from previous bar smooth VIM
Bullish2 signal is getting generated when smooth ma of VIP is crossing over smooth ma of VIM and smooth VIP is rising from previous bar smooth VIP
Bearish1 signal is getting generated when smooth ma of VIM is crossing over smooth ma of VIP and smooth VIP is falling from previous bar smooth VIP
Bearish2 signal is getting generated when smooth ma of VIM is crossing over smooth ma of VIP and smooth VIM is rising from previous bar smooth VIM
This strategy can be converted into study by un-commenting the plotshape and replace 15th line strategy with study and parameter overlay=false
and remove the if blocks.
I have seen trending market this strategy is working find but in choppy and consolidation zone strategy doesnt work and results are as expected.
This strategy can be used for stocks, commodity, Forex.
I have added commission and slippage with back test result.
Enjoy code is open.

Psychological strategy v2I made a change to the psychological line I made before.
The 4-hour and the 1-hour line are shown with the psychological.
Strategy
If the 4-hour psychological is above red line( 70 per cent) and the 1-hour psychological is lower than the previous hour's psychological, go short.
The opposite is true for longs.
you can change the number 70 above on the parameter page
以前に作ったサイコロジカルラインに変化を加えてみました。
4時間足と1時間足の2つをサイコロジカルを表示しています。
戦略
4時間足のサイコロジカルが赤い線(70パーライン)を超えており、かつ1時間足が前の1時間のサイコロジカルより下がっていればショートで。
ロングは逆に青いラインを下回っており、かつ一時間が上がっていればエントリーとしています。
スクリプトのアレンジ等、コメントいただければアレンジさせていただきます。

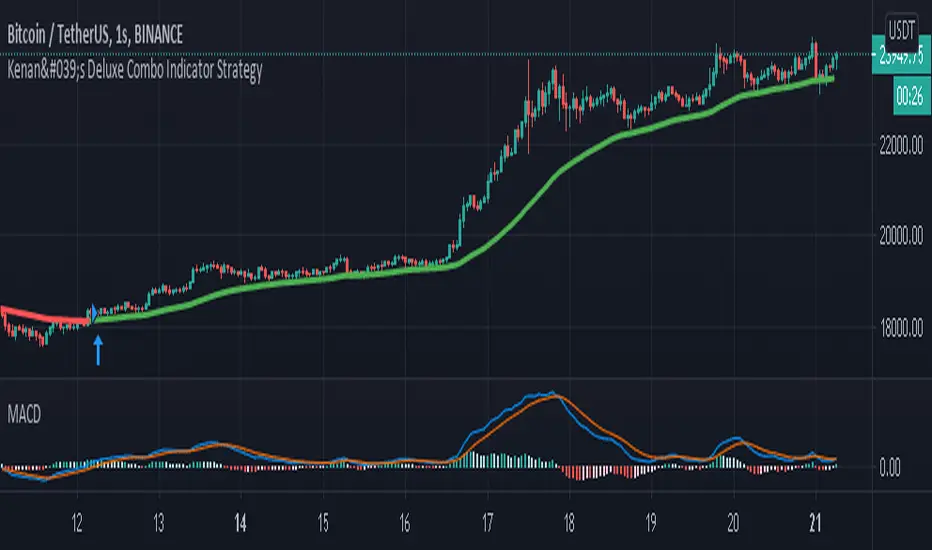
Kenan's Deluxe Combo Indicator Scalper Version StrategyThis is a combo strategy of sorts. I've been able to come up with this strategy after a lot of research.
Under Normal circumstances, when people look at dozens of indicators and they all signal, they open positions. So I decided to save people the trouble and put the major indicators together in a strategy.
All of the classic cross strategies usually give a lot of signal. Some of these signals are unnecessary and incorrect signals. Combining leading indicators. I tried to avoid the faulty signals.
Indicators and oscillators included in this strategy are:
1. Ema 5/13/21
2. Macd
3. Macd Dema
4. Ichimoku
5. Dmi
6. Stochastic
7. Aroon
8. Bollinger Band
9. Rsi
10. Chande Momentum Oscillator
11. Exponential Ease of Movement ( Eom )
12. Klinger Oscillator
13. Stochastic RSI
14. Ultimate Oscillator
15. Woodies CCI
16. Rate Of Change Lenght( Roc ) oscillator
17. WaveTrend Oscillator . It was created by @fskrypt.
18. Ehlers Adaptive CG Indicator . It was created by @LazyBear
19. Insync Index. It was created by @LazyBear
This script works by listening to the indicators and oscillators above. Opens new position after receiving signal verification signal from all
So how does this strategy close your position (optional).
1. You can close the position with the trailing stop option.
2. You can close the position according to the Rsi limits. To give an example. After a long position is opened, you can close the position after the rsi has risen above 70.
3. You can close the position according to the Bollinger Band . After a position is opened, you can close the position after the price moves out of the bollinger Band .
You can also change the values of indicators as desired. If you get better results. I would appreciate it if you could contact me via comment or private message.
I set the commission rate at 0.075 percent. If you want, you can change the settings yourself and make backtest.I changed the default settings for some indicators.

Kenan's Deluxe Combo Indicator StrategyThis is a combo strategy of sorts. I've been able to come up with this strategy after a lot of research.
Under Normal circumstances, when people look at dozens of indicators and they all signal, they open positions. So I decided to save people the trouble and put the major indicators together in a strategy.
All of the classic cross strategies usually give a lot of signal. Some of these signals are unnecessary and incorrect signals. Combining leading indicators. I tried to avoid the faulty signals.
Indicators and oscillators included in this strategy are:
1. Ema 5/13/21
2. Macd
3. Macd Dema
4. Ichimoku
5. Dmi
6. Stochastic
7. Aroon
8. Bollinger Band
9. Rsi
10. Chande Momentum Oscillator
11. Exponential Ease of Movement ( Eom )
12. Klinger Oscillator
13. Stochastic RSI
14. Ultimate Oscillator
15. Woodies CCI
16. Rate Of Change Lenght( Roc ) oscillator
17. WaveTrend Oscillator . It was created by @fskrypt.
18. Ehlers Adaptive CG Indicator . It was created by @LazyBear
19. Insync Index. It was created by @LazyBear
This script works by listening to the indicators and oscillators above. Opens new position after receiving signal verification signal from all
So how does this strategy close your position (optional).
1. You can close the position with the trailing stop option.
2. You can close the position according to the Rsi limits. To give an example. After a long position is opened, you can close the position after the rsi has risen above 70.
3. You can close the position according to the Bollinger Band . After a position is opened, you can close the position after the price moves out of the bollinger Band .
You can also change the values of indicators as desired. If you get better results. I would appreciate it if you could contact me via comment or private message.
I set the commission rate at 0.075 percent. If you want, you can change the settings yourself and make backtest.I changed the default settings for some indicators.
mark strategy1 band+rsi filter for xbtusdHi first of all thanks for read this.
This is my first strategy for make trading, I optimized it for xbtusd and 15 min or 30 min charts.
You can personalize some setting for reach a better result then me, these are the setting:
1) trend bars
U can change this value for trade after a prefix number of candle who confirm signals
2) time frame
U can change this value for use a different number of candle for take signals
3) date setting:
U can change this value for test strategy in a specific period
4) rsi period
U can change this value for use a differt rsi timeframe for rsi filter
5) rsi up
U can change this value for enter a trade after rsi is > of value
6) rsi low
U can change this value for enter a trade after rsi is < of value
7) take profit
U can change this value for exit trade after a prefix $ price change
8) stop loss
U can change this value for stop trade after a prefix $ price change
9) trailing stop
U can change this value for use trailing stop option, u can follow the price with this setting
10) trailing stop offset
U can change this value for a retard of trailing stop option this can help to understand the real earning with stop loss because sometimes broker's stop loss is not perfect
Have nice day and send me a message if u will earn with my strategy.
If u want my code send me a message
DUOT STRATEGYDescription:
Duot Strategy utilizes the MDMA Oscillator to detect divergences of the price line from a set of normalized differential oscillators
The oscillator uses the average of all the oscillators used by the Duot Oscillators Indicator , the oscillators are then normalized and then triple smoothed using a variant of McGuinly formula.
Default settings are optimized for BTCUSD 1D
Settings:
- Date Selectors
- Oscillators Lookback: applies to all oscillators
- Normalize Lookback
- Duot Oscillator Lookback
- Duot Oscillator MA1 Slow, Fast Len
- Duot Oscillator MA2 Slow, Fast Len
- Duot Oscillator MA1 Type:
- Duot Oscillator MA2 Type:
- MA1, MA2, MA3 Lookback length, for (short, long) decision.
- Toggle, Long Only, Short Only, Long & Short
- Confirmation Signal Level 1, 2, 3

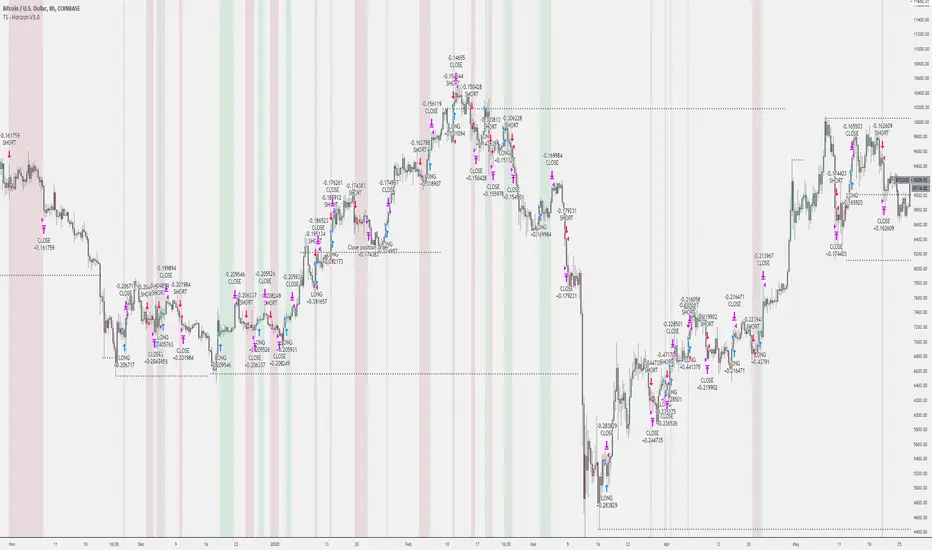
Tradespot Horizon - Strategy & AlertsTradespot - Horizon is a long term trading algorithm that is run at Tradespot to generate consistent performance in all market conditions. Backtests show performance remains consistent in both bull and bear markets dated back to 2015 and has the capabilities to be utilitised in both spot trading or using low leverage (e.g. 3X).
The default settings are built for BTCUSD 8H. Just plug and play, no configuration needed to achieve the exact backtest displayed above.
Features:
Trade following signals generated via our bespoke algorithm
Full customisation to allow a deeper use of the indicator across different assets
Full risk management with take profit and stop loss levels (configurable) built in
Preset for BTCUSD on the 8H timeframes avaliable instantly for your use.
Cornix compatible alerts - with the easiest of configurations you can automate this execution of this strategy.
More features being added all the time, we have great ideas and our only limitation is how fast we can program it.
Can I get a free trial?
Yes! Get in touch for a complimentary 24 hour free trial to the indicator, no strings attached.
Who are you?
Tradespot has been creating scripts for years on TradingView that we use to leverage our social trading and signal group offerings. We currently have over $200K in assets trading with our strategies across over 300 users.
You can learn more about us on our website or DM me directly. Please reach out to me or see the link on our profile.
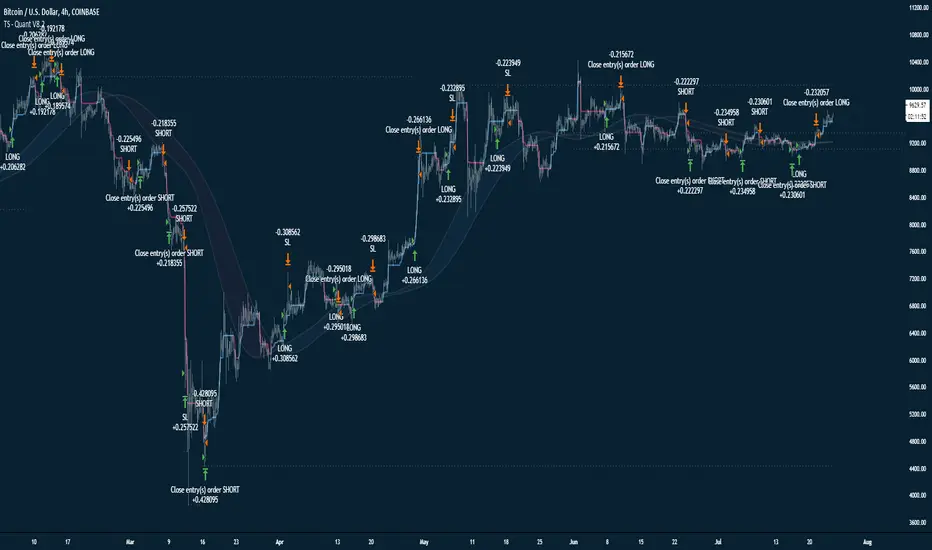
Tradespot Quant - Strategy & AlertsTradespot - Quant is an extensive trading algorithm, signal generator and technicals screener packed into one beautifully designed, functional indicator. The script is very customisable to not limit the trader using it but does have some very respectable default settings for BTCUSD on the 4H and 15M charts that we run in an automated fashion here a Tradespot round the clock on Binance Futures.
What does Tradespot Quant do?
Trade following signals generated via our bespoke algorithm
Full customisation to allow a deeper use of the indicator across different assets
Full risk management with take profit and stop loss levels (configurable) built in
Presets for BTCUSD & ETHUSD on the 4H/15M timeframes avaliable instantly for your use.
Innovative trade panel that illustrates key information such as what trade the algorithm is looking for next
More features being added all the time, we have great ideas and our only limitation is how fast we can program it!
Cornix compatible alerts - with the easiest of configurations you can automate this execution of this strategy.
Do you do a free trial?
Yes! Get in touch for a complimentary 48 hour free trial to the indicator, no strings attached.
Who are you?
Tradespot has been creating scripts for years on TradingView that we use to leverage our social trading and signal group offerings. We currently have over $200K in assets trading with our strategies across over 300 users.
You can learn more about us on our website. Please reach out to me or see the link on our profile.
Quickie (Free) BacktesterQuickie is a free tradingview Indicator developed by HFT Research. It works in sideways and trending markets depending the way you set it as well as both on short time frame and long time frame. It comes with backtesting abilities on tradingview.
BITMEX:XBTUSD
Use Bollinger Bands
This piece of the settings will turn and off Bollinger band’s input in the decision making. BB Length will determine the Moving average you are using to take the standard deviation off of which is named as BB Multiplier. Default settings will use 20 moving average and take standard deviation of 2 to create lower and upper bands. Increasing the Multiplier will give you fewer but safer entries
Use RSI
You can also turn on and off the RSI as well. Alternatively, there is an option to use RSI on a different time frame than you are currently on. For example, if you are looking at the 5min chart to use Bollinger bands but you would like to look at the RSI value on the 15min chart. You can do so by selecting the custom RSI timeframe as well as adjusting the Oversold and Overbought value.
Use MA Filter
Lookback: The indicator has an option to look back x number of candles to validate the price crossing. If the market is choppy and the price keeps crossing up and down the moving average you have chosen, it will generate a lot of “noisy” signals. This option allows you to confirm the cross by selecting how many candles the price needs to stay above or below the moving average. Setting it 0 will turn it off.
MA Filter Type: There is a selection of moving averages that is available on TradingView currently. You can choose from 14 different moving average types to detect the trend as accurate as possible.
Filter Length: You can select the length of your moving average. Most commonly used length being 50,100 and 200.
Filter Type: This is our propriety smoothing method in order to make the moving averages lag less and influence the way they are calculated slightly. Type 1 being the normal calculation and type 2 being the secret sauce.
Reverse MA Filter: This option allows you to use the moving average in reverse. For example, the strategy will go long when the price is above the moving average. However, if you use the reserve MA Filter, you will go short when the price is above the moving average. This method works best in sideways market where price usually retraces back to the moving average. So, in an anticipation of price reverting back to the moving average, it is a useful piece of option to use during sideway markets.
For more information please check out our website

CryptoEQ SignalAbout the signal:
CryptoEQ™ provides real-time trading signals to help traders and investors with excellent entry and exit points. The CryptoEQ™ has an easy to understand signal that helps traders -along with their own research- determine if a crypto assets price is overbought or oversold. CryptoEQ™ uses proprietary algorithms that take into consideration popular momentum indicators in trading, including, but not limited to Relative Strength Index (RSI) , Stochastic Oscillator (SO) , and Stochastic Relative Strength Index (SRSI) to produce their trading signals.
About momentum indicators:
Momentum indicators help traders and analysts identify where the market will reverse after moving in a direction. The direction changes are identified through divergence between price and momentum.
Using the signal:
Using the signal is straightforward. If a “BUY” signal is triggered it indicates an oversold condition, if a “PULL BACK” signal is triggered it indicates an overbought condition.
About CryptoEQ™:
CryptoEQ™ helps investors and traders make informed investment decisions by providing comprehensive, accurate, and up-to-date research and analysis on crypto-projects. They abide by strict principles and ethics to provide honest information while actively seeking to identify scams, low quality, and nefarious projects. All signals are available at cryptoeq.io. You can find additional content on our social media platforms, which include Instagram, Twitter, Telegram, and LinkedIn.

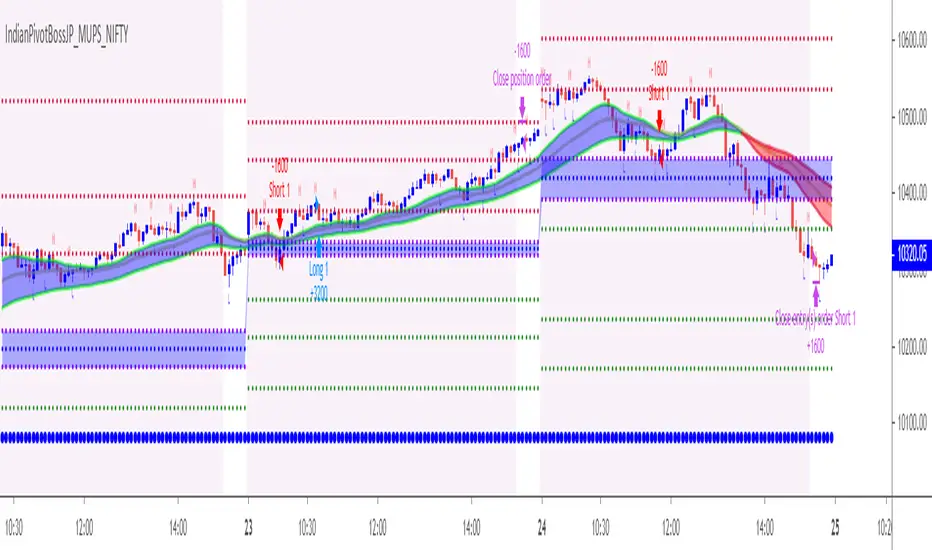
IndianPivotBossJP_MUPS_NIFTYThis is the JP_MUPS Strategy for NIFTY similar to BankNifty which is already there in JP_MUPS.
The best way to enter this strategy is as follows:
Option A :
Direct entry after signal with a stop .
Option B :
Have a Stochastic 14 / 5 / 5.
Once a short signal comes, wait for the Stochastic 14/5/5 to go to the OverBot zone above 70 and enter short after a crossunder, provided that during this period the long signal do not come.
Once a long signal comes, wait for the Stochastic 14/5/5 to go to the Oversold zone below 30 and enter long after a crossover, provided that during this period the short signal do not come.
This method will ensure that your entry is fine tuned.
Crypto Trend Following StrategyThis is the strategy script indicator of Crypto Trend Following Strategy which can be used for back testing. With study script indicator, strategy can be easily automated.
To set alerts, see Crypto Trend Following Study indicator.
Script is using several moving averages to keep you on the right side of the trend. Signals are also filtered based on other indicators to prevent buying already overbought or selling already oversold coins and avoid ranging markets.
MAIN GOAL
Main goal of the strategy is long-term stable profit. No strategy has 100% accuracy therefore there always will be some false signals. But patience pays, with Trend Following Strategy, you will get couple of small loses while waiting to get big wins when coin is trending strongly. As you never know the right time you must sustain and be in all trades to make sure that you will not miss the big move.
BACKTEST
This script is for free to play with so you can back test and see for yourself how the strategy performs on any of your favourite coins.
Strategy is optimized and back tested for USDT and BTC pairs on 6h timeframe but it can be used on any pair and any timeframe.
RISK & REWARD
Strategy does not use safety orders as DCAs usually leads to bag holding sooner or later. It does not use take profit either as strategy will tell you when to buy and when to sell based on the actual market condition.
You should always use stop loss to protect your account from drawdown or even being liquidated.
You can change stop loss or take profit as you like or even back test the strategy with your preferred settings to find what suits you best.
STRATEGY SETTINGS
You can use the strategy script for fine tuning and find best settings for yourself.
If you need any help with settings do not hesitate to ask. I would also appreciate any feedback and ideas how to improve the script.
==== Indicators settings ====
RSI Long < and StochRSI Long <
• used to filter out buy signals of already overbought coins - ( stoch ) RSI must be under set value to fire a BUY signal
RSI Short > and StochRSI Short >
• used to filter out sell signals of already oversold coins - ( stoch ) RSI must be over set value to fire a SELL signal
ADX >
• used to filter out buy or sell signals in ranging markets - ADX must be over set value to fire a BUY or SELL signal
MA Fast and Slow Length
• Two moving averages to indicate an actual short-term trend
Baseline Length & Type
• Baseline is a moving average which confirms the longer-term trend. You can set length and type of the moving average
==== Test period settings ====
• You can set the back tested window
==== Strategy settings =====
• Target Take profit and Stop loss in %
• Only LONG trades – tick if you do not want to calculate SHORT trades in the back test
• Plot key levels on chart – if you use stop loss and/or take profit, you can turn on levels of price to reach (yellow – bought price, red – stop loss – green - take profit)
Back test calculates with commission and fixed order size. You can change these settings on Properties Tab

RSI - Rate of ChangeCode based on RSI lower value crossing over higher value
RSI Rate of Change of different lengths used in all parts of code
ADX and CCI use is limited in V1.0
Script provides 3 RSIs and overbrought and oversold for each of these RSIs. When RSI cross over each other clearly Buy and Sell signals are fired.
Lime is buy and Maroon means sell. Use it along with EMA
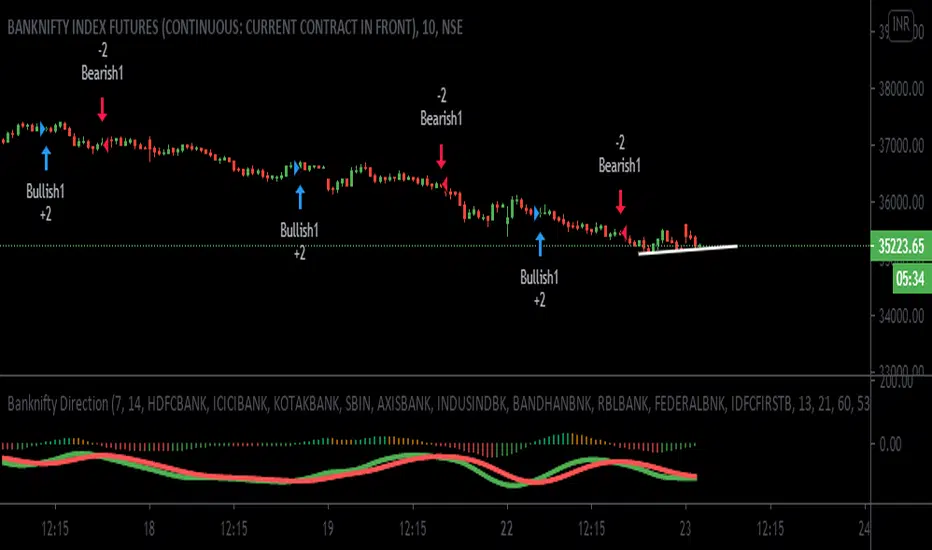
Banknifty-Direction-Bank-StocksBanknifty Direction Bank Stocks is indicator to give Banknifty future direction.
This Indicator is giving signal by taking 11 Major Indian Bank trend into consideration.
This indicator is giving two signal Bullish and Bearish .
Bullish signal can be used for long Banknifty and Bearish signal can be used to close existing Banknifty position and make new short side position and again when Bullish signal come then close existing short position and take new long position and so on.
There is zone area green zone and red zone and central line. Green zone is Bullish area and Red zone is Bearish area.
When ever green line cross over red line then Bullish signal generated and when ever green line cross under red line Bearish Signal generated.
Strong Bullish when Crossover is happening above central line and Strong Bearish when Cross under is happening below central line.
Many Thanks to LazyBear main author, I have used his wave trend function and modified that as per Banknifty index so that we can get better result.
User must keep the default setting for getting better results as results are back tested. If setting changed then result may vary.
I have added here back tested performance user can see those results. I have added commission and slippage as well.
This indicator is available on Subscription.
PM/DM for more information about the script access.
Use the link below to obtain access to this indicator
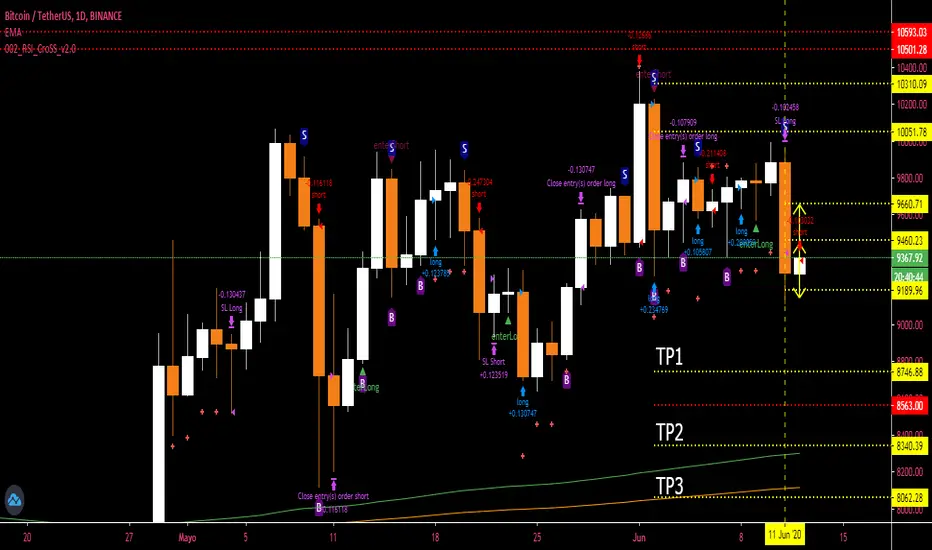
002_RSI_CroSS_v2.0 strategy-----this is a strategy the trend quality based on an RSI, in BINANCE on a daily basis, it only works on a daily basis, it has a trailing stop which removes it from the operation, I hope it works.
-----esta es una estrategia la cualidad de tendencia basada en un RSI, en BINANCE en temporalidad diaria, solo funciona en diario, tiene un trailing stop la cual lo saca de la operacion, espero les sirva