Các chỉ số, chiến lược và thư viện
I modified following script for PST time users. And also, it has only major 4 time zones (London/NewYork/Sydney/Tokyo), and supports 4H/1H/30M/15M/5M scales. Gazzaahh~ TechFXC :-b
This indicator plots the previous day's open, high, low and close levels on the chart Published by Luke (DisciplinedTrader.co.uk)
This indicator will simply plot on your chart the Daily/Weekly/Monthly previous candle levels. The "Auto" mode will allow automatic adjustment of timeframe displayed according to your chart. Otherwise you can select manually. Indicator plots the open/close and colors the high-low range area in the background. Hope this simple indicator will help you ! You...
This is a script to place Heiken Ashi candles on your chart alongside another candle type or more importantly, using the variables from this script, you can build a strategy using Heiken Ashi candles that will depict true/proper entries and exits in a strategy when using the backtest feature. We hope this helps!
Open and close lines. I used a 4 minute timeframe, so the open price goes on 08:28-08:32 central time for the 8:30 open. You can change those times if you want, just copy/paste the script and edit.
This revision of this indicator is an Open Public release. The indicator alert based on JayRogers "Open Close Cross Strategy R2" and is used in conjunction with the revised "Open Close Cross Strategy R5". Description: This indicator alert created for TradingView alarm sub-system (via the alertcondition() function, which currently does not work in a ...
This revision is an open Public release, with just some minor changes. It is a revision of the Strategy "Open Close Cross Strategy R2" originally published by @JayRogers. *** USE AT YOUR OWN RISK *** JayRogers : "There are drawing/painting issues in pinescript when working across resolutions/timeframes that I simply cannot fix here.. I will not be putting any...
Daily, Weekly, Monthly and yearly pivot lines Just the pivot lines without the support and resistance lines
Request for DCC/coondawg71 added support for using session. theres a issue with the session it needs to have the format inverted: (start-end) to (end-start) '0000-1500' to '1500-0000'
Finds gaps. Nuff said Ill make an overlay version
EXPERIMENTAL: previous custom time window median price and current time window open price in a neat package :p
This will place circles on your chart for the opening daily price. If price is above, the circles are green. If price is below, the circles are red. I wanted to be able to see the opening price a bit easier while in smaller time frames. I decided to add the previous daily closing line to the original script. Basically looking for good support / resistance
This will place circles on your chart for the opening daily price. If price is above, the circles are green. If price is below, the circles are red. I wanted to be able to see the opening price a bit easier while in smaller time frames.
Updated Indicator - Plots High, Low Open, Close For Weekly, Daily, 4 Hour, 2 Hour, 1 Hour Current and Previous Sessions Levels. Updated Adds 4 Hour, 2 Hour, 1 Hour levels for Forex and Intra-Day Traders.
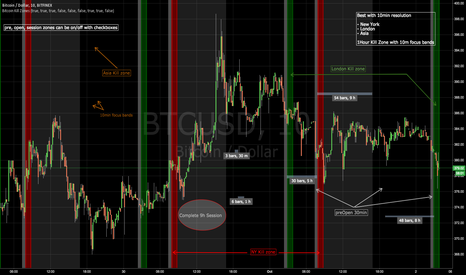
Kill Zones Kill zones are really liquidity events. Many different market participants often come together and act around these events. The activity itself may be event driven (margin calls or options exercise related activity), portfolio management driven (buy-on-close and asset allocation rebalancing orders) or institutionally driven (larger players needing...
GRAB THE LASTEST VERSION HERE: ********************* This indicator shows when the candle is entering New York, London or Asia Kill Zone (open market). gray: 30min before market opens. red, green, orange: First 1 hour with 10min focus bands. silver: complete 30min session market until close. FIX NOTE: Set this hours for Asia to fix the 1 hour...


![[RS]Open Range Breakout V3 EURUSD: [RS]Open Range Breakout V3](https://s3.tradingview.com/x/X6hTOrm7_mid.png)


![[RS]Open Range Breakout V0 USOIL: [RS]Open Range Breakout V0](https://s3.tradingview.com/n/NZReb6HS_mid.png)
![[RS]Temporal Median Price V0 SPX: [RS]Temporal Median Price V0](https://s3.tradingview.com/m/Me0DATbI_mid.png)


