VEGA (Velocity of Efficient Gain Adaptation)VEGA (Velocity of Efficient Gain Adaptation)
VEGA is a momentum oscillator that measures the velocity of an efficiency-weighted adaptive moving average. Unlike traditional momentum indicators that react uniformly to all price movements, VEGA intelligently adapts its sensitivity based on market conditions—responding quickly during trending periods and filtering noise during consolidation.
--------------------------------
What Makes VEGA Different
Efficiency-Driven Adaptation
At its core, VEGA uses the Efficiency Ratio (ER) to distinguish between trending and choppy markets. When price moves efficiently in one direction, VEGA's underlying adaptive MA speeds up to capture the move. When price chops sideways, it slows down to avoid whipsaws. This creates a momentum reading that's inherently cleaner than fixed-period alternatives.
Linear Regression Smoothed Source
VEGA offers an optional LinReg-smoothed price source that blends regular candles with linear regression values. This pre-smoothing reduces noise before it ever enters the calculation, resulting in a histogram that's easier to read without sacrificing responsiveness. The mix ratio lets you dial in exactly how much smoothing you want.
Z-Score Normalization with Dead Zone
Rather than arbitrary oscillator bounds, VEGA normalizes output as standard deviations from the mean. This gives statistically meaningful levels: readings above +2σ or below -2σ represent genuinely extreme momentum. The configurable dead zone (with Snap, Soft Fade, or None modes) filters out insignificant movements near zero, keeping you focused on signals that matter.
--------------------------------
How It Works
1. Source Preparation — Price is smoothed via a LinReg/regular candle blend
2. Efficiency Ratio — Measures directional movement vs total movement over the lookback period
3. Adaptive MA — Applies variable smoothing based on efficiency (fast during trends, slow during chop)
4. Velocity — Calculates the rate of change of the adaptive MA
5. Normalization — Converts to Z-Score (standard deviations) or ATR-normalized percentage
6. Dead Zone — Optionally filters near-zero values to reduce noise
--------------------------------
How To Read VEGA
Signal and Interpretation
Histogram above zero | Bullish momentum
Histogram below zero | Bearish momentum
Bright color | Momentum accelerating
Faded color | Momentum decelerating
Beyond ±1σ bands | Above-average momentum
Beyond ±2σ bands | Extreme momentum (potential reversal zone)
Zero line cross*| Momentum shift
--------------------------------
Key Settings
ER Length — Lookback for efficiency ratio calculation. Higher = smoother, slower adaptation.
Fast/Slow Smoothing — Controls the adaptive MA's responsiveness range. The MA blends between these based on efficiency.
LinReg Settings — Enable smoothed candles and adjust the blend ratio (0 = regular candles, 1 = full LinReg, 0.5 = 50/50 mix).
Z-Score Lookback — Period for calculating mean and standard deviation. Shorter = more reactive normalization.
Dead Zone Type — How to handle near-zero values:
Snap — Hard cutoff to zero
Soft Fade — Gradual reduction toward zero
None — No filtering
Dead Zone Threshold — Values within this Z-Score range are affected by the dead zone setting.
VEGA works on any timeframe and any market. For best results, adjust the ER Length and LinReg settings to match your trading style and the volatility characteristics of your instrument.
Chỉ báo và chiến lược

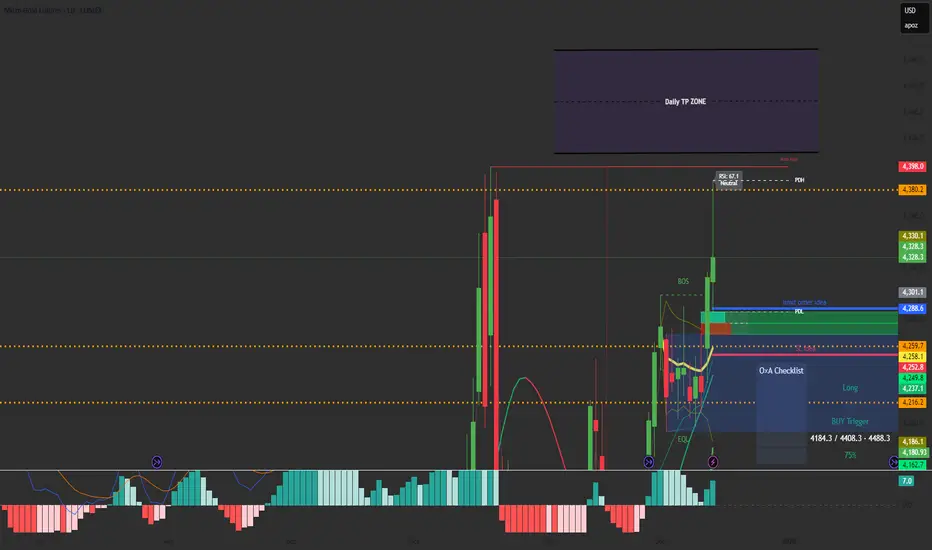
RSI Info WindowRSI Info Window is a minimalist overlay utility that displays the current RSI value and a simple market state label (Overbought, Oversold, or Neutral) directly on the chart. The goal is to provide quick RSI context without using a separate oscillator pane, helping keep the chart clean for price-action, SMC, and structure-based trading.
How it works
Calculates RSI using the selected RSI Length (default 14).
Compares RSI to the Overbought and Oversold thresholds (default 70/30).
Displays a small label on the most recent candle showing:
RSI value
Current state: Overbought / Oversold / Neutral
The label updates in real time as the latest candle forms.
Inputs
RSI Length – Controls RSI sensitivity (default 14)
Overbought Level – RSI threshold for overbought (default 70)
Oversold Level – RSI threshold for oversold (default 30)
How to use
Overbought: RSI above the overbought level — may indicate momentum is extended; watch for continuation vs exhaustion based on your system.
Oversold: RSI below the oversold level — may indicate downside extension; watch for reversal conditions and structure confirmation.
Neutral: RSI between thresholds — often indicates balanced conditions or consolidation.
This indicator is designed as a compact reference tool, not a complete trading system.
Notes
The overlay label is anchored to the most recent candle and refreshes on the last bar.
Intended to save screen space vs. a full RSI subpanel.
Disclaimer
This script is for educational and informational purposes only and does not constitute financial advice. Always use risk management and confirm signals with your broader trading plan.

Volatility Targeting: Single Asset [BackQuant]Volatility Targeting: Single Asset
An educational example that demonstrates how volatility targeting can scale exposure up or down on one symbol, then applies a simple EMA cross for long or short direction and a higher timeframe style regime filter to gate risk. It builds a synthetic equity curve and compares it to buy and hold and a benchmark.
Important disclaimer
This script is a concept and education example only . It is not a complete trading system and it is not meant for live execution. It does not model many real world constraints, and its equity curve is only a simplified simulation. If you want to trade any idea like this, you need a proper strategy() implementation, realistic execution assumptions, and robust backtesting with out of sample validation.
Single asset vs the full portfolio concept
This indicator is the single asset, long short version of the broader volatility targeted momentum portfolio concept. The original multi asset concept and full portfolio implementation is here:
That portfolio script is about allocating across multiple assets with a portfolio view. This script is intentionally simpler and focuses on one symbol so you can clearly see how volatility targeting behaves, how the scaling interacts with trend direction, and what an equity curve comparison looks like.
What this indicator is trying to demonstrate
Volatility targeting is a risk scaling framework. The core idea is simple:
If realized volatility is low relative to a target, you can scale position size up so the strategy behaves like it has a stable risk budget.
If realized volatility is high relative to a target, you scale down to avoid getting blown around by the market.
Instead of always being 1x long or 1x short, exposure becomes dynamic. This is often used in risk parity style systems, trend following overlays, and volatility controlled products.
This script combines that risk scaling with a simple trend direction model:
Fast and slow EMA cross determines whether the strategy is long or short.
A second, longer EMA cross acts as a regime filter that decides whether the system is ACTIVE or effectively in CASH.
An equity curve is built from the scaled returns so you can visualize how the framework behaves across regimes.
How the logic works step by step
1) Returns and simple momentum
The script uses log returns for the base return stream:
ret = log(price / price )
It also computes a simple momentum value:
mom = price / price - 1
In this version, momentum is mainly informational since the directional signal is the EMA cross. The lookback input is shared with volatility estimation to keep the concept compact.
2) Realized volatility estimation
Realized volatility is estimated as the standard deviation of returns over the lookback window, then annualized:
vol = stdev(ret, lookback) * sqrt(tradingdays)
The Trading Days/Year input controls annualization:
252 is typical for traditional markets.
365 is typical for crypto since it trades daily.
3) Volatility targeting multiplier
Once realized vol is estimated, the script computes a scaling factor that tries to push realized volatility toward the target:
volMult = targetVol / vol
This is then clamped into a reasonable range:
Minimum 0.1 so exposure never goes to zero just because vol spikes.
Maximum 5.0 so exposure is not allowed to lever infinitely during ultra low volatility periods.
This clamp is one of the most important “sanity rails” in any volatility targeted system. Without it, very low volatility regimes can create unrealistic leverage.
4) Scaled return stream
The per bar return used for the equity curve is the raw return multiplied by the volatility multiplier:
sr = ret * volMult
Think of this as the return you would have earned if you scaled exposure to match the volatility budget.
5) Long short direction via EMA cross
Direction is determined by a fast and slow EMA cross on price:
If fast EMA is above slow EMA, direction is long.
If fast EMA is below slow EMA, direction is short.
This produces dir as either +1 or -1. The scaled return stream is then signed by direction:
avgRet = dir * sr
So the strategy return is volatility targeted and directionally flipped depending on trend.
6) Regime filter: ACTIVE vs CASH
A second EMA pair acts as a top level regime filter:
If fast regime EMA is above slow regime EMA, the system is ACTIVE.
If fast regime EMA is below slow regime EMA, the system is considered CASH, meaning it does not compound equity.
This is designed to reduce participation in long bear phases or low quality environments, depending on how you set the regime lengths. By default it is a classic 50 and 200 EMA cross structure.
Important detail, the script applies regime_filter when compounding equity, meaning it uses the prior bar regime state to avoid ambiguous same bar updates.
7) Equity curve construction
The script builds a synthetic equity curve starting from Initial Capital after Start Date . Each bar:
If regime was ACTIVE on the previous bar, equity compounds by (1 + netRet).
If regime was CASH, equity stays flat.
Fees are modeled very simply as a per bar penalty on returns:
netRet = avgRet - (fee_rate * avgRet)
This is not realistic execution modeling, it is just a simple turnover penalty knob to show how friction can reduce compounded performance. Real backtesting should model trade based costs, spreads, funding, and slippage.
Benchmark and buy and hold comparison
The script pulls a benchmark symbol via request.security and builds a buy and hold equity curve starting from the same date and initial capital. The buy and hold curve is based on benchmark price appreciation, not the strategy’s asset price, so you can compare:
Strategy equity on the chart symbol.
Buy and hold equity for the selected benchmark instrument.
By default the benchmark is TVC:SPX, but you can set it to anything, for crypto you might set it to BTC, or a sector index, or a dominance proxy depending on your study.
What it plots
If enabled, the indicator plots:
Strategy Equity as a line, colored by recent direction of equity change, using Positive Equity Color and Negative Equity Color .
Buy and Hold Equity for the chosen benchmark as a line.
Optional labels that tag each curve on the right side of the chart.
This makes it easy to visually see when volatility targeting and regime gating change the shape of the equity curve relative to a simple passive hold.
Metrics table explained
If Show Metrics Table is enabled, a table is built and populated with common performance statistics based on the simulated daily returns of the strategy equity curve after the start date. These include:
Net Profit (%) total return relative to initial capital.
Max DD (%) maximum drawdown computed from equity peaks, stored over time.
Win Rate percent of positive return bars.
Annual Mean Returns (% p/y) mean daily return annualized.
Annual Stdev Returns (% p/y) volatility of daily returns annualized.
Variance of annualized returns.
Sortino Ratio annualized return divided by downside deviation, using negative return stdev.
Sharpe Ratio risk adjusted return using the risk free rate input.
Omega Ratio positive return sum divided by negative return sum.
Gain to Pain total return sum divided by absolute loss sum.
CAGR (% p/y) compounded annual growth rate based on time since start date.
Portfolio Alpha (% p/y) alpha versus benchmark using beta and the benchmark mean.
Portfolio Beta covariance of strategy returns with benchmark returns divided by benchmark variance.
Skewness of Returns actually the script computes a conditional value based on the lower 5 percent tail of returns, so it behaves more like a simple CVaR style tail loss estimate than classic skewness.
Important note, these are calculated from the synthetic equity stream in an indicator context. They are useful for concept exploration, but they are not a substitute for professional backtesting where trade timing, fills, funding, and leverage constraints are accurately represented.
How to interpret the system conceptually
Vol targeting effect
When volatility rises, volMult falls, so the strategy de risks and the equity curve typically becomes smoother. When volatility compresses, volMult rises, so the system takes more exposure and tries to maintain a stable risk budget.
This is why volatility targeting is often used as a “risk equalizer”, it can reduce the “biggest drawdowns happen only because vol expanded” problem, at the cost of potentially under participating in explosive upside if volatility rises during a trend.
Long short directional effect
Because direction is an EMA cross:
In strong trends, the direction stays stable and the scaled return stream compounds in that trend direction.
In choppy ranges, the EMA cross can flip and create whipsaws, which is where fees and regime filtering matter most.
Regime filter effect
The 50 and 200 style filter tries to:
Keep the system active in sustained up regimes.
Reduce exposure during long down regimes or extended weakness.
It will always be late at turning points, by design. It is a slow filter meant to reduce deep participation, not to catch bottoms.
Common applications
This script is mainly for understanding and research, but conceptually, volatility targeting overlays are used for:
Risk budgeting normalize risk so your exposure is not accidentally huge in high vol regimes.
System comparison see how a simple trend model behaves with and without vol scaling.
Parameter exploration test how target volatility, lookback length, and regime lengths change the shape of equity and drawdowns.
Framework building as a reference blueprint before implementing a proper strategy() version with trade based execution logic.
Tuning guidance
Lookback lower values react faster to vol shifts but can create unstable scaling, higher values smooth scaling but react slower to regime changes.
Target volatility higher targets increase exposure and drawdown potential, lower targets reduce exposure and usually lower drawdowns, but can under perform in strong trends.
Signal EMAs tighter EMAs increase trade frequency, wider EMAs reduce churn but react slower.
Regime EMAs slower regime filters reduce false toggles but will miss early trend transitions.
Fees if you crank this up you will see how sensitive higher turnover parameter sets are to friction.
Final note
This is a compact educational demonstration of a volatility targeted, long short single asset framework with a regime gate and a synthetic equity curve. If you want a production ready implementation, the correct next step is to convert this concept into a strategy() script, add realistic execution and cost modeling, test across multiple timeframes and market regimes, and validate out of sample before making any decision based on the results.

RSI Info WindowRSI Info Window is a minimalist overlay utility that displays the current RSI value and a simple market state label (Overbought, Oversold, or Neutral) directly on the chart. The goal is to provide quick RSI context without using a separate oscillator pane, helping keep the chart clean for price-action, SMC, and structure-based trading.
How it works
Calculates RSI using the selected RSI Length (default 14).
Compares RSI to the Overbought and Oversold thresholds (default 70/30).
Displays a small label on the most recent candle showing:
RSI value
Current state: Overbought / Oversold / Neutral
The label updates in real time as the latest candle forms.
Inputs
RSI Length – Controls RSI sensitivity (default 14)
Overbought Level – RSI threshold for overbought (default 70)
Oversold Level – RSI threshold for oversold (default 30)
How to use
Overbought: RSI above the overbought level — may indicate momentum is extended; watch for continuation vs exhaustion based on your system.
Oversold: RSI below the oversold level — may indicate downside extension; watch for reversal conditions and structure confirmation.
Neutral: RSI between thresholds — often indicates balanced conditions or consolidation.
This indicator is designed as a compact reference tool, not a complete trading system.
Notes
The overlay label is anchored to the most recent candle and refreshes on the last bar.
Intended to save screen space vs. a full RSI subpanel.
Disclaimer
This script is for educational and informational purposes only and does not constitute financial advice. Always use risk management and confirm signals with your broader trading plan.
5-Period Average of Returns (Close)This indicator calculates the 5-period average of returns of the closing price, providing a detrended, zero-centered oscillator ideal for cycle analysis and timing.
Key Features:
Detrended: Centers around zero to clearly reveal cyclical patterns.
Cycle-friendly: Highlights peaks and troughs for measuring dominant cycles.
Flexible: Can be applied to multiple timeframes (daily, weekly, intraday).
Zero Line Reference: Quickly identify directional shifts in average returns.
Foundation for Advanced Analysis: Can be combined with RSI, statistical bands, or multi-timeframe studies.
Use this indicator to:
Identify dominant cycles and their phase
Measure cycle length and rhythm
Assist in entry and exit timing based on average-return oscillations
Detrend price data for more precise technical and cyclical analysis

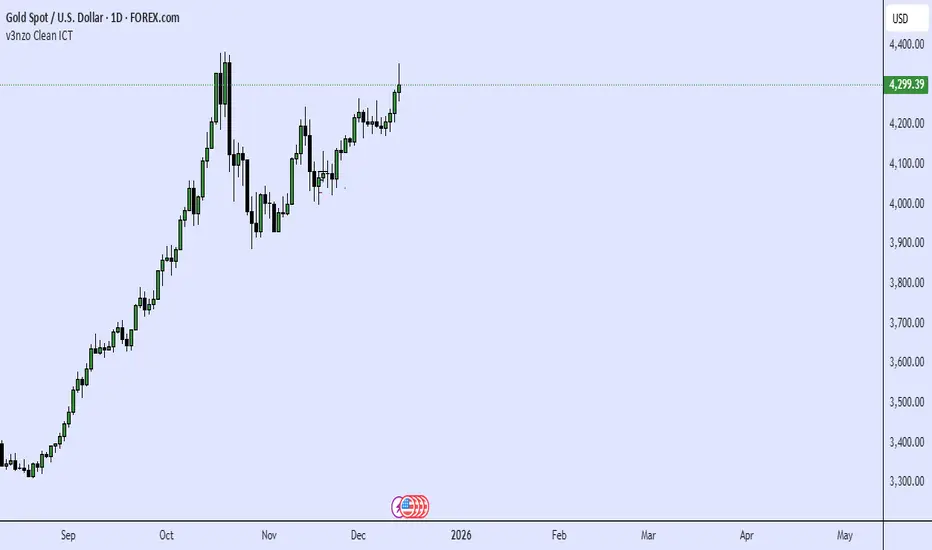
Quarterly Theory The Quarterly Theory indicator is a refined analytical tool that applies the ICT (Inner Circle Trader) framework and fractal time principles. It divides market time into structured quarterly cycles, anchored by the True Open of each period, to provide precise signals for trade entry and exit. This approach is consistently effective across all timeframes—from yearly and monthly charts down to 90-minute sessions.
The core model defines four distinct market phases within each cycle:
Q1 – Accumulation: A consolidation phase where the market builds a base for the next move.
Q2 – Manipulation (Judas Swing): Characterized by deceptive, rapid price action designed to trap traders before a true trend emerges.
Q3 – Distribution: A period of high volatility as positions are unwound and transferred.
Q4 – Continuation/Reversal: The cycle concludes with the established trend either extending or reversing.
By leveraging smart algorithms, the indicator analyzes these phases to detect critical market structures such as liquidity zones, stop-runs, and high-probability price patterns. This synthesis of Quarterly Theory, fractal timing, and liquidity analysis delivers a data-driven edge, empowering traders to decode complex market behavior and execute informed, strategic trades.

GoldHook Reversal ProGoldHook Reversal Pro v7 is an advanced market structure indicator designed to identify high-probability turning points. It automatically detects where price is accumulating—and monitors for specific momentum shifts that signal a valid Breakout or Reversal. By filtering out market noise with its "Smart Adaptive" logic, it helps traders distinguish between false moves and genuine trend opportunities, providing clear entry signals with built-in risk management targets.

IFVGs [NINE]Overview
The IFVG Indicator is a precision-engineered tool designed to identify and display Inversion Fair Value Gaps (IFVGs), a powerful price action concept rooted in ICT (Inner Circle Trader) methodology. This indicator automatically detects when price closes through an existing Fair Value Gap, causing the zone to "invert" and flip its directional bias, signaling potential areas of institutional interest for future price reactions.
What is an Inversion Fair Value Gap?
A Fair Value Gap (FVG) is a three-candle pattern where a gap exists between the wicks of the first and third candles, representing an imbalance in price delivery. These zones often act as magnets for price to return and "fill" the inefficiency.
An Inversion Fair Value Gap (IFVG) occurs when price doesn't just tap into an FVG, it closes through it with a candle body. This "inversion" transforms the zone:
A Bullish FVG that gets closed through becomes a Bearish IFVG (potential resistance/supply zone)
A Bearish FVG that gets closed through becomes a Bullish IFVG (potential support/demand zone)
IFVGs represent areas where the market has shown its hand — institutional order flow has aggressively moved through a prior inefficiency, and the inverted zone now becomes a point of interest for potential reversals or continuations.
Key Features
Automatic IFVG Detection
The indicator continuously monitors for Fair Value Gaps and automatically converts them to IFVGs when price body closes through the zone. No manual identification required.
Multiple Display Styles
Choose from four distinct visualization modes to match your chart aesthetic:
Level — Clean, minimal single line at the IFVG extreme (top for bullish, bottom for bearish)
Normal — Filled zone with dashed borders and dot label
Minimalist — High/low boundary lines with connecting link
Classic — Filled box with 50% midline only
Full Customization
Independent colors for bullish and bearish IFVGs
Adjustable transparency for zone fills
Optional 50% midline (Consequent Encroachment level)
Flexible label styles: "IFVG" or "+/−" notation
Multiple label sizes: Tiny, Small, Normal, Large
Smart Extension Options
Extend to Current Bar — Zones dynamically extend as price progresses
Extend to Confirmation — Zones end at the bar where inversion occurred
Manual Offset — Fine-tune extension length in bars
Clustered IFVG Filter
Prevents chart clutter by ensuring only one IFVG per direction forms within a 5-bar cooldown period. When a single candle closes through multiple FVGs, only the first IFVG of that directional series is displayed — eliminating redundant signals and keeping your chart clean.
FVG Lookback Control
Limit which FVGs can become IFVGs based on their age. Options include 10, 50, 100, 200, or 300 bars. This filters out old, stale FVGs that may create less relevant inversions.
Session Time Filters
Optional time-based filtering allows you to focus on specific trading sessions:
Configurable session windows (e.g., 9:30 AM - 12:00 PM)
Support for two independent session filters
Multiple timezone options including New York, London, Tokyo, and more
Volume Imbalance Detection
Optionally include Volume Imbalances (VIs) — gaps between candle bodies rather than wicks — expanding the scope of detectable inefficiencies.
Invalidation Tracking
IFVGs are automatically invalidated when price closes back through the zone in the opposite direction, with optional display of invalidated zones.
How to Use
Entry Confirmation
IFVGs serve as areas for trade entries. When price returns to a confirmed IFVG:
Bullish IFVG — Look for long entries as price taps the zone from above
Bearish IFVG — Look for short entries as price taps the zone from below
Settings Reference
Inversion Fair Value Gaps
Show IFVGs? — Master toggle for IFVG display
Style — Level, Normal, Minimalist, or Classic
Transparency % — Zone fill opacity (0-100)
Historical Display — Maximum IFVGs to show per direction
Bullish/Bearish Colors — Independent color selection
Show Invalidated? — Display IFVGs that have been invalidated
Extend IFVGs? — Enable dynamic zone extension
Extension Mode — Current Bar or Confirmation
Manual Offset — Additional bars to extend
High/Low Lines — Show boundary lines (Minimalist style)
50% Midline — Show Consequent Encroachment level
Show Labels? — Display zone labels
Label Style — IFVG or +/− notation
FVG Lookback — Maximum age of FVGs that can invert
Clustered Filter — Prevent multiple same-direction IFVGs in quick succession
Volume Imbalances — Include body gaps in detection
Session Filters
Enable 1st/2nd Time Filter — Activate session filtering
Session Times — Define active trading windows
Timezone — Reference timezone for session calculations
Disclaimer
This indicator is provided for educational and informational purposes only. It is not financial advice, and nothing contained herein constitutes a recommendation, solicitation, or offer to buy or sell any securities, options, or other financial instruments.
Trading involves substantial risk of loss and is not suitable for all investors. Past performance is not indicative of future results. You should carefully consider your investment objectives, level of experience, and risk appetite before making any trading decisions.
The developer of this indicator makes no representations or warranties regarding the accuracy, completeness, or reliability of the information provided. You are solely responsible for your own trading decisions and any profits or losses that may result.
Always conduct your own research and consider seeking advice from a licensed financial professional before trading.

MWTI Introduction onChartMarket Wave TransIndex (MWTI)
Colors show when to attack and when to rest.
• Background = current market wave
• Masked zones = low momentum (rest)
• Upper dots = higher timeframe bias
No symbols, no predictions.
Just read the market state.
Works on any market, any timeframe.
Introduction (sample) is optimized for the 15m chart.
Try it on any market in 15m.
-------------------------------------------------------

Neural Markets [Institutional]Neural Markets is a proprietary technical analysis algorithm designed for structural trend identification and volatility filtering.
The script combines two core engines to generate high-probability market insights:
1. Volatility Engine:
Uses dynamic standard deviation bands (Volatility Bands) adjusted by a proprietary multiplier to filter out market noise. The logic adapts to expanding or contracting market phases to reduce false signals during consolidation.
2. Trend Filter (Smart Mode):
Integrates an Institutional EMA-based logic (Exponential Moving Average) to determine the macro-bias. Signals are only generated when price action aligns with the dominant trend, filtering out counter-trend noise.
KEY FEATURES:
- Non-Repainting Logic: All signals are permanent once the candle closes.
- Military Dashboard (HUD): Real-time display of Trend, Volatility, and Algorithm Status.
- Visual Cloud: Instant identification of the support/resistance zones based on volatility.
- Clean Chart: Optimized for professional use, minimizing visual clutter.
WARNING:
This is an Invite-Only script. Access is restricted to authorized members for educational and analytical purposes only. It does not constitute financial advice.
Clean chart visualization suitable for professional trading.
WARNING: This is a restricted access tool (Invite-Only). It is strictly for educational and analytical purposes.

Daily OpenThis is a protected/private script. To request access, please provide:
TradingView username (required)
Your main market(s) and timeframe(s)
Intended use (education / backtesting / live trading)
(Optional) Any proof of eligibility if applicable
Once your request is reviewed, access will be granted to the username provided.
Usage Terms:
No copying, modifying, distributing, publishing, or reselling of this script or its logic
Access is granted to approved accounts only
This script is a tool for analysis and not financial advice; you assume all trading risks
The author reserves the right to update the script or revoke access at any time

CFO Y+QOperating Cash Flow (CFO) – Annual + Quarterly
This indicator plots a company’s Operating Cash Flow (CFO) for both Annual (FY) and Quarterly (FQ) reporting periods in a single pane. CFO represents the net cash generated (or used) by the firm’s core operations during the period, as reported in the cash flow statement.
How to read it:
Positive CFO generally indicates the business is generating cash from operations.
Negative CFO may indicate cash burn from operations, often due to operating losses or adverse working-capital movements.
Viewing FY and FQ together helps you compare long-term operating cash generation with shorter-term quarterly volatility.
Scaling:
The indicator includes an optional scaling setting (Raw / Millions / Billions / Auto) to improve readability. In Auto mode, both series are displayed using the same scale for consistent comparison.

Sideways Zone Breakout 📘 Sideways Zone Breakout – Indicator Description
Sideways Zone Breakout is a visual market-structure indicator designed to identify low-volatility consolidation zones and highlight potential breakout opportunities when price exits these zones.
This indicator focuses on detecting periods where price trades within a tight range, often referred to as sideways or consolidation phases, and visually marks these zones directly on the chart for clarity.
🔍 Core Concept
Markets often spend time moving sideways before making a directional move.
This indicator aims to:
Detect price compression
Visually highlight the sideways zone
Signal when price breaks above or below the zone boundaries
Instead of predicting direction, it simply reacts to range expansion after consolidation.
⚙️ How the Indicator Works
1️⃣ Sideways Zone Detection
The indicator looks back over a user-defined number of candles
It calculates the highest high and lowest low within that window
If the total price range remains within a defined percentage of the current price, the market is considered sideways
This helps filter out trending and highly volatile conditions.
2️⃣ Visual Zone Representation
When a sideways condition is detected:
A clear price zone is drawn between the recent high and low
The zone is displayed using a soft gradient fill for better visibility
Outer borders are added to enhance zone clarity without cluttering the chart
This makes consolidation areas easy to spot at a glance.
3️⃣ Breakout Identification
Once a sideways zone is active:
A bullish breakout is marked when price closes above the upper boundary
A bearish breakout is marked when price closes below the lower boundary
Directional arrows and labels are plotted directly on the chart to indicate these events.
📊 Visual Elements Included
Sideways consolidation zones with gradient fill
Upper and lower zone boundaries
Buy and Sell arrows on breakout
Optional text labels for clear interpretation
All visuals are designed to remain lightweight and readable on any chart theme.
🔧 User Inputs
Sideways Lookback (candles): Controls how many past candles are used to define the range
Max Range % (tightness): Determines how tight the range must be to qualify as sideways
Adjusting these inputs allows users to adapt the indicator to different instruments and timeframes.
📈 Usage Guidelines
Can be applied to any market or timeframe
Works well as a context or confirmation tool
Best used alongside volume, trend, or risk management tools
Signals should be validated with proper trade planning
⚠️ Disclaimer
This indicator is provided as open-source for educational and analytical purposes only.
It does not generate trade recommendations or guarantee outcomes.
Market conditions vary, and users are responsible for their own trading decisions.

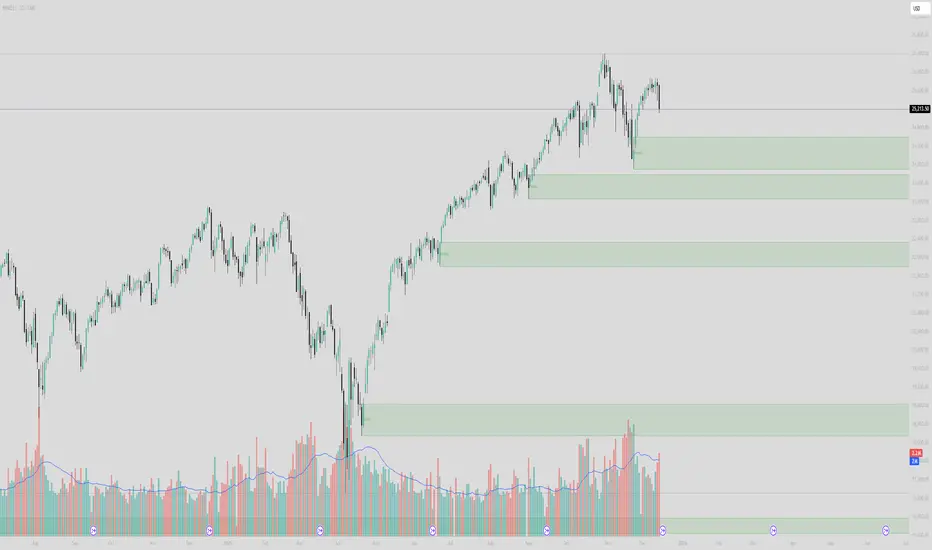
Institutional Supply/Demand (Unmitigated)Title: Institutional Supply/Demand (Unmitigated)
What it does: This indicator automatically detects and highlights Fresh Institutional Supply and Demand Zones based on market structure (Swing Highs and Swing Lows). It is designed to keep your chart clean by only showing levels that have not yet been tested.
Key Features:
Auto-Detection:
Red Boxes (Supply): Appear at major Swing Highs. These represent potential Sell Limit orders from institutions.
Green Boxes (Demand): Appear at major Swing Lows. These represent potential Buy Limit orders.
Mitigation Logic (The "Clean-Up"):
The script actively monitors price action.
If price touches a box, the box is instantly deleted.
This ensures you are never looking at "old" or "used" levels. If a box is visible on your chart, it means price has never returned to that level since it was created.
Customizable Structure:
Structure Lookback: Adjusts how sensitive the detection is.
Setting 5 (Default): Finds major, significant structure points.
Setting 3: Finds smaller, internal structure points (more zones).
How to Trade:
Wait for Price to Return: Watch for price to approach a visible Red or Green box.
Reaction: Since these are "Fresh" levels, look for a rejection (wick) or a reversal pattern as soon as price taps the zone.
No Clutter: You don't need to manually delete old lines; the script does it for you.
Quantum X StrategyQuantum X Strategy is a structured market-behavior based trading model developed for Midcap Nifty on the 15-minute timeframe.
It focuses on identifying directional strength, momentum alignment, and price participation using a multi-factor confirmation approach.
Rather than relying on a single indicator, the strategy evaluates multiple dimensions of price movement to determine whether the market environment is favorable for participation. This helps in avoiding random entries during low-quality or sideways conditions.
🔍 Conceptual Framework
The strategy dynamically observes:
Momentum expansion and contraction
Trend participation strength
Directional consistency over recent price action
Each market condition contributes to an internal decision process, allowing trades only when sufficient alignment is present. This approach helps filter out noise and improves trade selectivity.
📊 Trade Execution Philosophy
Trades are initiated only when market structure shows clear directional intent
Both bullish and bearish opportunities are evaluated independently
Positions are exited when momentum balance weakens or returns to a neutral state
No over-trading during indecisive phases
The system is designed to stay inactive during uncertain market conditions, which is a key part of its risk-aware behavior.
🕒 Backtesting Scope
For consistency and reliability, the strategy logic is activated only from January 2024 onward, ensuring analysis is focused on recent market behavior rather than outdated volatility patterns.
⚙️ Usage Guidelines
Instrument: MIDCAPNIFTY
Timeframe: 15 Minutes
Suitable for intraday and short-term positional observation
Works best when combined with disciplined risk management
⚠️ Disclaimer
This strategy is provided strictly for educational and research purposes.
Market conditions change, and past performance does not guarantee future results. Users should always forward-test and apply their own risk management before live use.

Suspension Blocks [TakingProphets]-----------------------------------------------------------------------------------------------
SUSPENSION BLOCKS
-----------------------------------------------------------------------------------------------
Suspension Blocks are a new ICT concept designed to highlight price inefficiencies created by displacement and body-to-body gaps across a precise 3-candle sequence. These structures represent areas where price was temporarily “suspended” before continuation, often acting as high-probability reaction zones on future revisits.
This indicator automatically detects, visualizes, manages, and invalidates Suspension Blocks in real time, while intelligently limiting chart clutter to only the most relevant structures near current price.
-----------------------------------------------------------------------------------------------
PURPOSE AND SCOPE
-----------------------------------------------------------------------------------------------
- Detect ICT-style Bullish and Bearish Suspension Blocks using strict 3-candle body relationships
- Require measurable body-to-body separation defined in true ticks (instrument-aware)
- Automatically draw and extend Suspension Blocks forward in time
- Invalidate blocks only when price decisively closes beyond the defining boundary
- Optionally display Consequent Encroachment (50% equilibrium) within each block
- Limit on-chart visibility to the closest N blocks per side relative to current price
- Provide session-based, directional alerting for new block formations
-----------------------------------------------------------------------------------------------
WHAT IS A SUSPENSION BLOCK
-----------------------------------------------------------------------------------------------
A Suspension Block is a 3-candle displacement pattern defined by body gaps on both sides of a middle candle.
Bullish Suspension Block logic:
- Candle 1 close is BELOW Candle 2 open by at least the Minimum Body Separation
- Candle 3 open is ABOVE Candle 2 close by at least the Minimum Body Separation
- Candle 3 open is ABOVE Candle 1 close to ensure a valid vertical range
- The block spans from Candle 1 close (low) to Candle 3 open (high)
- The block remains valid until price CLOSES below Candle 1 close
Bearish Suspension Block logic (mirror conditions):
- Candle 1 close is ABOVE Candle 2 open by at least the Minimum Body Separation
- Candle 3 open is BELOW Candle 2 close by at least the Minimum Body Separation
- Candle 3 open is BELOW Candle 1 close to ensure a valid vertical range
- The block spans from Candle 1 close (high) to Candle 3 open (low)
- The block remains valid until price CLOSES above Candle 1 close
All calculations are performed using true tick values via `syminfo.mintick` to ensure precision across instruments.
-----------------------------------------------------------------------------------------------
GENERAL SETTINGS
-----------------------------------------------------------------------------------------------
- Minimum Body Separation (ticks)
- Defines the minimum required body-to-body gap between candles
- Measured in true ticks (0.25 = quarter tick, 1.0 = full tick, etc.)
- Max Visible Blocks per Side
- Limits the number of bullish and bearish blocks displayed
- Only the closest blocks to current price remain visible
-----------------------------------------------------------------------------------------------
VISUALIZATION SETTINGS
-----------------------------------------------------------------------------------------------
- Bullish Suspension Blocks
- Toggle bullish block visibility
- Custom fill color with adjustable transparency
- Optional border with selectable line style (Solid / Dashed / Dotted)
- Bearish Suspension Blocks
- Toggle bearish block visibility
- Custom fill color with adjustable transparency
- Optional border with selectable line style (Solid / Dashed / Dotted)
- Consequent Encroachment (CE)
- Optional 50% equilibrium line drawn inside each block
- Custom color and line style
- Automatically extends with the block
Blocks dynamically extend to the current bar and are hidden or shown based on proximity to price to keep the chart clean and actionable.
-----------------------------------------------------------------------------------------------
BLOCK MANAGEMENT & INVALIDATION
-----------------------------------------------------------------------------------------------
- Each block is stored persistently and extended forward bar-by-bar
- Bullish blocks are invalidated only when price CLOSES below the block low
- Bearish blocks are invalidated only when price CLOSES above the block high
- Invalidated blocks and their CE lines are automatically removed
- Visibility logic ensures only the most relevant structures are emphasized
-----------------------------------------------------------------------------------------------
ALERT SYSTEM
-----------------------------------------------------------------------------------------------
- Optional alerts when new Suspension Blocks form
- Independent toggles for bullish and bearish alerts
- Fully customizable alert messages
- Alerts can be restricted to specific trading sessions:
- Session 1 (default: 09:30–16:00 NY)
- Session 2 (optional)
- Session 3 (optional)
- Alerts include ticker and timeframe context automatically
-----------------------------------------------------------------------------------------------
BEST USE CASES
-----------------------------------------------------------------------------------------------
- High-probability reaction zones after displacement
- Confluence with liquidity, PD arrays, and market structure
- Execution refinement within ICT-based models
- Intraday and higher-timeframe contextual bias
- Clean, rules-based identification of inefficiency zones
-----------------------------------------------------------------------------------------------
DISCLAIMER
-----------------------------------------------------------------------------------------------
This indicator is provided for educational and analytical purposes only. It does not constitute financial advice. Trading involves risk, and past performance is not indicative of future results.
© TakingProphets
-----------------------------------------------------------------------------------------------

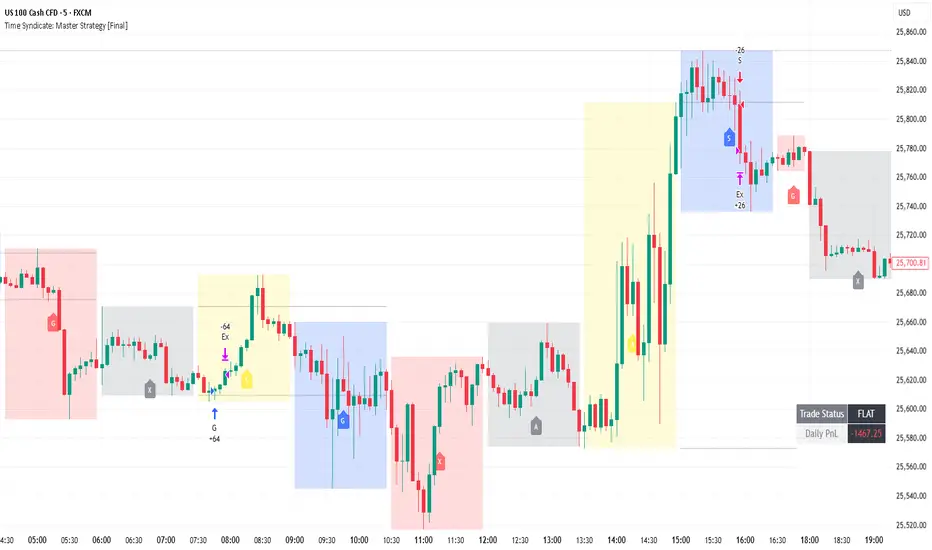
Time Syndicate: Prop Firm SpecialTime Syndicate – Prop-Firm Special (Exit-Focused Edition)
Overview
Time Syndicate – Master Strategy is a non-repainting, cycle-aware execution framework designed to trade structured market phases rather than random price movement.
This version has been specifically updated to focus on exit efficiency , trade management, and controlled trade churn.
The strategy is built to align trades with time-based market behavior and liquidity expansion, without relying on indicator stacking or repainting logic.
What This Version Is Optimized For
This update emphasizes:
• More structured exits
• Increased trade churning
• Improved realized profitability
• Mechanical trailing stop execution
The goal is not to increase entries, but to extract more value from correct ones .
Recommended Markets
• EUR/USD
• NASDAQ (NQ / US100 Cash CFD)
This strategy is primarily designed and tested for these instruments.
Recommended Cycles & Timeframes
90-Minute Cycle → Use 1-Minute chart
Session Cycle → Use 5-Minute chart
Do not mismatch cycle selection and chart timeframe.
Important Settings (Do Not Over-Optimize)
• Exit Mode: Trailing Stop (Default & Recommended)
• Max Trades Per Cycle: 1
• Target: 1 : 1.5
• Most other settings should remain unchanged
This is not a parameter-tuning strategy.
Trade Behavior
• Trade Status remains FLAT until a valid trade is triggered
• After entry, the dashboard displays:
– Entry Price
– Initial Stop Loss
– Trailing Trigger Level
– Live Trailing Stop (once activated)
In most cases, the entry candle’s low/high will act as the initial stop loss.
Exit Logic
Trailing Stop Mode
• Trailing activates only after price reaches the required expansion level
• Trailing is mechanical and non-emotional
• Live trailing stop updates are shown clearly on the chart
Fixed Target Mode
• Available for testing purposes
• Not recommended for live execution
Non-Repainting Logic
• All zones, cycles, and trade logic are non-repainting
• No historical shifting
• What appears live is final
Known Limitations (Current Version)
• Quantity calculation can be aggressive, especially on 1-minute charts
• Manual quantity is recommended for now
• Not every valid signal should be traded
These will be refined in future updates.
Recommended Trading Window
For US100 Cash CFD:
4:00 PM – 8:00 PM IST
Outside this window, liquidity behavior becomes inconsistent.
Advanced Usage Tip
Download strategy trade data and analyze:
• Time of day
• Cycle performance
• Trade outcomes
Use this data to determine the most effective trading hours for your instrument.
Purpose of This Strategy
This is not a signal-spamming indicator.
It is a professional execution framework built to:
• Enforce discipline
• Improve exit quality
• Reduce emotional decision-making
• Align trades with structured market phases
Final Note
This strategy does not predict the market.
It waits, reacts, and extracts.
Use it with patience, proper risk control, and respect for time-based structure.

Smart Money Bot [MTF Confluence Edition]Uses multi-time frame analysis and supply and demand strategy.
Best used when swing trading.

GNC Trading - Corr FinderGNC Trading - Correlation Finder lets you easily find the correlation between currency pairs.
Indicator Settings:
Series 1 Symbol: Fixed currency pair to compare
Series 2 Symbol: Leading currency pair to compare
Time Resolution: 1 day (Do not change)
Return Window: How many bars of logarithmic change will be calculated. 30, 60, or 90 attempts can be made. If 30 is selected, the change to the last candle 30 days prior will be calculated.
Correlation Window: How many bars will be scanned. 155 (Short term) or 365 (Long term) can be used.
Example: Scans 155 bars according to the entered return. 155 bars represents the 30-day change of each bar compared to the past.
Series 2 Lag: Does the added symbol in Series 2 have a leading character? You can add entries 0 - 30 - 60 - 90 - 120 - 180 here and use the 2nd symbol as a leading character.
- - - - - - - - - - - - - - - - - - - - - - -

MNQ Quant Oscillator Lab v2.1MNQ Quant Oscillator Lab v2.1 — Clean Namespaces
Adaptive LinReg Oscillator + Auto Regime Switching + MTF Confirmation + MOEP Gate + Research Harness
MNQ Quant Oscillator Lab is a research-grade oscillator framework designed for MNQ/NQ (and other liquid futures/indices) on 1-minute and intraday timeframes. It combines a linear-regression-based detrended oscillator with quant-style normalization, adaptive parameterization, regime switching, multi-timeframe confirmation, and an optional MOEP (Minimum Optimal Entry Point) gate. The goal is to provide a customizable signal laboratory that is stable in real time, non-repainting by default, and suitable for systematic experimentation.
What this indicator does
1) Core oscillator (quant-normalized)
The indicator computes a linear regression (LinReg) detrended signal and expresses it as a z-scored oscillator for portability across volatility regimes and assets. You can switch the oscillator “transform family” via Oscillator type:
LinReg Residual / Residual Z: detrended residual (mean-reversion sensitive)
LinReg Slope Z: regression slope (trend-derivative sensitive)
LogReturn Z: log-return oscillator (momentum-style)
VolNorm Return Z: volatility-normalized returns (risk-scaled)
This yields a single oscillator that is comparable over time, not tied to raw point values.
2) Adaptive length (dynamic calibration)
When enabled, the regression length is automatically adapted using a volatility-regime proxy (ATR% z-scored → logistic mapping). High volatility typically shortens the effective lookback; low volatility allows longer lookbacks. This helps the oscillator remain responsive during expansions while staying stable in compressions.
Important: the adaptive logic is implemented with safe warmup behavior, so it will not throw NaN errors on early bars.
3) Adaptive thresholds (dynamic bands)
Instead of static overbought/oversold levels, the indicator can compute dynamic upper/lower bands from the oscillator’s own distribution (rolling mean + sigma). This creates thresholds that adjust automatically to regime changes.
4) Auto regime switching (Trend vs Mean Reversion)
With Auto regime switch enabled, the indicator selects whether to behave as a Trend system or a Mean Reversion system using an interpretable heuristic:
Trend regime when EMA-spread is strong relative to ATR and ATR is rising
Otherwise defaults to Mean Reversion
This prevents running mean-reversion logic in trend breakouts and reduces “mode mismatch.”
5) Multi-timeframe (MTF) confirmation (optional)
MTF confirmation can be enabled to require that the higher timeframe oscillator sign aligns with the direction of the signal. This is useful for reducing noise on MNQ 1m by requiring higher-timeframe structure agreement (e.g., 5m or 15m).
6) MOEP Gate (optional “institutional” filter)
The MOEP gate is a confluence score filter intended to reduce low-quality signals. It aggregates multiple components into a 0–100 score:
BB/KC squeeze condition
Expansion proxy
Trend proxy
Momentum proxy (RSI-based)
Volume catalyst (volume z-score)
Structure break (highest/lowest break)
You can set:
Score threshold (minimum score required)
Minimum components required (forces diversity of evidence)
When enabled, a signal must satisfy both oscillator logic and MOEP confluence conditions.
7) Research harness (NON-CAUSAL, OFF by default)
A built-in research mode evaluates signals using future bars to compute basic forward excursion statistics:
MFE (max favorable excursion)
MAE (max adverse excursion)
Simple win-rate proxy based on MFE vs MAE
This feature is strictly for offline analysis and tuning. It is disabled by default and should not be considered “live-safe” because it uses future information for evaluation.
Signals and interpretation
Mean Reversion regime
Long: oscillator is below the lower band and turns back upward across it
Short: oscillator is above the upper band and turns back downward across it
Trend regime
Long: oscillator crosses above zero (optionally requires structure break confirmation)
Short: oscillator crosses below zero (optionally requires structure break confirmation)
Hybrid
When Hybrid is selected (manual mode), the indicator allows both trend and mean-reversion triggers, but still respects the filters and gates you enable.
Recommended starting configuration (MNQ 1m)
If you want stable, high-quality signals first, then expand into research:
Use RTH only: ON
Auto regime switch: ON
Adaptive length: ON
Adaptive bands: ON
MTF confirmation: OFF initially (turn ON later with 5m)
MOEP Gate: OFF initially (turn ON after you confirm base behavior)
Research harness: OFF (only enable for tuning studies)
Practical notes / transparency
The indicator is designed to be stable on live bars (optional confirmed-bar behavior reduces flicker).
No repainting logic is used for signals.
Any “performance” numbers shown under Research harness are not tradable metrics; they are forward-looking evaluation outputs intended strictly for experimentation.
Disclaimer
This script is provided for educational and research purposes only and does not constitute financial advice. Futures trading involves substantial risk, including the possibility of loss exceeding initial investment.

Cash Conversion Ratio (CFO / Net Income)This indicator measures how effectively a company converts its accounting profits into cash generated from core operations. It is calculated as:
Cash Conversion Ratio = Operating Cash Flow (CFO) ÷ Net Income
A value around 1.0 (or 100%) generally indicates strong earnings quality, meaning reported profits are broadly supported by operating cash inflows. Values above 1.0 suggest operating cash flow exceeds net income, while values below 1.0 may indicate weaker cash conversion, often due to working-capital changes (e.g., receivables, inventory) or other timing effects. Negative or near-zero net income can make the ratio volatile or less interpretable.
