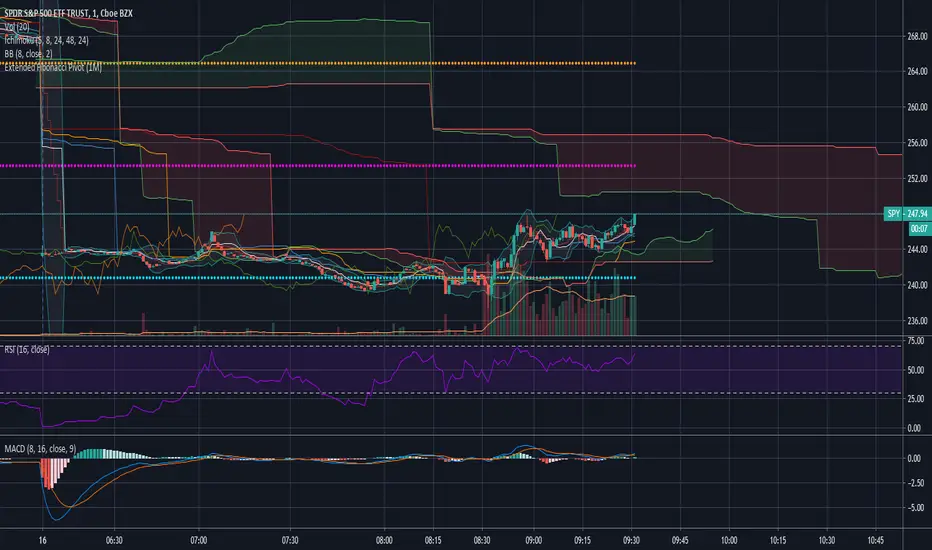
RSI PivotIt is based on RSI. When RSI crosses (70)up and (30)down bands, it draws a price line.
Cheers :)
Pivot

Pivot Reversal Strategy - FIGS & DATES 2.0Simple Pivot Reversal Strategy with some adding settings.
Date Range: To test over specific market conditions.
Initial Capitol: $10K - This is a more realistic representation of funds used this strategy (for me anyway). The default of $100K can give different results (usually better) than when using a smaller balance.
Order Size: 100% Equity - These trend following strategies typically used this way, going all in each direction.
Commission: .075% - It's always disheartening to think you've found a ridiculously good setting, and then realize you forgot to add the commission.
All of these settings can be changed, but it's easier for me (and more fool proof) to have them set as default.

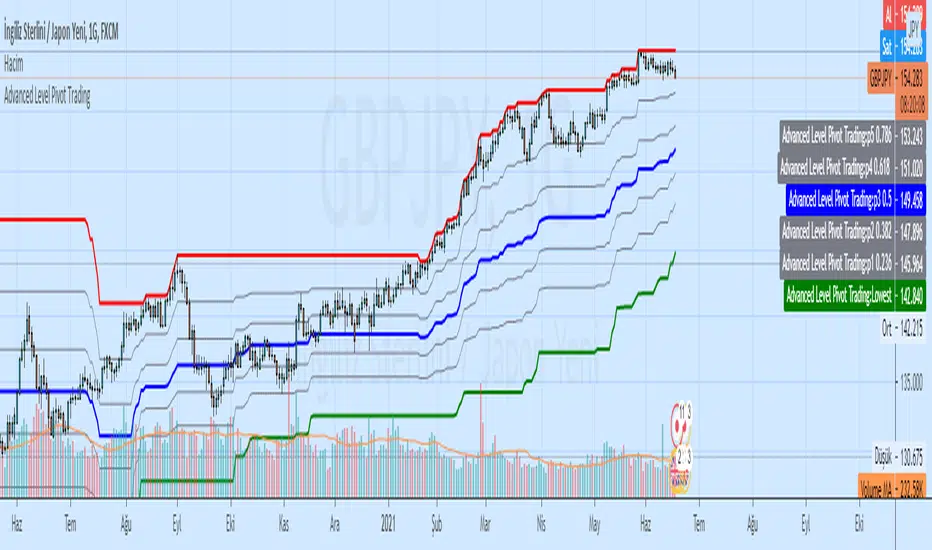
Advanced Level Pivot TradingAdvanced Level Pivot Trading
Highest Lowest Channel and Level Pivot (Fibonacci)
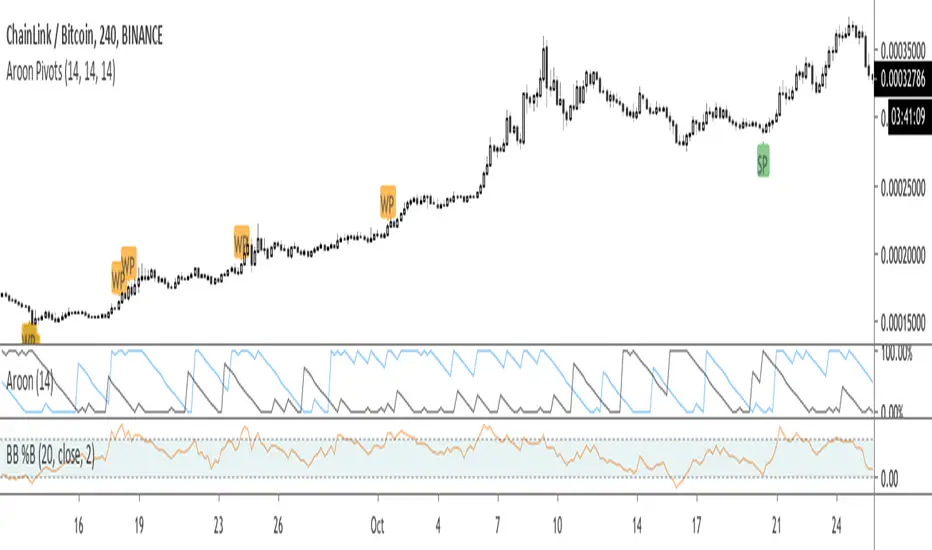
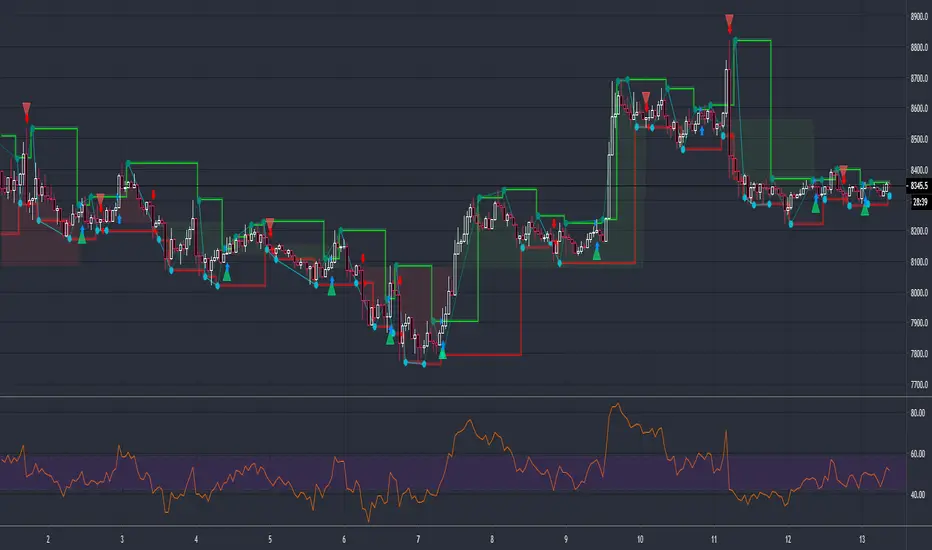
Aroon Pivots Beta 2.0THIS IS A BETA AND ONLY TO BE USED FOR TESTING PURPOSES
Upgraded Beta Version of the Aroon Pivots Beta.
PLEASE READ BELOW OF THE USAGE OF PIVOTS
Whats new in 2.0?
- Updated to a new Script: This is for two reasons (1) there have been some overall changed to the weaker signals to make then stronger and felt it was changed enough to differentiate and be able for beta testers to compare side by side, and (2) some users have had issues using the script and getting an error, which this hopefully fixes.
- Improved accuracy for the "weak" signals
- Color coded "strong" and "week signals and now renamed to set them apart as "SP" and "WP" respectively.
- Added confluence to signals to help improve all timeframes.
This script is the beta version of the Aroon Pivots for testing purposes and is not intended to be used in real trading.
========= AROON PIVOTS =========
The purpose of this script is to use the power of the Aroon Lines to determine when trends or portions of a trend have reached a certain level of exhaustion, which in turn can help discover pivot points or reversals. Aroon Lines (the Up and Down lines) are measures of time that compare previous highs and lows, as well as opens and closes, which when compared can give insight on a possible incoming trading move. Aroon is one of the few indications that was designed for this purpose to show possible moves instead of historic data.
========= HOW TO USE =========
It's fairly simple, but small labels are created that show when entry or exit is at its closing peak. Labels can be used to enter as a maximum opportunity in addition to minimal risk, while simultaneously can be used to close an already open position for maximum closing results.
========= ADDITIONAL NOTES =======
- Labels are printed when the criteria is met, however, the labels are not fully realized until candle close.
- Labels are not repainted.
- Labels are specific to their relative timeframe, so its expected that a lower timeframe pivot will not expand into a high timeframe label, especially is the labels are giving opposite pivots .
Neru_MultiPivots_ForDarkThemeNeru_MultiPivots_ForDarkTheme
________________________________
This script is plotting the classic PivotPoints into the charts, two for each interval.
These Pivots are adjusting automatically when you change the interval.
The following are supported:
1, 3, 5, 15: H4 Pivots R5-S5
5, 15, 30, 60, H2: Daily Pivots R5-S5
30, 60, H2, H3, H4, H6: Weekly Pivots R4-S4
H3, H4, H6, D: Monthly Pivots R3-S3
D, 2D, 3D, W, 2W: Quarterly Pivots R3-S3
2D, 3D, W, 2W, M, 3M: Yearly Pivots R2-S2
You cannot change these settings, but disable them seperately.
This is a universal indicator and appropriate to use in any market, due to the fact classic calculations are used.
Additional: You are able to set alerts onto single Pivots OR an entire interval.
There is also a version for light themes: Neru_MultiPivots_ForLightTheme (simply search in indicator´s library)
_________________________________
Warm regards,
Neru

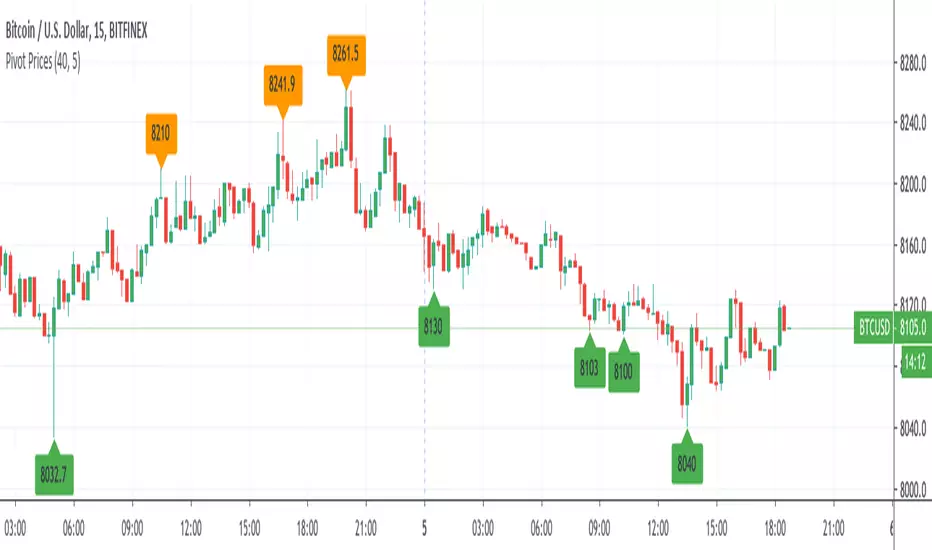
Pivot PricesThis is a pivot indicator that shows the lows and highs of the instrument according to the timeframe you choose to look from. Play with the setting to fit best with your strategy, use this to confirm trend or scalp with other indicators. All props to the Moderator Team that tuned this indicator to work properly.

3rd High Low This is simple script to mark when higher high (or lower low) is made on continuously third day.
There likelihood of short term reversal next day. As usual, it is just likelihood and not certainty.

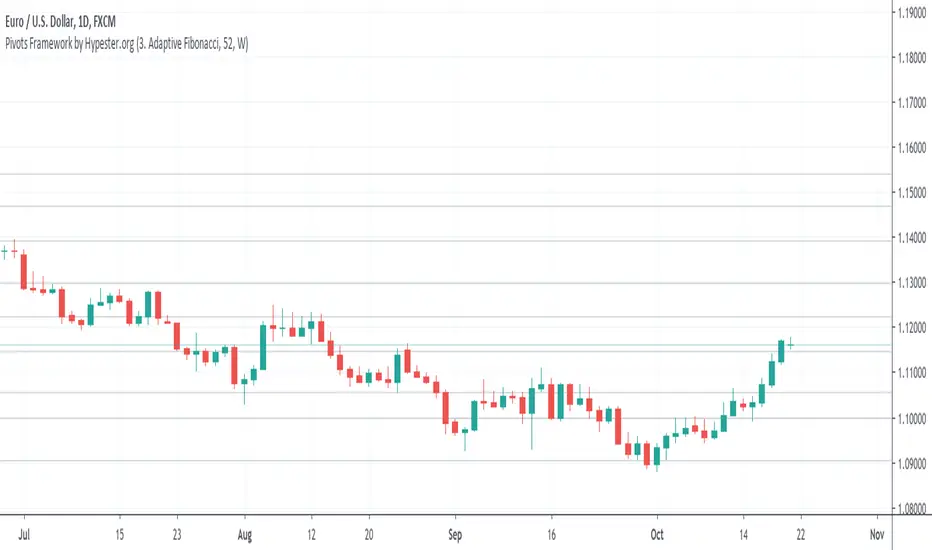
Pivots Framework by HypesterThis is the first release of the basic pivot framework with the three most used ones by our Alpha Community.
You can easily switch between modes, adjust the lookback period, and it works multi-resolution.
Right now, we have:
BB Fibo
Murrey's Channels
Adaptive Fibonacci
The next release will be ATR based pivot formula.
Pivot Point Reversal + RSI AlertsThese are alerts for previously published strategy:
This strategy joins the Pivot Reversal strategy with the RSI indicator.
We check RSI level at the pivot point level and only if RSI condition is satisfied we update levels for stop orders.

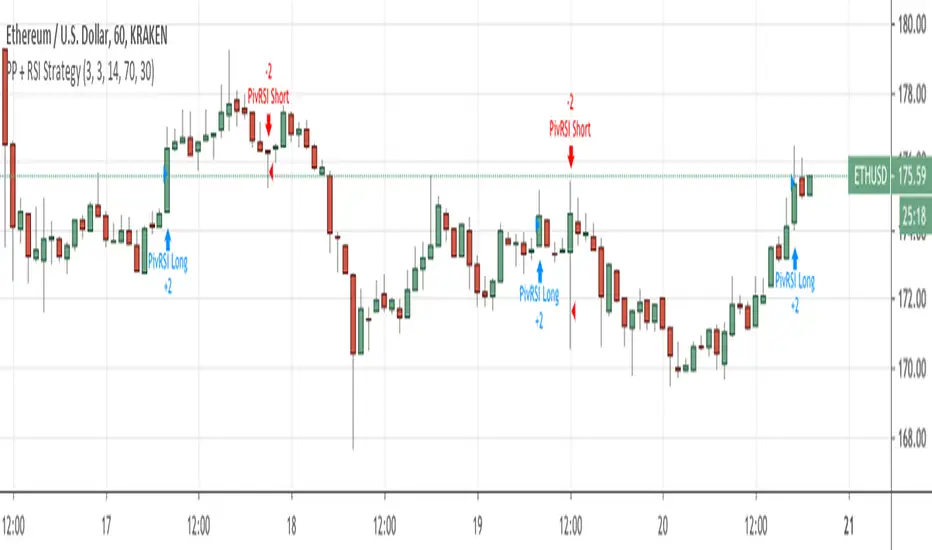
Pivot Point Reversal + RSI StrategyThis strategy joins the Pivot Reversal strategy with the RSI indicator.
We check RSI level at the pivot point level and only if RSI condition is satisfied we update levels for stop orders.
The strategy works pretty good for crypto, 30m, 1h, 2h timeframes.
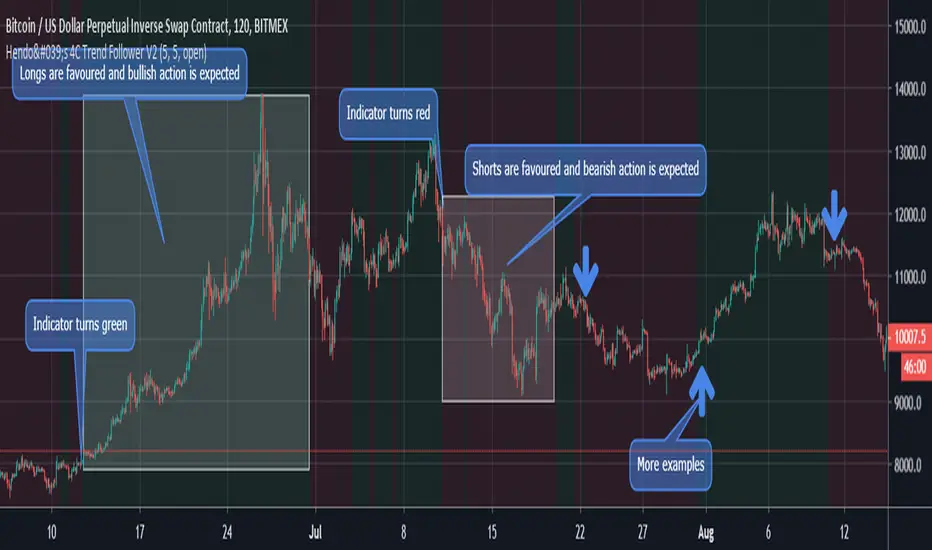
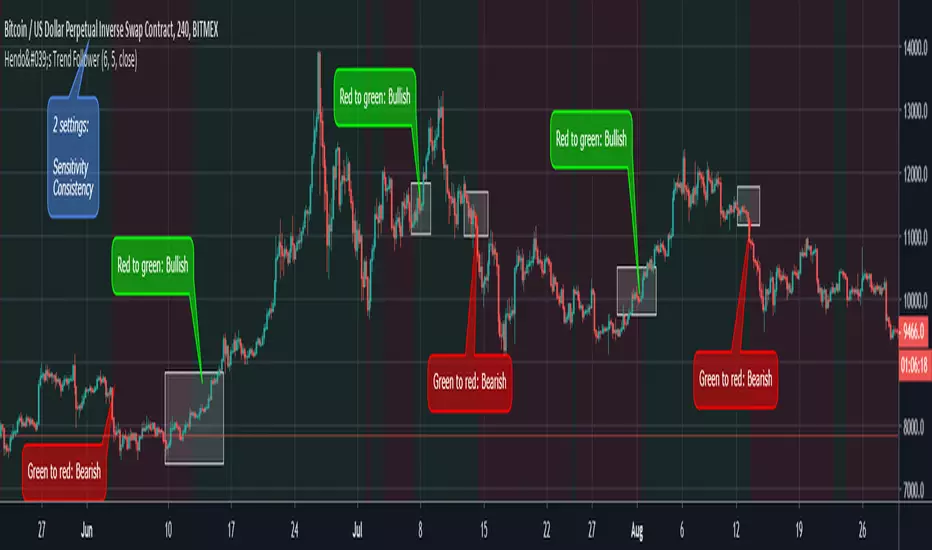
Hendo's 4C Trend Follower V2 (with alerts)An updated version of my previously created "Trend Follower", now comes with 4 different types of alerts, improved conditions and accuracy and the abillity to colorcode as you desire. I strongly suggest manual traders to make sure you disable the visibillity of the alerts, because those clutter your charts quite easily. The usecase is described below:
Used to determine a bias and can be used to find pivots . It colors the background of your charts green when it's biased towards bullishness, red when it's biased towards bearishness. The transitions between Red & Green are also tradeable pivots .
Most of usage is explained quite well in the image found above. It does work on every pair and every time frame. It does not repaint nor does it use data from the future to find a bias.
As any of these indicators:
1. It does not work 100% of the time
2. It works better on higher time frames (less trendshifts)
3. It's extremely consistent in execution, unlike human beings: Hence why it's perfect for determining your bias on price.
Comes with 2 settings:
Sensitivity: 1-20 (5 Default)
Consistency: 1-10 (5 Default)
Feel free to match the settings with the pair you're trading. Higher for BTC , lower for FX for example.
Access is ONLY for members, I'm not selling the sourcecode, nor letting people "help" with development.
More stuff to come!
Pivot Reversal Strategy + RSIPivot Reversal Strategy + RSI
A modified version of the standard PRS with an RSI overbought/oversold filter
Comment/uncomment "Study/Strategy" to easily switch to strategy() mode
As long as it is used in the study() version, the indicator is compatible with the Risk Management Wrapper
Separate Alerts for Buy & Sell signals
Single Alert for both Buy & Sell signals - it can also be used by another indicator as a source
Camerilla PivotsBefore starting special thanks to @QuantNomad for his script "Ultimate Pivot Point Alerts"
Link : -
Please follow and support him for his work.
In this script I'm modifying how time frame factor is imported into the script and removing other types of Pivots and cleaning it further for only CAMs, I've also added the formulas for 5 and 6 numbers, it will help in trading breakout strategies.
Note that this way of importing Time frame produces minor difference in readings/levels from how it is done in QuantNomads script, so before taking your pics you should calculate your levels on separate sheet and compare which ones are working for you and your strategy.
I've been using this CAM setup for almost a year now, so I coded it as per my needs, it is up to users to utilize it to theirs.
Further utility:
1. You can hide/unhide S/R levels 5/6
2. This is MultiTimeframe version, meaning you can change Time-frame of Pivots being displayed on any TF chart.
3. Lines are produced for only level 3 and 4. And you can choose to hide them. Only Pivot line is kept and can not be hidden.
4. You can also choose to hide/unhide level value and only see label if you want.
5. No historical levels are kept to avoid clutter.
I've not included alerts as I don't use them, but if anyone wants it I suggest referring to @QuantNomad script bank. He has published number of excellent scripts in this regard.
There is no restrictions on this script, it can be used and reproduced freely. Its my way of doing little something for community and my first script.
Enjoy.

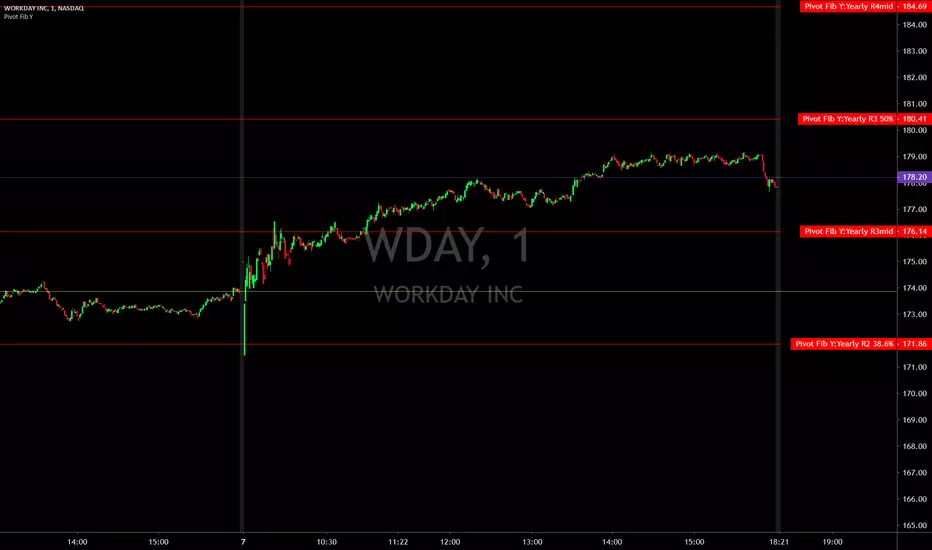
Pivot Points with Fibonacci YearlyPivot Points with Fibonacci
Yearly only
What is a Pivot Point?
A pivot point is a technical analysis indicator, or calculations, used to determine the overall trend of the market over different time frames. The pivot point itself is simply the average of the high, low and closing prices from the previous trading day. On the subsequent day, trading above the pivot point is thought to indicate ongoing bullish sentiment, while trading below the pivot point indicates bearish sentiment.
The pivot point is the basis for the indicator, but it also includes other support and resistance levels that are projected based on the pivot point calculation. All these levels help traders see where the price could experience support or resistance. Similarly, if the price moves through these levels it lets the trader know the price is trending in that direction.
When the price of an asset is trading above the pivot point , it indicates the day is bullish or positive.
When the price of an asset is trading below the pivot point , it indicates the day is bearish or negative.
The indicator typically includes four additional levels: S1, S2, R1, and R2. These stand for support one and two, and resistance one and two.
Support and resistance one and two may cause reversals, but they may also be used to confirm the trend. For example, if the price is falling and moves below S1, it helps confirm the downtrend and indicate a possible continuation to S2.
This Script includes the Mid Pivot Points , All levels are based on Fibonacci
Pivot Points with Fibonacci QuarterlyPivot Points with Fibonacci
Quarterly only
What is a Pivot Point?
A pivot point is a technical analysis indicator, or calculations, used to determine the overall trend of the market over different time frames. The pivot point itself is simply the average of the high, low and closing prices from the previous trading day. On the subsequent day, trading above the pivot point is thought to indicate ongoing bullish sentiment, while trading below the pivot point indicates bearish sentiment.
The pivot point is the basis for the indicator, but it also includes other support and resistance levels that are projected based on the pivot point calculation. All these levels help traders see where the price could experience support or resistance. Similarly, if the price moves through these levels it lets the trader know the price is trending in that direction.
When the price of an asset is trading above the pivot point , it indicates the day is bullish or positive.
When the price of an asset is trading below the pivot point , it indicates the day is bearish or negative.
The indicator typically includes four additional levels: S1, S2, R1, and R2. These stand for support one and two, and resistance one and two.
Support and resistance one and two may cause reversals, but they may also be used to confirm the trend. For example, if the price is falling and moves below S1, it helps confirm the downtrend and indicate a possible continuation to S2.
This Script includes the Mid Pivot Points , All levels are based on Fibonacci

Pivot Points with Fibonacci MonthlyPivot Points with Fibonacci
Monthly only
What is a Pivot Point?
A pivot point is a technical analysis indicator, or calculations, used to determine the overall trend of the market over different time frames. The pivot point itself is simply the average of the high, low and closing prices from the previous trading day. On the subsequent day, trading above the pivot point is thought to indicate ongoing bullish sentiment, while trading below the pivot point indicates bearish sentiment.
The pivot point is the basis for the indicator, but it also includes other support and resistance levels that are projected based on the pivot point calculation. All these levels help traders see where the price could experience support or resistance. Similarly, if the price moves through these levels it lets the trader know the price is trending in that direction.
When the price of an asset is trading above the pivot point , it indicates the day is bullish or positive.
When the price of an asset is trading below the pivot point , it indicates the day is bearish or negative.
The indicator typically includes four additional levels: S1, S2, R1, and R2. These stand for support one and two, and resistance one and two.
Support and resistance one and two may cause reversals, but they may also be used to confirm the trend. For example, if the price is falling and moves below S1, it helps confirm the downtrend and indicate a possible continuation to S2.
This Script includes the Mid Pivot Points , All levels are based on Fibonacci

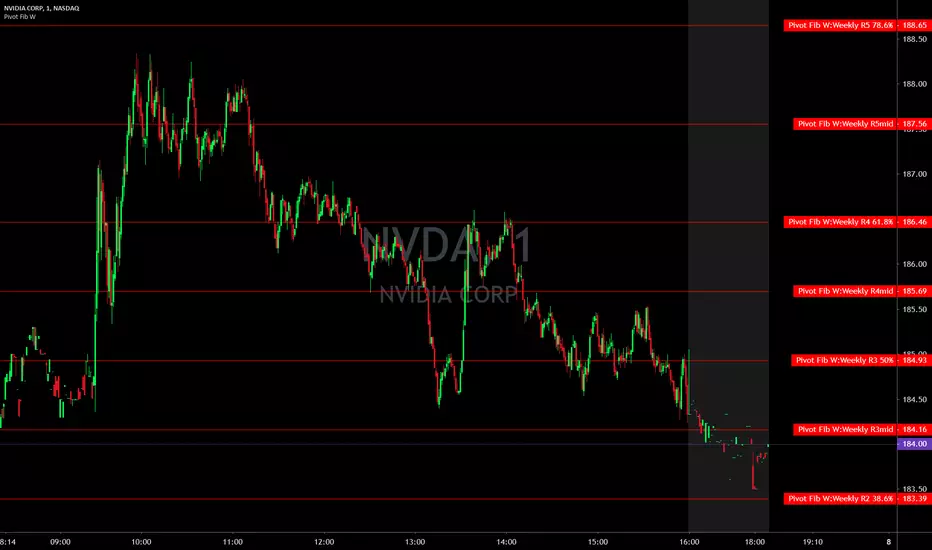
Pivot Points with Fibonacci WeeklyPivot Points with Fibonacci
Weekly only
What is a Pivot Point?
A pivot point is a technical analysis indicator, or calculations, used to determine the overall trend of the market over different time frames. The pivot point itself is simply the average of the high, low and closing prices from the previous trading day. On the subsequent day, trading above the pivot point is thought to indicate ongoing bullish sentiment, while trading below the pivot point indicates bearish sentiment.
The pivot point is the basis for the indicator, but it also includes other support and resistance levels that are projected based on the pivot point calculation. All these levels help traders see where the price could experience support or resistance. Similarly, if the price moves through these levels it lets the trader know the price is trending in that direction.
When the price of an asset is trading above the pivot point , it indicates the day is bullish or positive.
When the price of an asset is trading below the pivot point , it indicates the day is bearish or negative.
The indicator typically includes four additional levels: S1, S2, R1, and R2. These stand for support one and two, and resistance one and two.
Support and resistance one and two may cause reversals, but they may also be used to confirm the trend. For example, if the price is falling and moves below S1, it helps confirm the downtrend and indicate a possible continuation to S2.
This Script includes the Mid Pivot Points , All levels are based on Fibonacci
Pivot Points with Fibonacci DailyPivot Points with Fibonacci
Daily only
What is a Pivot Point?
A pivot point is a technical analysis indicator, or calculations, used to determine the overall trend of the market over different time frames. The pivot point itself is simply the average of the high, low and closing prices from the previous trading day. On the subsequent day, trading above the pivot point is thought to indicate ongoing bullish sentiment, while trading below the pivot point indicates bearish sentiment.
The pivot point is the basis for the indicator, but it also includes other support and resistance levels that are projected based on the pivot point calculation. All these levels help traders see where the price could experience support or resistance. Similarly, if the price moves through these levels it lets the trader know the price is trending in that direction.
When the price of an asset is trading above the pivot point , it indicates the day is bullish or positive.
When the price of an asset is trading below the pivot point , it indicates the day is bearish or negative.
The indicator typically includes four additional levels: S1, S2, R1, and R2. These stand for support one and two, and resistance one and two.
Support and resistance one and two may cause reversals, but they may also be used to confirm the trend. For example, if the price is falling and moves below S1, it helps confirm the downtrend and indicate a possible continuation to S2.
This Script includes the Mid Pivot Points , All levels are based on Fibonacci

Extended Fibonacci PivotEditable Fibonacci Pivots. 0.236, 0.382, 0.618, 0.786, 1.000. Easy to extend further if needed. Can be used with intervals from 1 minute to 1 Day.
A Few Recommended timeframes:
1 minute chart - 15 Minute Pivot Timeframe
3 minute chart - 1 Hour Timeframe or Daily Timeframe
15 Minutes to < 60 Minutes - Daily Timeframe
1 Hour to 4 Hour - Weekly Timeframe
Daily - Monthly Timeframe
Hendo's Trend FollowerA main trend following indicator:
Used to determine a bias and can be used to find pivots. It colors the background of your charts green when it's biased towards bullishness, red when it's biased towards bearishness. The transitions between Red & Green are also tradeable pivots.
Most of usage is explained quite well in the image found above. It does work on every pair and every time frame. It does not repaint nor does it use data from the future to find a bias.
As any of these indicators:
1. It does not work 100% of the time
2. It works better on higher time frames (less trendshifts)
3. It's extremely consistent in execution, unlike human beings: Hence why it's perfect for determining your bias on price.
Comes with 2 settings:
Sensitivity: 1-20
Consistency: 1-5
Feel free to match the settings with the pair you're trading. Higher for BTC, lower for FX for example.
Access is ONLY for members, I'm not selling the sourcecode, nor letting people "help" with development.
More stuff to come!

Pivot Prices - ExampleA simple example script showing how to use label.new() to plot pivot prices on the chart.
A full tutorial and commentary is available on the backtest-rookies website.
Pivot Points MTFStandart pivot points which auto switching with higher TF ones.
4h pivots on 5min
1D pivots on 15min
1W pivots on 4 hours
1M pivots on daily
1Y pivots on weekly
