Consolidation Score ScreenerIn trading, a consolidation range is like a timeout after a big move in the price of a stock or symbol.
It's when the market takes a breather, neither pushing the price up nor down too hard.
Visually, it looks like the price moving sideways on a chart , with highs and lows staying within a certain range.
so this indicator is created to help myself and you decide if its a ranging market and what's the score of that consolidation range
The score ranges between 0 and 10 , where 10 is the max consolidation score , meaning this stock or the symbol is at its highest peak of consolidation .
What would you see using this indicator ?
Symbols circles , inside these circles it will print the consolidation score ..
in the middle of the indicator it will show the range of all the 20 symbols scores .
so it will give you like overall ranging value for your 20 symbols
Settings :
TimeFrame : TimeFrame input to select which time frame you want your indicator to analysis
Range length : The Range that you would want your indicator to take into consideration when doing its analysis .
Features :
20 symbols analysis
Multi timeframe capability
Enjoy .
Range

Consolidation and Range PatternHello Traders!
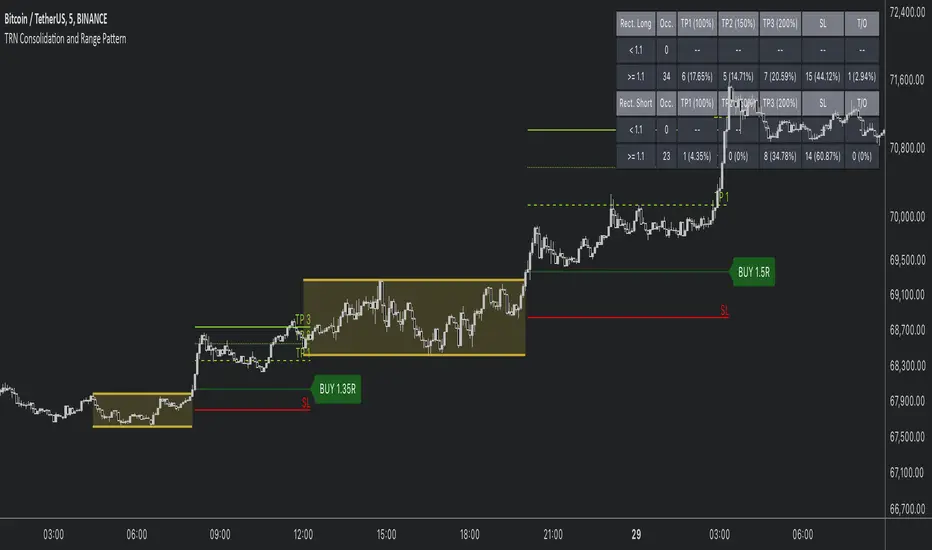
The TRN Consolidation and Range Pattern indicator utilizes a unique swing-based pattern recognition to pinpoint consolidation zones in real-time with unparalleled precision. The rectangle pattern, also known as a trading range or a consolidation pattern, is characterized by horizontal lines that act as support and resistance levels, creating a rectangular shape.
The value of this indicator is to support traders to easily identify consolidations and ranges. The special swing-based pattern recognition and the numerous built-in premium features make this indicator unique. Below, you'll find a list of these features.
Feature List
Real-time consolidation/range detection
Visualization of entry, stop-loss and take-profit levels
Pattern performance statistics
Calculation of risk rewards ratio
Risk Management
Breakout alerts
Customizable pattern size and accuracy
Customizable look and feel
The trader saves a lot of time scanning the markets for consolidation patterns, since everything is done automatically for the trader: Finding the consolidation, looking and alerting for a breakout, computing the entry, stop loss and take profit levels as well as handling the risk management and computing the optimal order quantity. Now, we describe how a combination of these features enhances the trading performance of confirmed consolidation patterns.
How to Trade with the TRN Consolidation and Range Pattern
Identify the Pattern
Add the TRN Consolidation and Range Pattern to your chart and look for the pattern on the asset and timeframe of your choice. The pattern is detected in real-time. If the pattern develops further in the next bars, then the indicator updates the consolidation zone until a breakout is confirmed.
You can also use the built-in alerts to easily get notified when a pattern occurs. In the indicator settings in the "Alerts" section you can choose whether you want to get notified when a pattern is in the making (Pattern active), confirms a breakout to the upside (B/O Up Confirmed) or confirms a breakout to the downside (B/O Down Confirmed). By selecting the "Unconfirmed" option, you will receive notifications when a pattern breakout occurs, even if it is not yet confirmed. This allows you to stay informed about potential breakout opportunities that are still awaiting confirmation.
Check Pattern Statistics
The pattern statistics make it easy for you to see how successful a pattern is on the asset and timeframe you are watching. You should always check them out before entering a trade. The chart displays the statistics in the upper right corner. These statistics are categorized into two sections: "long" for patterns with an upward breakout and "short" for patterns with a downward breakout.
In the initial columns, labeled as "short" and "long", the identified breakouts are further divided based on whether the risk-reward ratio (R) is below a specified value (< x) or equal to/greater than the specified value (>= x). The following columns represent the count of the events:
1. Occ. (Occurrence) categorized according to the values of R from the first column
2. TP1, TP2, TP3 (Take Profit) - targets 1, 2 and 3
3. SL (Stop Loss)
4. T/O (Time Out) - neither stop loss or targets where hit in a certain amount of time
Breakout – Entry, Stop Loss and Targets
The indicator automatically displays the entry price line (EP) in grey et the point where the price breaks through the resistance or support levels, indicating that the consolidation period is over. Once a breakout has been confirmed, place a buy order near the EP level for a long position, or a sell order for a short position. Set your stop-loss at the price level of the red stop-loss line (SL) and set your take-profits at the price level of the green take-profit-lines (TP1, TP2, TP3). Note that your risk-reward ratio (R) was calculated based on TP1.
Risk Management
The TRN Consolidation and Range Pattern comes with a built-in risk management feature. Just go to the settings and scroll down to the section "Risk Management".
Here you can enter your Account Size and the percentage you want to Risk when you enter a position after a pattern breakout.
In the "Trade Management" section, you have the option to define the minimum accepted risk-reward ratio for confirmed rectangles. This means that breakouts of patterns failing to meet the minimum risk-reward ratio will not be considered as confirmed signals.
If a breakout gets confirmed, the indicator automatically calculates the position size (Quantity). You can read the quantity from the gray entry point line (EP), which is located to the right of the risk-reward ratio (R).
Customization and Settings
The indicator can scan for smaller and larger patterns at the same time. Adjust the consolidation sizes in the indicator settings to align them with your preferences. A larger size results in larger consolidations. Depending on the asset class, the market or the market phase, different sizes can be used for the consolidation detection.
To detect more patterns, increase the tolerance level, even though it may result in lower accuracy. However, be mindful that a higher tolerance level may result in more patterns hitting their stop-loss. Look for a tolerance level that leads to favorable statistics and focus on trading patterns with a proven performance history.
Finally, you have the flexibility to customize various visual elements, such as the color of the pattern and whether to display values like price, target, or risk-reward ratio on your chart. You can also choose where these values appear.
Computation Details
The real-time detection of the consolidations and ranges utilizes a unique swing-based pattern recognition. The difference to other swing-based computations is that the pivot points are identified without a look-ahead value. The result is a faster and better real-time detection. Furthermore, the detection of equal lows or highs which form a support or resistance level is based on a dynamic volatility measurement similar to the ATR. The tolerance level unites several internal parameters into one and results in a user-friendly setting.
Risk Disclaimer
The content, tools, scripts, articles, and educational resources offered by TRN Trading are intended solely for informational and educational purposes. Remember, past performance does not ensure future outcomes.
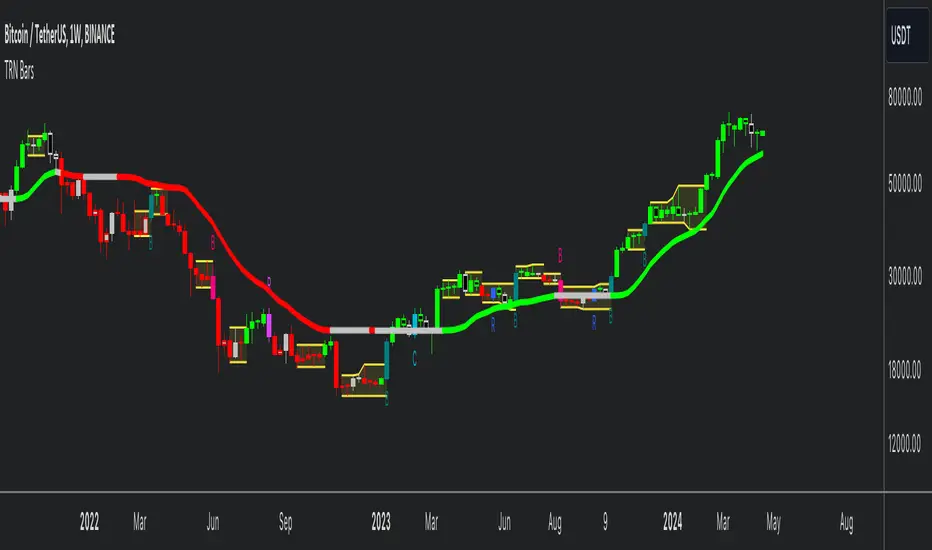
TRN BarsThe innovative TRN Bars are designed to help traders to analyze markets in an intuitive way. It combines three core concepts:
TRN Bars to see the current trend and reversals (replaces the default chart bars)
Bar Ranges to highlight consolidations
Dynamic Trend to see the overall trend.
First, let's have a look at each of these concepts individually. Afterwards, we describe how a combination of all three gives you a crystal-clear picture of the market.
TRN Bars
They show bullish and bearish trends and reversals based on color coding the bars and give high probability trade opportunities with special colors. The trend analysis is based on a new algorithm that includes several different inputs:
classical and advanced bar patterns and their statistical frequency
probability distributions of price expansions after certain bar patterns
bar information such as wick length in %, overlapping of the previous bar in % and many more
historical trend and consolidation analysis
The algorithm weighs these concepts and outputs a color scheme for the chart bars or candlesticks.
Bar Types
Trend bars in green and red
Reversal Bars in blue and fuchsia
Continuation Bars in turquoise and orange
Breakout Bars in dark green and pink
Green Bars signify a sustained uptrend, indicating bullish market sentiment. On the other hand, Red Bars indicate a persistent downtrend, representing bearish market sentiment. The transition from red to green denotes a bullish trend reversal, suggesting a shift from bearish to bullish sentiment. Conversely, the shift from green to red signals a bearish trend reversal, indicating a transition from bullish to bearish sentiment. By monitoring these color changes, traders can identify potential trend reversals and make informed trading decisions.
The presence of gray and black bars indicates a neutral market state, often observed before an impending color change from red to green or green to red. These neutral bars serve as a transition phase between the previous trend and the potential reversal.
The TRN Bars incorporate Signal Bars, distinguished by their distinct colors, to offer potential buy and sell signals and deeper insights into market dynamics.
Reversal Bars
The presence of blue Reversal Bars indicates a trend reversal to the upside, while pink Reversal Bars indicate a reversal to the downside. These bars not only serve as signals for potential trend shifts but also present favorable opportunities to enter the market or increase one's position size.
Continuation Bars
In addition to the reversal bars, TRN Bars also include bullish continuation bars (colored turquoise) and bearish continuation bars (colored orange). These bars act as signals for the continuation of an existing trend. Like the reversal bars, they can be utilized as entry points or opportunities to augment one's position size.
Breakout Bars
The dark green breakout bars within TRN Bars show a powerful breakout from a price range detected by our integrated bar range feature. They signify the continuation or potential change in a trend following a consolidation phase. As such, these bars hold dual functionality, serving as reversal signals and validating the persistence of an ongoing trend.
Bar Ranges
The bar range feature automatically finds consolidations where the price range of several consecutives bars is rather small. The detection of the bar ranges includes among other things the overlapping percentage of these bars.
How to Use Price Ranges
Here are a few ways you can use the bar ranges in your trading:
Identify Support and Resistance Levels
The price ranges can help you identify key support and resistance levels on a chart. By observing price ranges and identifying these levels, you can make more informed decisions about entering or exiting trades.
Breakout Trading
Price ranges can also provide insights into potential breakout opportunities. Breakouts occur when the price breaks out of a defined range, signaling a potential shift in market sentiment and the start of a new trend. The Color highlighted Breakout Bars from the TRN Bars are signaling a powerful breakout of a price range. Traders can enter positions in the direction of the breakout and set appropriate stop-loss orders to manage risk. Note that not every price range is left by a powerful breakout.
Dynamic Trend
The Dynamic Trend combines elements from standard trend strength indicators (e.g. DI-, DI+, Parabolic SAR) and volatility indicators (e.g. ATR, Standard Deviation). It produces a moving average line that adapts to changing market volatility. It is inspired by the ideas of the programmer and trader Fat Tails. The adaptive behavior provides more relevant information for traders when compared to traditional moving averages which do not consider volatility and trend strength together. This makes the Dynamic Trend completely unique, and no other moving average indicator can give you this precision.
How to use Dynamic Trend
Generally, a rising Dynamic Trend line, displayed in green, indicates that an uptrend is strong, while a falling Dynamic Trend, displayed in red, suggests that the downtrend is sharp. The Dynamic Trend turns gray when there is insufficient clarity to establish a distinct trend and especially when there is not volatility in the market.
Identify potential trade entries and exits: When used in conjunction with price action, the Dynamic Trend can provide potential trade signals. For example, if the price crosses above the Dynamic Trend, it may be a bullish sign, suggesting a potential buy entry. Conversely, if the price crosses below the Dynamic Trend, it may indicate bearish conditions and a potential sell signal.
Trend Identification and Pullback trading
Observe the Dynamic Trend's color. When it's on the rise and appears green, it indicates a bullish trend. Conversely, if it's in decline and displayed in red, it signals a bearish trend.
If Dynamic Trend is green and price pulls from above back to the Dynamic Trend, then this can be considered as a bullish signal.
If Dynamic Trend is red and price pulls from below back to the Dynamic Trend, then this can be considered as a bearish signal.
In the event of a bearish signal, such as a bearish TRN Signal Bar, and the Dynamic Trend is red, it provides additional confirmation to the bearish signal. Likewise, bullish signals gain added conviction when the Dynamic Trend is green.
Crossovers
As with other moving averages, crossovers between the Dynamic Trend and the price can be significant.
If price is crossing above the Dynamic Trend, then this can be considered as a bullish signal.
If price is crossing below the Dynamic Trend, then this can be considered as a bearish signal.
If you currently hold a position, both bullish and bearish crossovers can serve as potential exit signals. For instance, in the case of a long position, a bearish crossover can indicate a potential shift in sentiment, signaling a bearish reversal and a potential opportunity to close your long position.
Filtering Noise
Due to its adaptive nature, the Dynamic Trend can be a useful tool to filter out market noise. When the market is choppy or consolidating, the Dynamic Trend tends to remain flat and colored gray, signaling traders to potentially stay out of the market.
Stop Losses
The Dynamic Trend can also be used as a dynamic stop loss. For instance, in a long trade, traders can use the Dynamic Trend as a trailing stop, selling their position if the price crosses below the Dynamic Trend.
Combining TRN Bars, Bar Ranges and Dynamic Trend together
Combining all three concepts gives you a crystal-clear picture of the market. The Dynamic Trend shows you the overall trend. If price pulls back to the dynamic trend line and then price picks up the trend direction again, then the TRN Bars immediately switch the color to the trend direction. Therefore, you can easily identify high probability entry signals based on the bar color.
As a simple trading model, you can set the stop loss below the last swing or below a TRN signal bar (vice versa for short entries) and use 2.5 R or 3 R as target.
You can increase the success rate of the high probability TRN signal bars entries even more if they are in line with the Dynamic Trend line.
On the other hand, the TRN Bar Ranges help you to stay out of the market in case the price does not really change. As a confluence signal to stay flat in this period the dynamic trend line tends to be grey as well. If the price breaks out of the range, then the TRN Bars print a breakout bar which serves as a high probability entry signal.
Although it is possible to switch off any of these concepts, it is highly recommended to use all three in combination to get a crystal-clear picture of the market.
Alerts
Experience the power of our TRN Bars Alerts, delivering real-time notifications for trend changes, price range breakouts, and signal bar formations or confirmations. Stay on top of the market with these versatile alerts, customizable to your preferred assets and timeframes.
Conclusion
While signals from TRN Bars can be informative, it is important to recognize that their reliability may vary. Various external factors can impact market prices, and it is essential to consider your risk tolerance and investment goals when executing trades.
Range Finder [UAlgo]🔶 Description:
The "Range Finder " indicator aims at identifying and visualizing price ranges within a specified number of candles. By utilizing the Average True Range (ATR) indicator and Simple Moving Average (SMA), it detects potential breakout conditions and tracks consecutive candles that remain within the breakout range. This indicator offers flexibility by allowing users to customize settings such as range length, method for determining range breaks (based on either candle close or wick), and visualization options for displaying range breaks on the chart.
🔶 Key Features
Identifying Ranges: The Range Finder automatically adapts to the market by continuously evaluating the Average True Range (ATR) and its Simple Moving Average (SMA). This helps in dynamically adjusting the range based on market volatility.
Range Length: Users can specify the number of candles to be used for constructing the range via the "Range Length" input setting. This allows for customization based on trading strategies and preferences.
Range Break Method: The indicator offers the flexibility to choose between two methods for identifying range breaks. Users can select between "Close" or "Wick" based on their preference for using the closing price or the highs and lows (including wicks) of candles for defining the breakout.
Show Range Breaks: This option enables visual representation of range breaks on the chart. When activated, labels with the letter "B" will appear at the breakout point, colored according to the breakout direction (upward breakouts in the chosen up range color and downward breakouts in the chosen down range color).
Range Color Customization: The indicator provides the ability to personalize the visual appearance of the range by selecting preferred colors for ranges indicating potential upward and downward breakouts.
🔶 Disclaimer
It's important to understand that the Range Finder indicator is intended for informational purposes only and should not be solely relied upon for making trading decisions. Trading financial instruments involves inherent risks, and past performance is not necessarily indicative of future results.

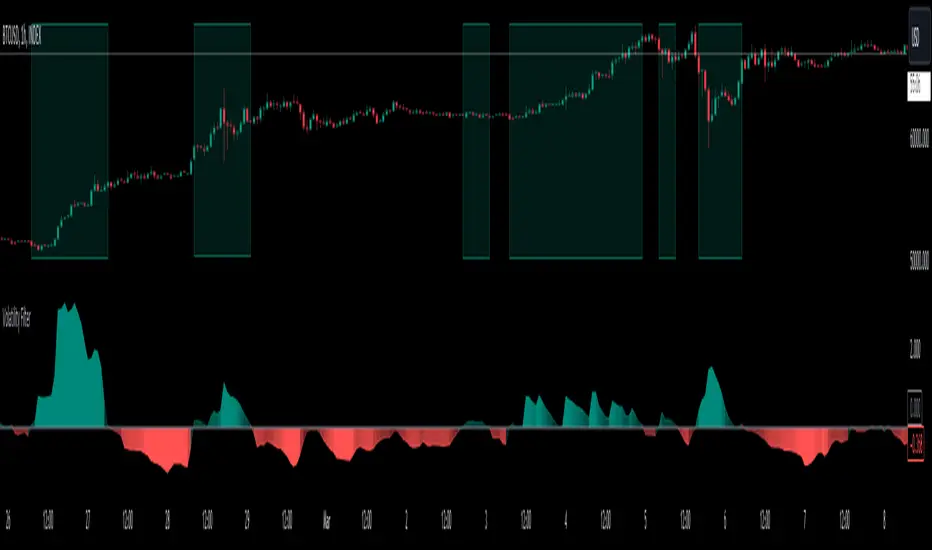
Volatility Filter v2VF v2 is a new iteration of my tool designed for traders who wish to gain a deeper understanding of market dynamics, specifically to distinguish periods of high volatility, which often correspond to strong market trends. By identifying these periods, traders can make more informed decisions, potentially leading to better trading outcomes.
Understanding Market Volatility:
At the heart of this script lies the concept of market volatility, a statistical measure reflecting the degree of variation in trading prices. Volatility is pivotal for traders; it provides insights into the market's emotional state, indicating periods of uncertainty or confidence. High volatility often correlates with strong trends, making it a critical indicator for trend-followers. By identifying when volatility crosses a certain threshold, traders can discern whether the market is likely to be in a trending phase or a more subdued, range-bound state.
How the Script Works:
The core functionality of the script revolves around a signal line that oscillates around a zero threshold. When the signal line is above zero, it indicates increased market volatility, suggesting the presence of a trend. The farther the oscillator deviates from zero, the stronger the implied trend. This mechanism enables traders to visually gauge market conditions and adjust their strategies accordingly.
Controlling the Indicator:
To cater to diverse trading styles and preferences, the script is equipped with several customizable settings:
Filter Threshold: This 'zero line' acts as the baseline for distinguishing between different volatility regimes. Crossing this threshold is a primary signal for changes in market volatility.
Moving Average Type: With over 30 types of moving averages to choose from, traders can select the one that best fits their analysis style. Each type offers a different perspective on price data, allowing for a tailored approach to trend identification.
Colorize Indicator: This feature enhances the visual representation of the indicator, making it easier to interpret. When enabled, the oscillator's color intensity varies with its proximity to the extremes, providing a quick visual cue about trend strength.
Advanced Settings – Length and Multiplier:
The script introduces an innovative approach to time frame analysis through its length and multiplier settings:
Length: This parameter sets the base period for all metrics within the script, similar to traditional indicators.
Multiplier: This unique feature differentiates the script by incorporating three distinct timeframes into the analysis: a lower timeframe, the main (current) timeframe, and a higher timeframe. The multiplier adjusts these timeframes relative to the main one. For instance, with a daily main timeframe and a multiplier of 2, the lower timeframe would be 12 hours, and the higher timeframe would be 2 days. This tri-timeframe approach aims to provide a more comprehensive volatility assessment.
Volatility Filter Indicators Section:
The script utilizes nine different, undisclosed metrics within its volatility filter. Traders have the flexibility to enable or disable these metrics based on their preferences, allowing for a customizable trading experience. Additionally, the script offers alert functionality for when the indicator crosses the threshold, either upwards or downwards, facilitating timely decision-making.
P.S
With better understanding of markets over time, I designed a new iteration of my volatility filter indicator. The second version provides faster, more precise way to analyze markets, but I also wanted to keep my first version untouched in case if some people find it better for their purposes. As I mentioned above, this version is calculated in a very different way from a previous one, so if you never tried it you can do it here
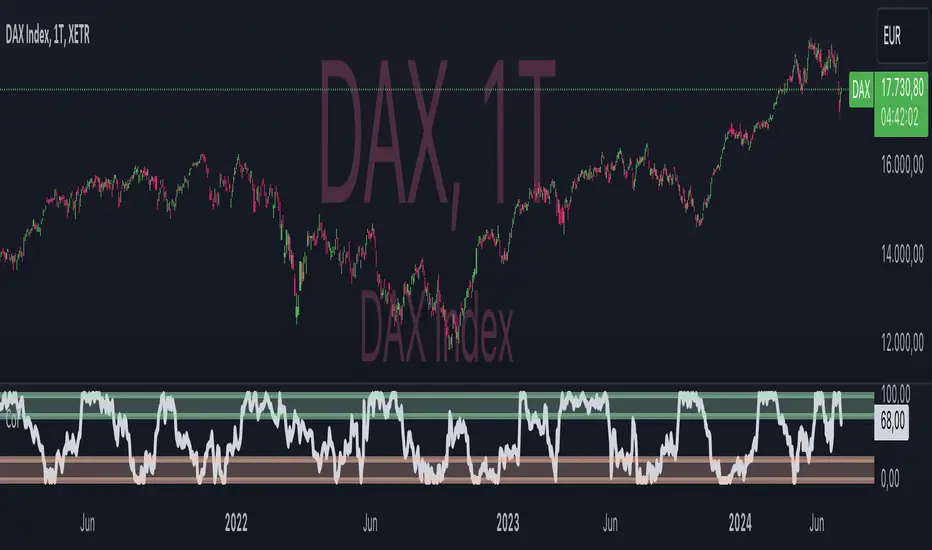
CoT artificial by Oster and Freundl (CoF)Overview:
CoF , short for "CoT artificial by Oster and Freundl", presents a novel approach to market analysis, inspired by the traditional Commitments of Traders (CoT) Index . Based on the artificial CoT calculation according to Freundl and Oster (explained below), this indicator provides traders with a versatile tool applicable across various markets, including individual stocks. Unlike its predecessor, CoF offers flexibility in its application, accommodating traders with different investment horizons, whether they operate on weekly, daily, hourly, or even minute candlesticks. By adjusting the period length in the settings, users can fine-tune the sensitivity of CoF to capture buy or sell signals, albeit with differing signal qualities. Additionally, CoF is equipped with alert functionalities, enhancing its usability for traders seeking timely market insights.
Sophisticated Calculation Methodology:
CoF derives its insights from a sophisticated calculation methodology, leveraging price range and price movement metrics to assess market dynamics. The indicator computes the ratio between the moving averages of price movement and price range over a specified period. This ratio, once normalized and scaled to a 0-100 range , provides traders with a quantifiable measure of market sentiment. Notably, CoF's calculation method, while nuanced, ensures accessibility and usability for traders seeking actionable insights without delving into complex mathematical formulations.
Interpretation:
CoF-Index, represented on the chart, offers traders insights into market sentiment dynamics . Values below the sell threshold indicate potential selling pressure, triggering sell alerts to alert traders to potential downturns. Conversely, values exceeding the buy threshold signal buying opportunities, prompting buy alerts for traders to capitalize on potential market upswings. By aligning these interpretations with the trader's investment strategy, CoF aids in decision-making processes, offering nuanced perspectives on market movements.
Dynamic Color Coding for Visual Clarity:
To enhance user experience and facilitate quick decision-making, CoF incorporates dynamic color coding . Market conditions favoring selling are denoted by red hues, while those conducive to buying are highlighted in green. Neutral conditions, indicative of balanced market sentiment, are represented in neutral colors. This intuitive visual feedback enables traders to swiftly identify market opportunities and risks, empowering them to make informed trading decisions.
Customizable Parameters for Tailored Analysis:
Acknowledging the diverse trading preferences and strategies of its users, CoF offers customizable parameters . Traders can adjust the period length to fine-tune the indicator's sensitivity to their desired level, balancing the frequency and quality of signals according to their trading objectives. Additionally, CoF's alert functionalities allow traders to set personalized thresholds, aligning with their risk tolerance and market outlook.
Conclusion:
In conclusion, CoF emerges as a valuable addition to the trader's toolkit, offering a versatile and accessible approach to market analysis. Built upon a foundation of sophisticated calculation methodologies, CoF provides traders with actionable insights into market sentiment across various timeframes and asset classes . Its intuitive visualizations, coupled with customizable parameters and alert functionalities, empower traders to navigate dynamic market conditions with confidence. Importantly, the CoF index offers traders the flexibility to employ a synthetically calculated method, inspired by the classic CoT-Index, regardless of market or investment horizon . Whether you're a seasoned investor or a novice trader, CoF equips you with the tools needed to stay ahead in today's competitive markets.
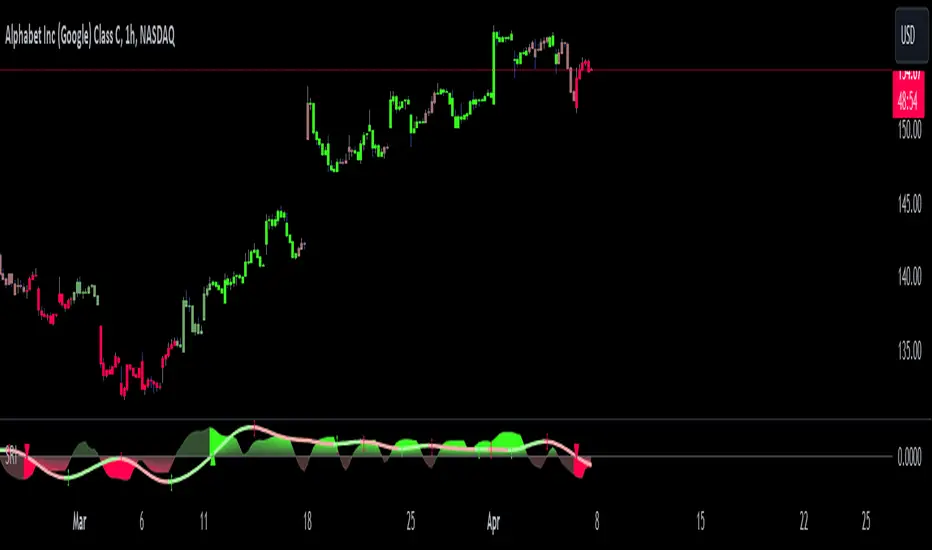
Shadow Range IndexShadow Range Index (SRI) introduces a new concept to calculate momentum, shadow range.
What is range?
Traditionally, True Range (TR) is the current high minus the current low of each bar in the timeframe. This is often used successfully on its own in indicators, or as a moving average in ATR (Average True Range).
To calculate range, SRI uses an innovative calculation of current bar range that also considers the previous bar. It calculates the difference between its maximum upward and maximum downward values over the number of bars the user chooses (by adjusting ‘Range lookback’).
What is shadow range?
True Range (TR) uses elements in its calculation (the highs and lows of the bar) that are also visible on the chart bars. Shadow range does not, though.
SRI calculates shadow range in a similar formula to range, except that this time it works out the difference between the minimum upward and minimum downward movement. This movement is by its nature less than the maximums, hence a shadow of it. Although more subtle, shadow range is significant, because it is quantifiable, and goes in one direction or another.
Finally, SRI smoothes shadow range and plots it as a histogram, and also smoothes and plots range as a signal line. Useful up and down triangles show trend changes, which optionally colour the chart bars.
Here’s an example of a long trade setup:
In summary, Shadow Range Index identifies and traces maximum and minimum bar range movement both up and down, and plots them as centred oscillators. The dynamics between the two can provide insights into the chart's performance and future direction.
Credit to these authors, whose MA or filters form part of this script:
@balipour - Super Smoother MA
@cheatcountry - Hann window smoothing
@AlgoAlpha - Gaussian filter
itradesize /\ IPDA Look Back - for any timeframeThe script automatically calculates the 20-40-60 look-back periods and their premium and discount ranges.
The base concept is from ICT’s IPDA which should be applied to the daily timeframe but now you can use that same concept on the lower timeframes .
The higher the timeframes you use the more reliable it will be ( when we are talking about lower timeframes than Daily ).
- With the use of the indicator you can apply it on any timeframe with ease.
- You can customize the coloring of premium & discount, frame lines, and even the look of it.
- Hide or show the EQ levels
Below the IPDA texts the indicator shows the actual percentage of the selected range based on the current price fluctuations.
The script handles the 20-40-60 days look-back as fractals so it can be applied on lower timeframes.
The basics:
- The Interbank Price Delivery Algorithm (IPDA): The algorithm creates a shift on the daily chart every 20, 40, and 60 trading days.
- These are the IPDA look-back periods. Every 20 trading days or so there is a new liquidity pool forming on both sides of the market based on ICT concepts.
- Determine the IPDA Data Range of the land 20 trading days.
- Note the highest high & lowest low in the past 20 trading days. Identify the institutional order flow and mark the relevant PD arrays in the selected IPDA look-back period we deemed useful for our trading style.
- This is your current dealing range.
- If the price consolidates for 20 days, consider switching to a 40-day look back.
Inside this dealing range, we look for the next draw on liquidity. Is it reaching for a liquidity pool or is it looking to rebalance at a particular PD Array. This is going to the Bias.
Which IPDA data range should you use?
IPDA20 can be our Short Term range - fit for intraday traders at most
IPDA40 can be our Swing Trade range - have a clear indication of the market profile
IPDA60 can be our range for position trading - have a clear indication of the market profile

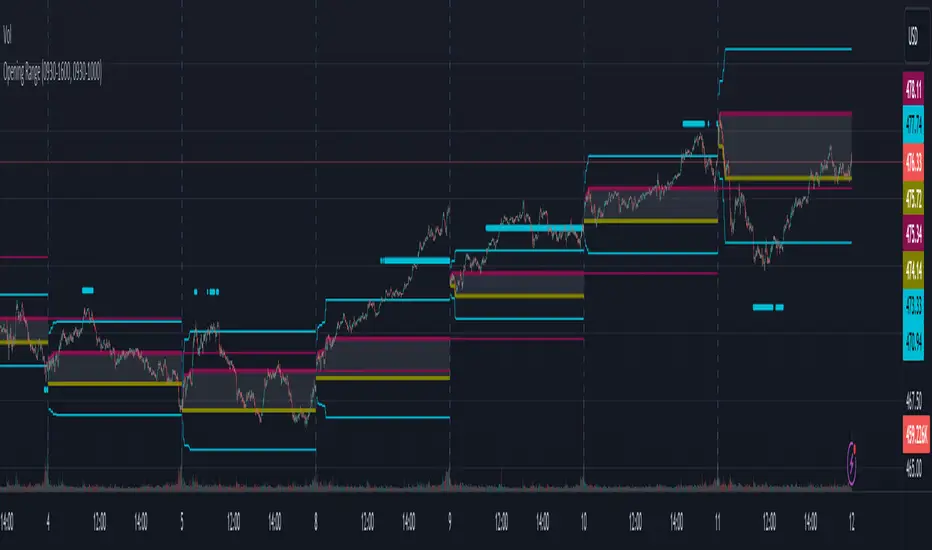
Opening RangeThe opening range or first 30 minutes of trading during the day sets the tone and becomes an important reference through the rest of the day. Price will react as it reaches the high and low of the opening range.
Backtesting has shown that the strategies based on the opening range have merit and provide an edge in trading. By not being aware of these points of reference you put yourself at risk.
In addition to the opening range, the distance from the high or low of the opening range plus the width of the opening range forms another important reference point.
Opening Range Rules.
Price must break out of the opening range in order to have a trending day. As long as price is inside the opening range, expect the trade to be choppy.
Once price leaves the opening range the market can begin to trend. However, before it trends most times it will retest the boundary of the opening range. This is a critical point, and a better than average entry for a position to join the trend. However, if price closes back inside the opening range watch out. Re-entry to the opening range has a high probability of going to the middle of the opening range, and a better than average probability of crossing the entire opening range.
In the above chart we can see price broke below the opening range then returned to retest the opening range before beginning a downward trend that delivered 175 pts on NQ.
Upon re-entering the opening range price tried to break down again but ultimately traveled up until it hit the 50% mark of the opening range.
Once a trend has begun the first target is the green line which is 1 width of the opening range outside of the opening range.
Once price broke out of the opening range to the upside, it came back to retest the opening range high, before beginning an uptrend that delivered 120 pts on NQ.
VWAP RangeThe VWAP Range indicator is a highly versatile and innovative tool designed with trading signals for trading the supply and demand within consolidation ranges.
What's a VWAP?
A VWAP (Volume Weighted Average Price) represents an equilibrium point in the market, balancing supply and demand over a specified period. Unlike simple moving averages, VWAP gives more weight to periods with higher volume. This is crucial because large volumes indicate significant trading activity, often by institutional traders, whose actions can reflect deeper market insights or create substantial market movements. The VWAP is also often used as a benchmark to evaluate the efficiency of executed trades. If a trader buys below the VWAP and sells above it, they are generally considered to have transacted favourably.
This is how it works:
Multiple VWAP Anchors:
This indicator uses multiple VWAPs anchored to different optional time periods, such as Daily, Weekly, Monthly, as well as to the highest high a lowest low within those periods. This multiplicity allows for a comprehensive view of the market’s average price based on volume and price, tailored to different trading styles and strategies.
Dynamic and Fixed Periods:
Traders can choose between using dynamic ranges, which reset at the start of each selected period, and specifying a date and time for a particular fixed range to trade. This flexibility is crucial for analyzing price movements within specific ranges or market phases.
Fixed ranges allow VWAPs to be calculated and anchored to a significant market event, the beginning of a consolidation phase or after a major news announcement.
Signal Generation:
The indicator generates buy and sell signals based on the relationship of the price to the VWAPs. It also allows for setting a maximum number of signals in one direction to avoid overtrading or pyramiding. Be sure to wait for the candle close before trading on the signals.
Average Buy/Sell Signal Lines:
Lines can be plotted to display the average buy and sell signal prices. The difference between the lines shows the average profit per trade when trading on the signals in that range. It's a good way to see how profitable a range is on average without backtesting the signals. The lines will also often turn into support and resistance areas, similar to value areas in a volume profile.
Customizable Settings:
Traders have control over various settings, such as the VWAP calculation method and bar color. There are also tooltips for every function.
Hidden Feature:
There's a subtle feature in this indicator: if you have 'Indicator values' turned on in TradingView, you'll see a Sell/Buy Ratio displayed only in the status line. This ratio indicates whether there are more sell signals than buy signals in a range, regardless of the Max Signals setting. A red value above 1 suggests that the market is trending upward, indicating you might want to hold your long positions a bit longer. Conversely, a green value below 1 implies a downward trend.

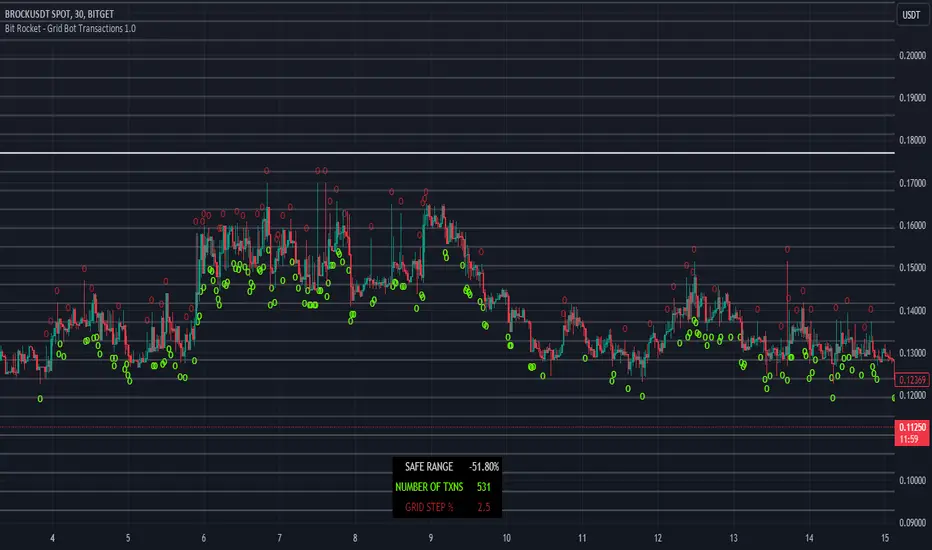
Bit Rocket - Grid Bot Transactions 1.0DESCRIPTION
A grid bot is an automated trading bot that is designed to execute buy and sell orders based on a pre-defined grid of prices. Grid bots operate within a specified price range, placing trades at set intervals above and below the current market price. The key idea behind a grid bot is to take advantage of price fluctuations and market volatility.
The Grid Bot Transactions Indicator serves as a valuable tool for identifying the most suitable trading pairs and optimizing the grid bot percentage, also known as the grid level configuration. This indicator assists in the selection of pairs that are likely to yield the best results and aids in determining the ideal configuration for grid bot trading.
USAGE
NUMBER OF TRANSACTIONS - will calculate the number of times the price moves up and down by the grid level percentage for a particular trading pair. Each move up and down is counted as a transaction, total transactions are then calculated from the date range set by the user.
RANGE - number represents the swing from the highest price to the lowest price during the date range set by the user, this will assist in determining what grid range could be used when configuring the grid bot.
GRID STEP (%) - This is the distance for each buy and sell set by the user, for example if the grid step % is set at 2% then for each 2% move up or down that occurs will count as one transaction. Try different grid step percentages to see what percentage produces the best results, too high and transactions will lower but profit per sell transaction will be greater, too small results in higher trading fees and lower profit per sell transaction. Using 1.5% - 5% for the grid step will make the most sense.
Armed with this knowledge the user can now compare against other pairs, determine the optimum grid level percentage, which pairs have more transactions, and determine transaction trend.
SETUP
When you first add the indicator to the chart you will see a pop-up reminding you to set the From Date Time for Bit Rocket Grid Bot Transactions 1.0, just click anywhere on the chart to add.
1. Change timeframe to 30m
2. Under Inputs – Grid Settings change the From Date & Time field
3. Under Inputs – Grid Settings change Size of Grid % or leave at default 2.5%
4. If grid and buy and sell symbols are in the way, go to ‘Style’ tab and turn off all the signals and Lines options.
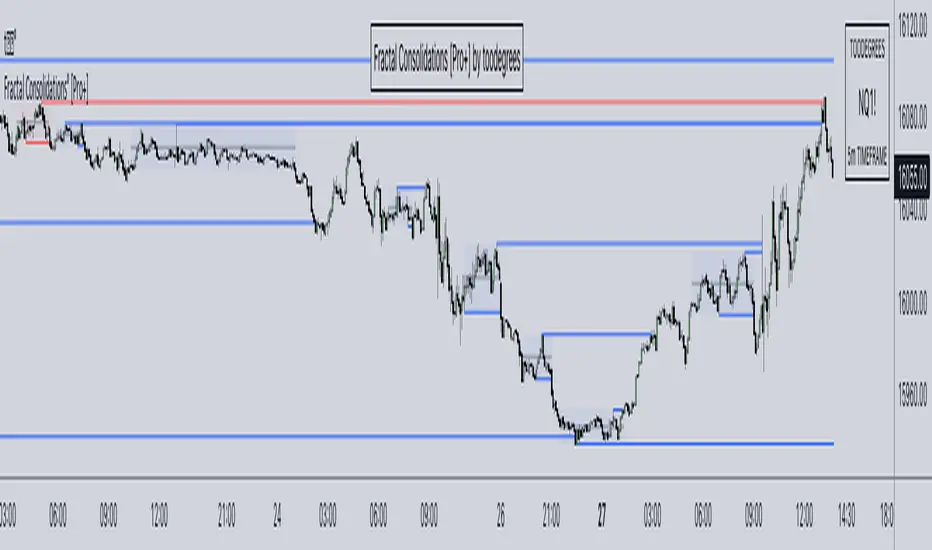
Fractal Consolidations [Pro+]Introduction:
Fractal Consolidations Pro+ pushes the boundaries of Algorithmic Price Delivery Analysis. Tailored for traders seeking precision and efficiency to unlock hidden insights, this tool empowers you to dissect market Consolidations on your terms, live, in all asset classes.
What is a Fractal Consolidation?
Consolidations occur when price is trading in a range. Normally, Consolidation scripts use a static number of "lookback candles", checking whether price is continuously trading inside the highest and lowest price points of said Time window.
After years spent studying price action and numerous programming attempts, this tool succeeds in veering away from the lookback candle approach. This Consolidation script harnesses the delivery mechanisms and Time principles of the Interbank Price Delivery Algorithm (IPDA) to define Fractal Consolidations – solely based on a Timeframe Input used for context.
Description:
This concept was engineered around price delivery principles taught by the Inner Circle Trader (ICT). As per ICT, it's integral for an Analyst to understand the four phases of price delivery: Consolidation , Expansion , Retracement , and Reversal .
According to ICT, any market movement originates from a Consolidation, followed by an Expansion .
When Consolidation ranges begin to break and resting liquidity is available, cleaner Expansions will take place. This tool's value is to visually aid Analysts and save Time in finding Consolidations in live market conditions, to take advantage of Expansion moves.
CME_MINI:ES1! 15-Minute Consolidation setting up an Expansion move, on the 10 Minute Chart:
Fractal Consolidations Pro+ doesn't only assist in confirming Higher Timeframe trend continuations and exposing opportunities on Lower Timeframes. It's also designed for both advanced traders and new traders to save Time and energy in navigating choppy or rangebound environments.
CME_MINI:ES1! 30 Minute Consolidation forming Live, on the 5 Minute Chart:
By analyzing past price action, traders will find algorithmic signatures when Consolidations are taking place, therefore providing a clearer view of where and when price is likely to contract, continue consolidating, breakout, retrace, or reverse. A prominent signature to consider when using this script is ICT's Market Maker Buy/Sell Models. These signatures revolve around the engineering of Consolidations to manipulate price in a specific direction, to then reverse at the appropriate Time. Each stage of the Market Maker Model can be identified and taken advantage of using Fractal Consolidations.
CME_MINI:NQ1! shift of the Delivery Curve from a Sell Program to a Buy Program, Market Maker Buy Model
Key Features:
Tailored Timeframes: choose the Timeframe that suits your model. Whether you're a short-term enthusiast eyeing 1 Hour Consolidations or a long-term trend follower analyzing 4 Hour Consolidations, this tool gives you the freedom to choose.
FOREXCOM:EURUSD Fractal Consolidations on a 15 Minute Chart:
Auto-Timeframe Convenience: for those who prefer a more dynamic and adaptive approach, our Auto Timeframe feature effortlessly adjusts to the most relevant Timeframe, ensuring you stay on top of market consolidations without manually adjusting settings.
Consolidation Types: define consolidations as contractions of price based on either its wick range or its body range.
COMEX:GC1! 4 Hour Consolidation differences between Wick-based and Body-based on a 1 Hour Chart:
Filtering Methods: combine previous overlapping Consolidations, merging them into one uniform Consolidation. This feature is subject to repainting only while a larger Consolidation is forming , as smaller Consolidations are confirmed. However once established, the larger Consolidation will not repaint .
FOREXCOM:GBPUSD 15 Minute Consolidation Differences between Filter Consolidations ON and OFF:
IPDA Data Range Filtering: this feature gives the Analyst control for selective visibility of Consolidations in the IPDA Data Range Lookback . The Analyst can choose between 20, 40, and 60 days as per ICT teachings, or manually adjust through Override.
INDEX:BTCUSD IPDA40 Data Range vs. IPDA20 Data Range:
Extreme Float: this feature provides reference points when the price is outside the highest or lowest liquidity levels in the chosen IPDA Data Range Lookback. These Open Float Extremes offer critical insights when the market extends beyond the Lookback Consolidation Liquidity Levels . This feature helps identify liquidity extremes of interest that IPDA will consider, which is crucial for traders in understanding market movements beyond the IPDA Data Ranges.
INDEX:ETHUSD Extreme Float vs. Non-Extreme Float Liquidity:
IPDA Override: the Analyst can manually override the default settings of the IPDA Data Range Lookback, enabling more flexible and customized analysis of market data. This is particularly useful for focusing on recent price actions in Lower Timeframes (like viewing the last 3 days on a 1-minute timeframe) or for incorporating a broader data range in Higher Timeframes (like using 365 days to analyze Weekly Consolidations on a daily timeframe).
Liquidity Insight: gain a deeper understanding of market liquidity through customizable High Resistance Liquidity Run (HRLR) and Low Resistance Liquidity Run (LRLR) Consolidation colors. This feature helps distinguishing between HRLR (high resistance, delayed price movement) and LRLR (low resistance, smooth price movement) Consolidations, aiding in quick assessment of market liquidity types.
TVC:DXY Low Resistance vs. High Resistance Consolidation Liquidity Behaviour and Narrative:
Liquidity Raid Type: decide whether to categorize a Consolidation liquidity raid by a wick or body trading through a level.
CBOT:ZB1! Wick vs. Body Liquidity Raid Type:
Customizable User Interface: tailor the visual representation to align with your preferences. Personalize your trading experience by adjusting the colors of consolidation liquidity (highs and lows) and equilibrium, as well as line styles.
Tập lệnh trả phí
Monday range by MatboomThe "Monday Range" Pine Script indicator calculates and displays the lowest and highest prices during a specified trading session, focusing on Mondays. Users can configure the trading session parameters, such as start and end times and time zone. The indicator visually highlights the session range on the chart by plotting the session low and high prices and applying a background color within the session period. The customizable days of the week checkboxes allow users to choose which days the indicator should consider for analysis.
Session Configuration:
session = input.session("0000-0000", title="Trading Session")
timeZone = input.string("UTC", title="Time Zone")
monSession = input.bool(true, title="Mon ", group="Trading Session", inline="d1")
tueSession = input.bool(true, title="Tue ", group="Trading Session", inline="d1")
Users can configure the trading session start and end times and the time zone.
Checkboxes for Monday (monSession) and Tuesday (tueSession) sessions are provided.
SessionLow and SessionHigh Functions:
SessionLow(sessionTime, sessionTimeZone=syminfo.timezone) => ...
SessionHigh(sessionTime, sessionTimeZone=syminfo.timezone) => ...
Custom functions to calculate the lowest (SessionLow) and highest (SessionHigh) prices during a specified trading session.
InSession Function:
InSession(sessionTimes, sessionTimeZone=syminfo.timezone) => ...
Determines if the current bar is inside the specified trading session.
Days of Week String and Session String:
sessionDays = ""
if monSession
sessionDays += "2"
if tueSession
sessionDays += "3"
tradingSession = session + ":" + sessionDays
Constructs a string representing the selected days of the week for the session.
Fetch Session Low and High:
sessLow = SessionLow(tradingSession, timeZone)
sessHigh = SessionHigh(tradingSession, timeZone)
Calls the custom functions to obtain the session low and high prices.
Plot Session Low and High and Background Color for Session
plot(sessLow, color=color.red, title="Session Low")
plot(sessHigh, color=color.red, title="Session Low")
bgcolor(InSession(tradingSession, timeZone) ? color.new(color.aqua, 90) : na)

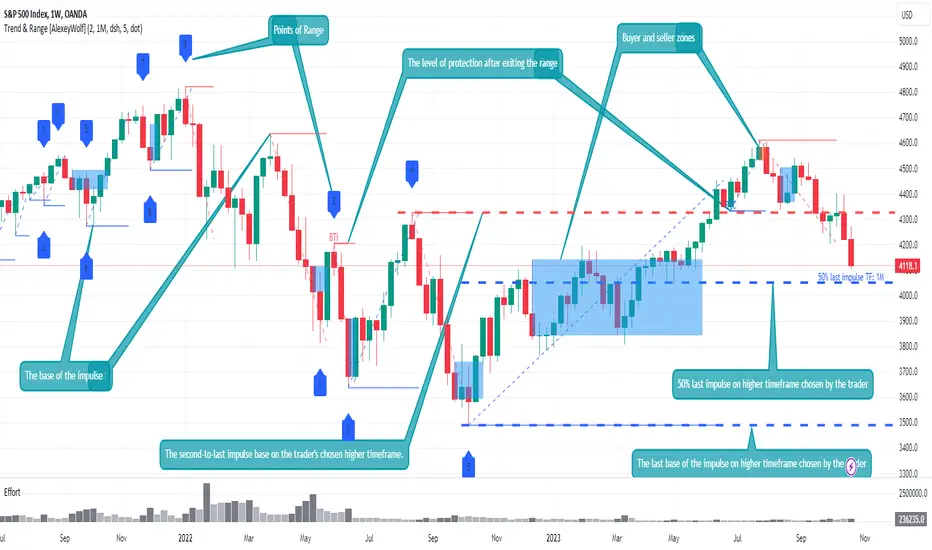
Advanced VSA: Trend and Range LevelsThe indicator is designed for traders who are more interested in market structures and price action using volumes. Analyzing volumes, key market levels, market phases (trend or range/sideways), and multiple timeframes can help the trader build a clearer and more comprehensive view of the market. The data analysis algorithm is developed based on VSA methods, elements of the ICT concept, and the results of my research to assist trader in gaining a better understanding of the market and uncovering information that might go unnoticed.
The key idea is to consider multiple timeframes in trading. Understanding larger market movements from higher timeframes can provide a deeper context when making trading decisions, aiming to assist in more effective entries and exits. This is achieved by identifying the trend and its support levels on multiple timeframes, identifying ranges and their current boundaries, as well as buyer and seller interest zones.
Key Features
Trend Identification: The indicator determines the trend and its current support level. All significant price &movements occur in the form of impulses (either by sellers or buyers). An impulse consists of one or several consecutive candlesticks, at least one of which has a closing price beyond the boundaries of the previous impulse. The indicator displays the base of the impulse and/or the entire impulse. The base of the impulse represents the trend's support level.
Range Identification: The indicator can identify ranges and their current boundaries. Institutional traders take positions within price ranges, and many market reversals occur after flats. A range is a sequential price movement up and down within a specific price range. A range is formed by a minimum of 4 points, 2 above and 2 below, and is defined by its boundaries. The indicator detects ranges based on two (two consecutive impulses in one direction) or three impulses (the first and third in one direction, and the second in the opposite direction). The indicator displays the current boundary points of the range and the level of protection after exiting the range and initiating a trend.
Buyer and seller zones within impulses: After the impulse ends, a correction occurs. It is advisable to look for entry points during this correction in the direction of the impulse from the zone of interest of the owner of the impulse: the buyer's zone for a long impulse and the seller's zone for a short impulse. A zone consists of a series of consecutive candlesticks grouped on the chart in a specific manner.
Multi-Timeframe Trend Identification: The indicator also identifies the trend on two higher timeframes and displays the two latest bases of impulses from those higher timeframes on the chart.
Additional Features
Identification of Test Levels and Effort. A test is the price's return to a zone or to a candle of effort, followed by a continuation in the direction of the initial price movement. It is characterized by the test level. An effort or effort candle is a single candle that is individually larger in volume than the previous 2.
Example Use Cases
You can display the base levels of impulses from a 4-hour time frame and a daily time frame on a 15-minute chart to keep track of important levels from higher timeframes.
By exploring different timeframes, you can identify consolidations (range/sideways movements) and trade within them in the direction of the trend from higher timeframes.
If the market is in a trending phase (the presence of a trend is determined by two consecutive impulses in the same direction), look for trades in the direction of the impulse, following these priorities:
When the impulse base level is protected by the host of the impulse.
During corrections, look for buy trades in the buyer's zone for an uptrend and sell trades in the seller's zone for a downtrend.
During corrections, look for buy trades from a buyer's effort candle for an uptrend and sell trades from a seller's effort candle for a downtrend.
If the market is in a consolidation phase (range), look for trades:
When the current or maximum/minimum historical boundaries of the consolidation (range) are protected, look for trades towards the opposite current boundary.
If the price exits the consolidation/range (closes outside all consolidation boundaries, including both current and historical boundaries), then during corrections, look for trades in the direction of the exit.
Settings
Trend: Display base levels of impulses and/or the entire impulse. Sideways Ranges (Sideways Markets): Display the required number of sideways ranges on the chart, along with protection levels for exiting the sideways range. There are two modes for finding sideways ranges. The first mode requires touching points. The second mode (advanced) does not require precise touching of points if there are increased volumes at the extreme points of the sideways range. Touching these volumes is sufficient for the price.
Zones: Display zones on the chart. Choose the types of displayed zones and their colors. They are divided into three types. The first type is the most promising for finding trades. Type 3 represents more aggressive trades.
Test Levels: Display test levels for zones and efforts on the chart. There are three types of test levels. The first type is the most promising for finding trades. Type 3 is not recommended for finding trades as it represents the most aggressive trades.
Higher Time Frames: Choose 2 timeframes and the types of displayed impulse base lines.
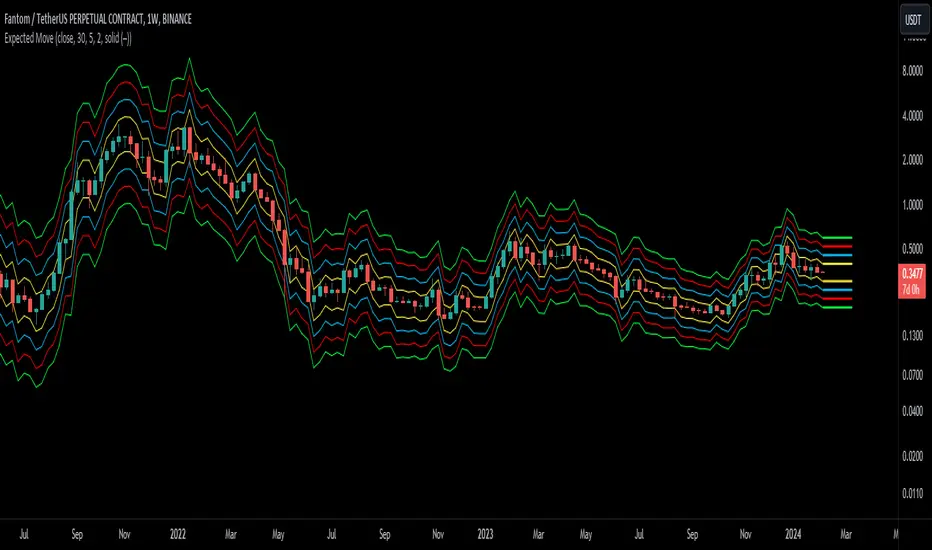
Expected Move BandsExpected Moves
The Expected Move of a security shows the amount that a stock is expected to rise or fall from its current market price based on its level of volatility or implied volatility. The expected move of a stock is usually measured with standard deviations.
An Expected Move Range of 1 SD shows that price will be near the 1 SD range 68% of the time given enough samples.
Expected Move Bands
This indicator gets the Expected Move for 1-4 Standard Deviation Ranges using Historical Volatility. Then it displays it on price as bands.
The Expected Move indicator also allows you to see MTF Expected Moves if you want to.
This indicator calculates the expected price movements by analyzing the historical volatility of an asset. Volatility is the measure of fluctuation.
This script uses log returns for the historical volatility calculation which can be modelled as a normal distribution most of the time meaning it is symmetrical and stationary unlike other scripts that use bands to find "reversals". They are fundamentally incorrect.
What these ranges tell you is basically the odds of the price movement being between these levels.
If you take enough samples, 95.5% of the them will be near the 2nd Standard Deviation. And so on. (The 3rd Standard deviation is 99.7%)
For higher timeframes you might need a smaller sample size.
Features
MTF Option
Parameter customization
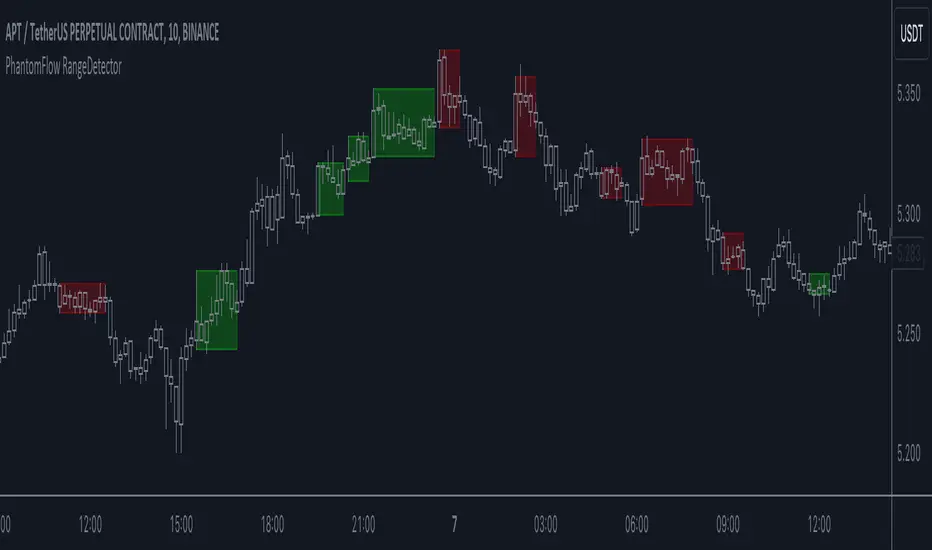
PhantomFlow RangeDetectorPhantomFlow RangeDetector analyzes the current price action of the market and draws ranges depending on the minimum number of bars in the zone of one candle you specify. Each range is colored depending on the closing direction of the candle outside this range. Accordingly, in trend trading, it is advisable to look for long trades from the green zones, and short trades from the red zones (with standard color settings).
If you have a basic understanding of the market context, you can consider such zones in a mirror retest to find trades with higher RR.
Range Detector [LuxAlgo]The Range Detector indicator aims to detect and highlight intervals where prices are ranging. The extremities of the ranges are highlighted in real-time, with breakouts being indicated by the color changes of the extremities.
🔶 USAGE
Ranging prices are defined by a period of stationarity, that is where prices move within a specific range.
Detecting ranging markets is a common task performed manually by traders. Price breaking one of the extremities of a range can be indicative of a new trend, with an uptrend if price breaks the upper range extremity, and a downtrend if price breaks the lower range extremity.
Ranges are highlighted as zones and are set retrospectively, that is the starting point of a range is offset in the past. The exact moment a range is detected is highlighted by a gray background color. The average between the maximum/minimum of a zone is also highlighted as a dotted line and is also set retrospectively.
The range extremities are set in real-time, blue extremities indicate the range extremities were not broken, green extremities indicate that price broke the upper range extremity, while red extremities indicate price broke the lower range extremity.
Extremities are extended until a new range is detected, allowing past ranges extremities can be used as future support/resistances.
🔶 DETAILS
The detection algorithm used to detect ranges tests if all the prices within a user-set window are all within two extremities. These extremities are determined by the mean of the detection window plus/minus an ATR value.
When a new range is detected, the script checks if this new range overlaps with a previously detected range, if this is the case, both ranges are merged into one; updating the extremities of the previous range.
This can be observed with the real-time extremities changing within a highlighted zone.
🔶 SETTINGS
Minimum Range Length: Minimum amount of bars needed to detect a range.
Range Width: Multiplicative factor for the ATR used to detect new ranges. Lower values detect ranges with a lower width. Using higher values might return false positives.
ATR Length: ATR length used to determine the range width.

Volumetric Toolkit [LuxAlgo]The Volumetric Toolkit is a complete and comprehensive set of tools that display price action-related analysis methods from volume data.
A total of 4 features are included within the toolkit. Symbols that do not include volume data will not be supported by the script.
🔶 USAGE
The volumetric toolkit puts a heavy focus on price action, returning support/resistance levels, ranges, volume divergences...etc.
The main premise between each feature is that volume has a direct relationship with market participants level of interest over a specific symbol, and that this interest is not constant over time.
Each individual feature is detailed below.
🔹 Ranges Of Interest
The Ranges Of Interest construct a range from a surge of high liquidity in the market. This range is constructed from the price high and price low of the candle with the associated significant liquidity.
The returned extremities can be used as support and resistance, with breakouts often being accompanied by significant liquidity as well, suggesting potential trend continuations.
The length setting associated with this feature determines how sensitive the range detection algorithm is to volume, with higher values requiring more significant volume in order to display a new range.
🔹 Impulses
Impulses highlight times when volume makes a new higher high while the price makes a new higher high or lower low, suggesting increased market participation.
When this occurs when the price makes a new higher high the impulse is considered bullish (green), if the price makes a new lower low the impulse is bearish (red).
Impulses occurring within an established trend opposite to it (e.g a bearish impulse on an uptrend) might be indicative of reversals.
The length setting works similarly to the previously described ranges of interest, with higher values requiring longer-term volume higher high and price higher high/lower low, highlighting more significant impulse and potentially longer-term reversals.
🔹 Levels Of Interest
Levels of interest display price levels of significant trading activity, contrary to the range of interest only the closing price is taken into account, also volume peaks are used to detect significant trading activity.
Note that this feature is subject to backpainting, that is lines are set retrospectively.
Users can determine the amount of most recent levels to display on the chart. These can be used as classical support/resistances.
🔹 Volume Divergence
We define volume divergence as a decreased market participation while a trend is still developing.
More precisely volume divergences are highlighted if volume makes a lower high while price is making a new higher high/lower low.
This can be indicative of a lack of further participation in the current trend, indicating a potential reversal.
Using higher length values will return longer-term divergences.
Note that this feature is subject to backpainting, that is lines are set retrospectively.
🔶 SETTINGS
🔹 Ranges Of Interest
Show Ranges Of Interest: Display Ranges Of Interest.
Length: Ranges Of Interest sensitivity to volume.
🔹 Impulses
Show Impulses: Display Ranges Of Interest.
Length: Impulses sensitivity to volume.
🔹 Levels Of Interest
Show: Determine if Levels Of Interest are displayed, and how many from the most recent.
Length: Level detection sensitivity to volume.
🔹 Volume Divergences
Show Divergences: Determine if Volume Divergences are displayed.
Length: Period for the detection of price tops/bottoms and volume peaks.

Supertrend x4 w/ Cloud FillSuperTrend is one of the most common ATR based trailing stop indicators.
The average true range (ATR) plays an important role in 'Supertrend' as the indicator uses ATR to calculate its value. The ATR indicator signals the degree of price volatility. In this version you can change the ATR calculation method from the settings. Default method is RMA, when the alternative method is SMA.
The indicator is easy to use and gives an accurate reading about an ongoing trend. It is constructed with two parameters, namely period and multiplier.
The implementation of 4 supertrends and cloud fills allows for a better overall picture of the higher and lower timeframe trend one is trading a particular security in.
The default values used while constructing a supertrend indicator is 10 for average true range or trading period.
The key aspect what differentiates this indicator is the Multiplier. The multiplier is based on how much bigger of a range you want to capture. In our case by default, it starts with 2.636 and 3.336 for Set 1 & Set 2 respectively giving a narrow band range or Short Term (ST) timeframe visual. On the other hand, the multipliers for Set 3 & Set 4 goes up to 9.736 and 8.536 for the multiplier respectively giving a large band range or Long Term (LT) timeframe visual.
A ‘Supertrend’ indicator can be used on equities, futures or forex, or even crypto markets and also on minutes, hourly, daily, and weekly charts as well, but generally, it fails in a sideways-moving market. That's why with this implementation it enables one to stay out of the market if they choose to do so when the market is ranging.
This Supertrend indicator is modelled around trends and areas of interest versus buy and sell signals. Therefore, to better understand this indicator, one must calibrate it to one's need first, which means day trader (shorter timeframe) vs swing trader (longer time frame), and then understand how it can be utilized to improve your entries, exits, risk and position sizing.
Example:
In this chart shown above using SPX500:OANDA, 15R Time Frame, we can see that there is at any give time 1 to 4 clouds/bands of Supertrends. These four are called Set 1, Set 2, Set 3 and Set 4 in the indicator. Set's 1 & 2 are considered short term, whereas Set's 3 & 4 are considered long term. The term short and long are subjective based on one's trading style. For instance, if a person is a 1min chart trader, which would be short term, to get an idea of the trend you would have to look at a longer time frame like a 5min for instance. Similarly, in this cases the timeframes = Multiplier value that you set.
Optional Ideas:
+ Apply some basic EMA/SMA indicator script of your choice for easier understanding of the trend or to allow smooth transition to using this indicator.
+ Split the chart into two vertical layouts and applying this same script coupled with xdecow's 2 WWV candle painting script on both the layouts. Now you can use the left side of the chart to show all bearish move candles only (make the bullish candles transparent) and do the opposite for the right side of the chart. This way you enhance focus to just stick to one side at a given time.
Credits:
This indicator is a derivative of the fine work done originally by KivancOzbilgic
Here is the source to his original indicator: ).
Disclaimer:
This indicator and tip is for educational and entertainment purposes only. This not does constitute to financial advice of any sort.

Range Breakout Signals (Intrabar) [LuxAlgo]The Range Breakout Signals (Intrabar) is a novel indicator highlighting trending/ranging intrabar candles and providing signals when the price breaks the extremities of a ranging intrabar candles.
🔶 USAGE
The indicator highlights candles with trending intrabar prices, with uptrending candles being highlighted in green, and down-trending candles being highlighted in red.
This highlighting is affected by the selected intrabar timeframe, with a lower timeframe returning a more precise estimation of a candle trending/ranging state.
When a candle intrabar prices are ranging the body of the candle is hidden from the chart, and one upper & lower extremities are displayed, the upper extremity is equal to the candle high and the lower extremity to the candle low. Price breaking one of these extremities generates a signal.
The indicator comes with two modes, "Trend Following" and "Reversal", these modes determine the extremities that need to be broken in order to return a signal. The "Trend Following" mode as its name suggests will provide trend-following signals, while "Reversal" will aim at providing early signals suggesting a potential reversal.
🔶 DETAILS
To determine if intrabar prices are trending or ranging we calculate the r-squared of the intrabar data, if the r-squared is above 0.5 it would suggest that lower time frame prices are trending, else ranging.
This approach allows almost obtaining a "settings" free indicator, which is uncommon. The intrabar timeframe setting only controls the intrabar precision, with a timeframe significantly lower than the chart timeframe returning more intrabar data as a result, this however might not necessarily affect the displayed information by the indicator.
🔶 SETTINGS
Intrabar Timeframe: Timeframe used to retrieve the intrabar data within a chart candle. Must be lower than the user chart timeframe.
Auto: Select the intrabar timeframe automatically. This setting is more adapted to intraday charts.
Mode: Signal generation mode.
Filter Out Successive Signals: Allows removing successive signals of the same type, returning a more easily readable chart.

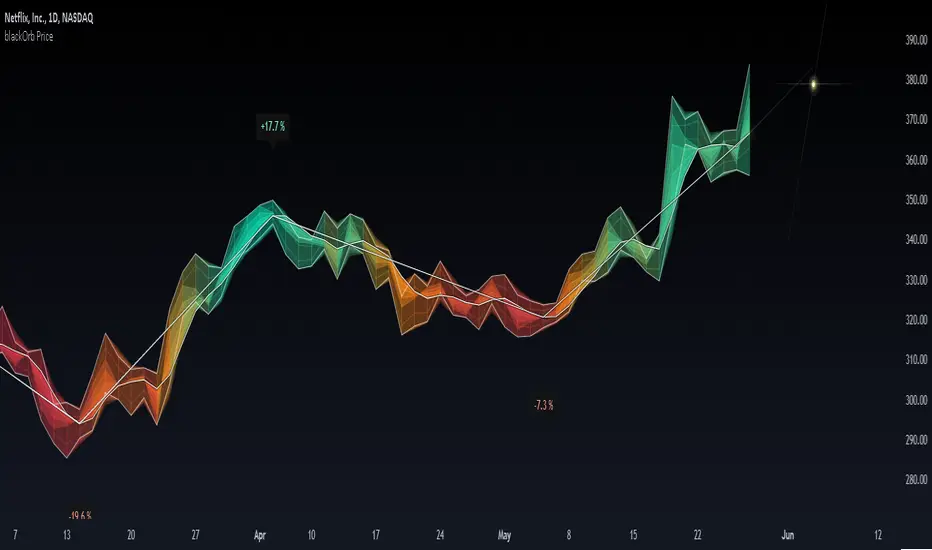
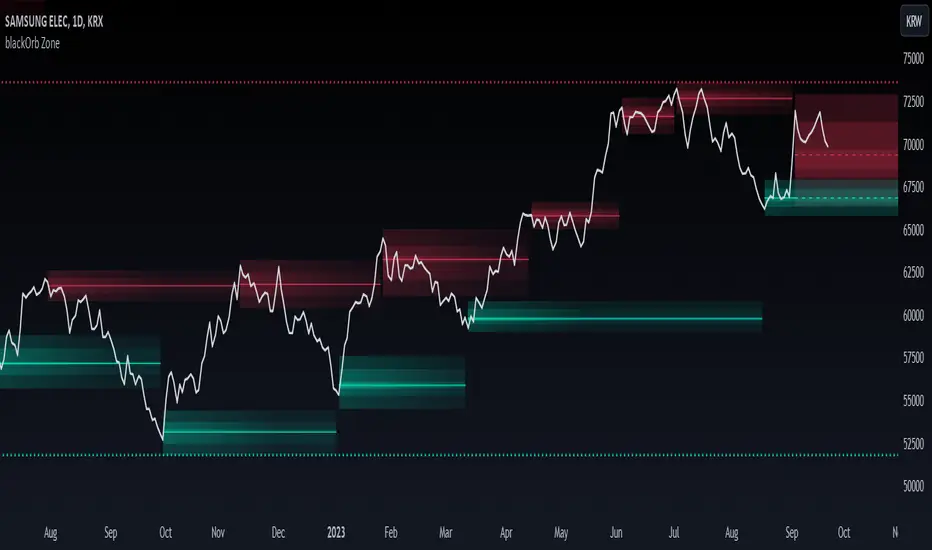
blackOrb ZoneBuying near the bottom and selling near the peak can be a challenging trading approach. However, it all begins with the ability to identify these essential zones. This indicator is targeting support and resistance with heightened accuracy. It utilizes features like:
I. Multi-Level Weighting for Enhanced Support and Resistance Zones
II. Vertical Zone Range Adjustment for Enhanced Price Level Identification
III. High-Time Frame for Solid Macro Validation
IV. Projection Function for Informed Trade Management
V. Automatic Level Identification for Pinpointing Potential Order Positions
VI. Customizable Pivot Analysis for Accurate Zone Identifications
Technical Methodology
I. Multi-Level Weighting for Enhanced Support and Resistance Zones
Support and resistance are more accurately represented as wider zones rather than singular lines. In practical application, relevant support or resistance levels often converge around a central mean-weighted level within a zone.
This indicator visually represents these zones by calculating values from open, high, low, and close prices, accentuating them through varying opacities. Higher opacity within an area indicates a higher likelihood of it serving as a relevant support or resistance level.
Multiple mean options within the settings menu encompass weighted average calculations that utilize different combinations of price data within the relevant pivot analysis phase. This versatility allows users to target pertinent levels within a zone. For instance, when employing hlcc4 price data, the calculation is as follows:
mean_price_hlcc4 = (high + low + close + close) / 4
II. Vertical Zone Range Adjustment for Enhanced Price Level Identification
This feature enables users to precisely adjust the vertical zone range for price references within potential support or resistance phases. For instance, decreasing the reference setting results in a more granular validation within a narrower range. This creates vertically thinner zones with increased price level precision, although it may offer a less comprehensive perspective.
III. High-Time Frame for Solid Macro Validation
The indicator enhances pivot points, potentially in conjunction with high-time frame validation, to identify significant price zones with heightened confirmation strength driven by volume. Higher time frames provide more extensive volume verification, for instance, comparing the 4-hour to the 24-hour timeframe (a multiple of six).
This feature involves cross-referencing data from higher time frames, heightening the reliability of support and resistance zones and providing valuable insights into potential trading interest levels.
Technically, the indicator applies the identical rigorous analysis to both lower and higher time frames. This approach facilitates a more comprehensive perspective and aids in the clearer identification of overarching macro support and resistance levels, even when focusing on smaller timeframes. For instance, a potential support zone identified on the daily time frame can gain higher confidence when confirmed on a weekly chart.
IV. Projection Function for Informed Trade Management
The projection function visually extends the most recent analysis of support and resistance zones forward, in accordance with the user's configured parameters.
By displaying precise price values at these visualized support and resistance levels, this indicator offers valuable assistance in decision-making, particularly when planning real-time orders or when engaged in an active trade management phase (e.g., for the purpose of adjusting stop-loss levels post-entry).
Note: This function is based on historical data. It may not account for unforeseen market events. It's important to complement this feature with ongoing analysis of real-time market data.
V. Automatic Level Identification for Pinpointing Potential Order Positions
It is empirically observed that traders frequently position orders at price levels that conform to quantized values due to cognitive biases.*
Consequently, blackOrb Zone not only facilitates the identification of pertinent levels within a weighted zone but also features an "auto" functionality designed to analyze price dynamics in the proximity of these relevant levels. The objective is to identify discrete values in close vicinity, which exhibit a higher likelihood of serving as authentic support and resistance zones.
This processing approach assists traders in precisely locating the central mean-weighted level within a given zone and identifies proximate quantized levels.
Note: This method becomes especially relevant during phases of price retesting, where market participants converge, contributing to a further refinement of levels, indicative of an asymmetric balance between supply and demand.
*Source: Prof. Mitchell, Jason. "Clustering and Psychological Barriers: The Importance of Numbers." Journal of Futures Markets, vol. 21, no. 5, 2001, pp. 395-428.
VI. Customizable Pivot Analysis for Accurate Zone Identifications
The indicator employs pivot points to pinpoint key price zones where price dynamics could encounter buying or selling pressure.
Essential components of this method involve comparing time units both to the left and right within a designated phase of support or resistance, effectively defining the search range for pivotal points.
For instance, in the analysis below, the search is for the highest price point that hasn't been surpassed within a certain resistance zone in the last 10 time units to the left and 10 time units to the right:
ta.pivothigh(10, 10)
Potential Trade Management Applications of blackOrb Zone
- Reversal Trading : Robust support zones with bullish signals can indicate opportune moments for buying or long position entries, whereas confirmed resistance zones can be identified for selling or short position entries.
- Breakout Trading : Anticipating price surges as price breach support or resistance level. A resistance breakout can signal a bullish price dynamic, while a support breakdown may suggest a bearish price dynamic.
- Range Trading : In lateral sideways markets, users can capitalize on support zones for buying and resistance zones for selling, profiting from price fluctuations.
- Take-Profit Management : For buying or long positions, resistance zones can be identified to determine suitable take-profit levels either within or near these zones - for short positions, vice versa with support zones.
- Stop-Loss Management : For buying or long positions, support zones can be identified to determine appropriate stop-loss levels beneath these zones - for short positions, vice versa with resistance zones to determine stop-loss levels above these zones.
Note on Usability
blackOrb Zone can have synergies with blackOrb Price as both indicators combined can give a bigger picture for supporting comprehensive and multifaceted data-driven trading analysis.
This tool was meticulously created to serve as an additional frame for the seamless integration of other more granular trading indicators. This indicator isn't intended for standalone trading application. Instead, it is serving as a supplementary tool for orientation within broader trading strategies.
Irrespective of market conditions, it can harmonize with a wider range of trading styles and instruments / trading pairs / indices like Stocks, Gold, FX, EURUSD, SPX500, GBPUSD, BTCUSD and Oil.
Inspiration and Publishing
Taking genesis from the inspirations amongst others provided by TradingView Pine Script Wizard Kodify, blackOrb Zone is a multi-encompassing script meticulously forged from scratch. It aspires to furnish a comprehensive approach, borne out of personal experiences and a strong dedication in supporting the trading community. We eagerly await valuable feedback to refine and further enhance this tool.
Fibonacci Ranges (Real-Time) [LuxAlgo]The "Fibonacci Ranges" indicator combines Fibonacci ratio-derived ranges (channels), together with a Fibonacci pattern of the latest swing high/low.
🔶 USAGE
The indicator draws real-time ranges based on Fibonacci ratios as well as retracements. Breakouts from a Fibonacci Channel are also indicated by labels, indicating a potential reversal.
Each range extremity/area can also be used as support/resistance.
🔶 CONCEPTS
Fibonacci Channels
Latest Fibonacci
Both, Latest Fibonacci and Fibonacci Channels , display different Fibonacci levels (labels not included in the code):
However, the 2 react in a totally different way.
🔹 Fibonacci Channels
2 conditions must be fulfilled until a Fibonacci Channel is displayed:
New swing high/low
close has to be between chosen limits/levels ( Break level )
As visual guidance, chosen Break levels are accentuated by 2 small gray blocks:
Once the channel is displayed, it will remain visible until x consecutive bars break out of the chosen Break level at closing time.
• x consecutive bars is set by Break count .
The amount of breaks is counted in the code. When the price, without breaking the user-set limit, closes back between the 2 levels, the count is reset to 0.
By enabling Channels and Shadows you can see previous channels (" Shadows ", which is always delayed with 1 bar)
Previous channels can be helpful in finding potential support/resistance areas, especially from large channel blocks
The more narrow Break levels are set the less chance the price closes between these 2 levels, and the quicker close breaks out.
In other words, narrow levels give fewer & smaller channels, broader levels give more & larger channels.
Note:
• swing settings: L & R
• Break count (x consecutive bars that close outside chosen levels to invalidate the Fibonacci Channel )
will also be of influence in displaying the channels.
• Show breaks enable you to visualize signals when there is a break:
• Alerts can also be set ( Break Down / Break Up )
🔹 Latest Fibonacci
This displays the Fibonacci levels between the latest swing high and swing low, independently from the Fibonacci Channel .
The Lastest Fibonacci can be helpful in detecting the current trend against the larger Fibonacci Channel .
🔶 SETTINGS
🔹 Swing Settings
L: set left of pivothigh / pivotlow
R: set right of pivothigh / pivotlow
🔹 Fibonacci Channels
Channel : Channel / Channels + Shadows / None
Break level
-0.382 - 1.382
0.000 - 1.000
0.236 - 0.764
0.382 - 0.618
Break count
🔹 Fibonacci
Toggle
Colours: [ -0.382 - 0 ], [ 0.236 - 0.382 ], [ 0.5 ], [ 0.618 - 0.764 ], [ 1 - 1.382 ]

blackOrb PriceblackOrb's Aspiration: Enhancing the Functionality of Area Charts
At its core, an area chart analysis serves as the foundational structure for blackOrb Price. Area charts can be seen as an addition to conventional price charts. Unlike price line charts, which connect closing prices with lines, an area chart fills the space between high and low prices, creating a visual representation of price ranges. This approach can offer several advantages, particularly in assessing price volatility and price dynamics.
A wider area between high and low suggests high volatility, while a narrower area indicates lower volatility. The orientation of the closing price concerning the high-low range provides insights into whether buyers or sellers are exerting influence on the market.
Combined with the following elements, this chart tool can support comprehensive data-driven trading analysis:
- Integrated moving averages for price dynamic insights
- Zigzag pivot identification for price level insights
- Stochastic lookback analysis for turning point insights
- Ghost mode for comparative insights
Technical Methodology
I. Integrated Moving Averages for Price Dynamic Insights
Incorporating various MA alternatives allows traders to gain insights into not only price dynamics but also their underlying strength, which is reflected in trading activity. This strength is visually depicted by the derived price line within blackOrb's Price Area Chart.
Among the array of MA alternatives, VWMA stands out as a suitable implementation choice for integrating volume data. It goes beyond the scope of a simple moving average, considering both price and volume in its calculation, as shown in the following formula:
(C1 x V1 + C2 x V2 + ... + CN x Vn) / (V1 + V2 + ... + Vn)
II. Zigzag Pivot Identification for Price Level Insights
Zigzag Pivot Identification can be a valuable tool for recognizing possible price movements and potential turning points. It operates by pinpointing pivotal moments where prices alter their course. Essential components of this method involve comparing time units both to the left and right within a designated price dynamic phase, effectively defining the search range for pivotal points.
For instance, in the analysis below, the search is for the highest price point that hasn't been surpassed in the last 10 time units to the left and 10 time units to the right:
ta.pivothigh(10, 10)
The lookback variables analyze price points by simultaneously examining a specified number of time units before and after a potential pivot point as the central reference. A pivot is identified when a price point remains unbreached throughout this period.
Note: This method retroactively validates structures, implying that this tool may redraw or adjust its values as price data evolves. This leads to inconsistency and a lack of predictability.
III. Stochastic Lookback Analysis for Turning Point Insights
The stochastic calculation methodology of this feature centers around the following formula:
100 * (close - lowest(low, length)) / (highest(high, length) - lowest(low, length))
This key formula employs a stochastic calculation methodology that assesses the percentage deviation of the closing price from the lowest low over a specified timeframe (length), relative to the span between the highest high and the lowest low. The outcome is normalized within a range of 0 to 100, providing insights into the relative position of the closing price within the high-low range. Traders can define the specific periods over which the stochastic calculation is performed.
Based on this stochastic analysis, the indicator integrates area chart coloring, affording users the flexibility to adjust the sensitivity of area chart coloring according to customized stochastic look-back evaluation phases. Consequently, the coloration by length evaluation can mirror a comprehension of market dynamics.
Note: However, it's important to recognize that the efficacy of evaluation coloring might be compromised during periods of lateral price movement, characterized by less prominent market trends.
IV. Ghost Mode for Comparative Insights
Unveiling convergences and divergences, the Ghost Mode overlays two price charts, which can reveal price trajectories and reactions (e.g. Apple stock's potential response to the NASDAQ 100 Technology Sector Index).
Note: This approach may not capture nuanced correlations during intricate market scenarios.
Note on Usability
This tool is an intricately designed area chart, meticulously created to serve as a fundamental canvas for the seamless integration of other more granular trading indicators.
blackOrb Price can have synergies with blackOrb Candle as both indicators combined can give a bigger picture for supporting comprehensive and multifaceted data-driven trading analysis.
This indicator isn't intended for standalone trading application. Instead, it offers an alternative approach to traditional area charts, serving as a supplementary tool for orientation within broader trading strategies. Irrespective of market conditions, it can harmonize with a wider range of trading styles and instruments/trading pairs/indices like Stocks, Gold, EURUSDSPX500, GBPUSD, BTCUSD and Oil.
Inspiration and Publishing
Taking genesis from the inspirations amongst others provided by TradingView Pine Script Wizard Kodify, blackOrb Price is a multi-encompassing script meticulously forged from scratch. It aspires to furnish a comprehensive area chart approach, borne out of personal experiences and a strong dedication in supporting the trading community. We eagerly await valuable feedback to refine and further enhance this tool.