[CP]ATR Triple Stop Loss LevelsATR based Triple Stop Loss levels that are plotted on the chart (like moving averages!).
With ATR Levels plotted on the price chart itself, you can better set your volatility based trailing Stop Loss.
Also helps to define the SL when making an entry into a stock.
Note:
This indicator is supposed to be used on Daily and Weekly Charts.
For other timeframes you would need to tweek the default parameters.
Stoploss

Perfect Risk Management Setup !Simple and clean Perfect Risk Management Setup !
5 Targets included with Entry !
2 Stops included !
+ Dir is for long setting Long Sl and Targets
- Dir is for setting Short Sl nd Targets
* Manualy one can set Sl and Targets according to their risk management !
Two Take Profits and Two Stop LossThis script is for research purposes only. I am not a financial advisor.
Entry Condition
This strategy is based on two take profit targets, two stop loss, and scaling out strategy. The entry rule is very simple. Whenever the EMA crossover WMA, the long trade is taken and vice versa.
Take Profit and Stop Loss
The first take profit is set at 20 pips above the long entry and the second take profit is set at 40 pips above the long entry. Meanwhile, the first stop loss is set at 20 pips below the long entry and the second stop loss is set at the long entry.
Money Management
When the first take profit is achieved, half of the position is closed and the first stop loss is moved to the entry-level. The rest of the position is open to achieve either second take profit or second stop loss.
There are three outcomes when using this strategy. Let's say you enter the trade with 200 lot size and you are risking 2% of your equity.
1. The first outcome is when the price hits stop loss, you lose the entire 2%.
2. The second outcome is when the price hits the first take profit and you close half of your position. Meaning that you have gained 1%. Then you let the trade running and eventually it hits the second stop loss. Remember your first stop loss has changed to the second stop loss when the first take profit is achieved. The total loss is 0% because the price is at your entry-level. You have gained the earlier 1% and then lost 0%. At this point, you are at 1% gained.
3. The third outcome is similar to the second out but instead of hitting the second stop loss, the trade is running to your favor and hits the second take profit.
Therefore, you gained 1% from the first take profit and you gained another 2% for the second take profit. Your total gained is 3%
Summary
The reason behind this strategy is to minimize risk. with normal strategy, you only have two outcomes which are either win or loss. With this strategy, you have three outcomes which win 3%, win 1%, or loss 2%.
This is my similar strategy but with single stop loss

Two Take Profit StrategyThis script is for research purposes only. I am not a financial advisor.
Entry Condition
This strategy is based on two take profit targets and scaling out strategy. The entry rule is very simple. Whenever the EMA crossover WMA, the long trade is taken and vice versa.
Take Profit and Stop Loss
The first take profit is set at 20 pips above the long entry and the second take profit is set at 40 pips above the long entry. Meanwhile, the stop loss is set at 20 pips below the long entry.
Money Management
When the first take profit is achieved, half of the position is closed. The rest of the position is open to achieve either second take profit or stop loss.
There are three outcomes when using this strategy. Let's say you enter the trade with 200 lot size and you are risking 2% of your equity.
1. The first outcome is when the price hits stop loss, you lose the entire 2%.
2. The second outcome is when the price hits the first take profit and you close half of your position. Meaning that you have gained 1%. Then you let the trade running and eventually it hits stop loss. The total loss is 0% because the remaining lot size which is 200/2=100 times by 20pips is 1%. You have gained the earlier 1% and then loss 1%. At this point, you are at break even.
3. The third outcome is similar to the second out but instead of hiring stop loss, the trade is running to your favor and hits the second take profit.
Therefore, you gained 1% from the first take profit and you gained another 2% for the second take profit. Your total gained is 3%
Summary
The reason behind this strategy is to minimize risk. with normal strategy, you only have two outcomes which are either win or loss. With this strategy, you have three outcomes which are win, loss or break even.

EMA trend reversal strategy "muxie1" - 1.5x to 3xThis uses 2 EMA and Stop Loss and Take Profit,
The stops don't fire at the precise value but only when the trend reverses
it is actually good for 1D since 2019, it was however optimised for 1min but I am not able to share for 1m.
have equivalent code for quantum zone ftx
Great profit factor from 1.5x to 3x
Mandatory input is the position size per trade, tested with 1 btc for 100k virtual capital, remember to set it small for a low risk per trade, and even smaller if you use leverage,

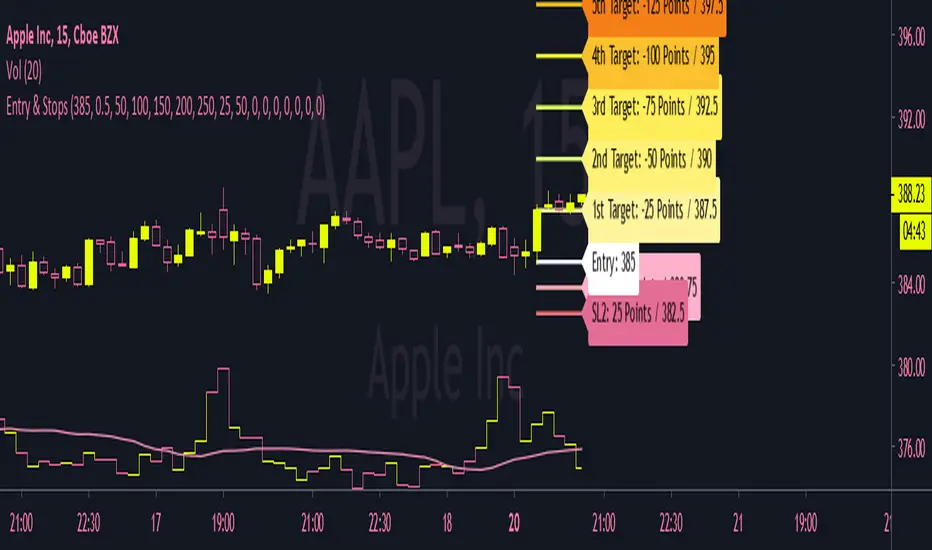
Entrate, take profit e stop loss, target 1
Questo script vuole essere un aiuto nell'impostare le operazioni a mercato giorno per giorno.
A seconda della posizione che si vuole scegliere (long o short) guardando il grafico si può essere aiutati dall'indicatore Entrare.
Le linee trasparenti verdi e arancioni sono entrate:
long: la mia entrata a mercato sarà al prezzo della riga arancione trasparente, il mio stop loss alla riga rossa, il mio tp 1 alla riga bianca superiore e il tp 2 alla riga verde.
short: la mia entrata a mercato sarà al prezzo della riga verde trasparente, il mio stop loss alla riga verde, il mio tp 1 alla riga bianca inferiore e il tp 2 alla riga rossa.
Questa semplice strategia è basata su altri due script di mia creazione che trovate a questi indirizzi:
This script is made for help people with their entry day per dar.
Depending on the position yuo decided (long or short) and whatcing the chart you can be helped by this script "Entrate".
Transparent Green and Orange line are entry points:
long: the entry point will be the transparent orange line, stop loss at red line, tp1 at upper white line and tp 2 at green line.
short: the entry point will be the transparent green line, stop loss at green line, tp1 at lower white line and tp2 at red line.
This simple strategy is based on other 2 script made by me, and you can find at these links:
Buona fortuna e Good Luck!

TradeChartist Plug and Trade™TradeChartist Plug and Trade is an extremely useful indicator that can be connected to almost any Study script (not a Strategy) on Trading View (with an Oscillatory or Non-Oscillatory Signal plot) to generate Trade Signals with Stop Loss plot, user set or automatic Target plots and create Alerts based on Past Performance, determined by Past Gains/Drawdowns for each Trade. The indicator is packed with a lot of features including TradeChartist's signature Dashboard and Real-time Gains Tracker, Automatic Targets Generator, Take Profit recommendation, option to paint price bars based on Trade/Price Trend, 3 types of Stop Loss plots to choose from, with option for user to set fixed Target to take profits.
1. How does ™TradeChartist Plug and Trade connect to another Study script/indicator signal?
Plug and Trade is elegantly designed with simplicity in mind, without compromising on functionality, so any trader - beginner to advanced, can just plug an external signal to the indicator with ease by just following these simple steps.
Add to price chart, the Indicator along with the signal plot to be tested and assessed for performance.
Plug the signal into ™TradeChartist Plug and Trade by choosing it from the Plug Signal Here drop-down.
Choose Signal type as Oscillatory if signal oscillates between set values or crosses a certain value periodically (Example: RSI, CCI, TRIX etc that are mostly not overlayed on Price chart and may be in a separate pane from price chart as it may not fit on Price scale), Choose Signal Type as Non Oscillatory if the signal can be plotted on price scale and Trades are normally generated when price crosses above or below it (Moving Averages, SAR indicators like SuperTrend, etc.).
For oscillators, default Oscillator value for Trade Signals is 0 as most Oscillators have 0 as their mid point. The value can be changed if the Signal doesn't oscillate with 0 as its mid point. For example, if the connected Signal is RSI, the values can be changed to Upper and Lower band values to generate Trade Signals.
Plot the Signal on chart if the signal is Non Oscillatory.
2. How can the plugged Signal's performance be assessed using ™TradeChartist Plug and Trade and subsequently used for generating Trade Entries and to create Alerts?
Once the Signal is plugged into the indicator based on steps above, Plug and Trade automatically plots the Trade entries based on the Signal type.
Plot Trade Entries after Bar Close from settings can be checked for signals that do not confirm until bar close. By doing this, repainting can be avoided for most signals and true performance can be assessed. Also, alerts can be created using Once Per Bar rather than Once Per Bar Close .
The real-time Gains Tracker and Dashboard are useful in tracking gains and other useful indicator values like RSI, Stoch, ATR and EMA in real-time with price movement.
Enabling Past Performance from settings will plot Maximum Gains achieved and Maximum Drawdown for each trade as labels . Trading View only plots finite number of labels and old labels are deleted automatically. But to access past performance beyond the last available label, bar replay can be used.
User can choose from 3 types of Stop Losses from the settings - Fixed %, Trailing % and ATR Stop Loss namely and a Fixed TP % to create plots on price chart and to create alerts.
If the user prefers automatic targets based on Trade entries, Recommend Targets can be enabled from the settings. The automatic targets are generated at the time of Trade Entry, along with Target prices and % which turn green when hit.
Each BUY and SELL Trade are tracked in its entirety and the highest high since BUY and lowest low since SELL are plotted on the price chart and also displayed on the Plug and Play Dashboard
Choppiness can be easily spotted if there are numerous Past Performance labels or several Trade Entries around a short timeframe on chart. This may mean that the signal needs smoothing or may not be suitable for the asset to trade on the chart timeframe. Suitability of a Study script for the asset can be determined in many ways using this indicator.
3. What other features are included in ™TradeChartist Plug and Trade?
Enabling Spot Price Bars to take Profit option from settings automatically plots $ sign above/below candles where Profit taking is recommended or Stop Loss moved to secure profits/reduce loss.
Enabling Paint Price Bars with Trade Trend paints price bars with colors that help picture Trade/Price trend. Trend spotting using this works best with (bars/hollow candles/candles with no border) on dark background.
Both features work on Price chart even without any Signal plugged in.
===================================================================================================================
Example Charts using different Signals plugged into ™TradeChartist Plug and Trade
1. RSI Signal (Oscillatory) plugged in with >60 for BUYs and <40 for SELLs - BTC-USDT on 1hr
2. PowerTracer Signal (Oscillatory) plugged in - GBP-USD 1hr
3. 55 period VWMA Signal (Non Oscillatory) plugged in - ADA-USDT 4hr
4. RSI Signal (Oscillatory) plugged in with >70 for BUYs and <30 for SELLs - SPX 1hr with Trailing SL - 3% and TP - 2%
===================================================================================================================
This is not a free to use indicator. Get in touch with me (PM me directly if you would like trial access to test the indicator)
Premium Scripts - Trial access and Information
Trial access offered on all Premium scripts.
PM me directly to request trial access to the scripts or for more information.
===================================================================================================================

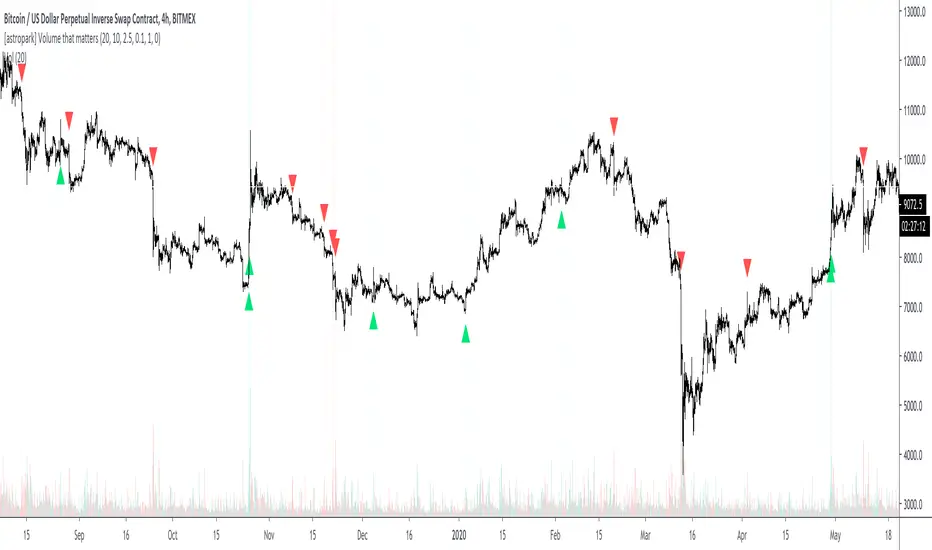
[astropark] Volume that mattersDear Followers,
does volume say something about market makers and what will happen in near future?
Today a new Price Action Tool , the "Volume that matters" indicator.
When a Market Maker executes his/her orders, there is no way he/she can do it without giving us some footprints: volume!
Specific Volume spikes happen as
reactions at support or resistance range , as well as at supply and demand zones
market makers' actions
trend switching in short-term and mid-term future
They can be both bullish or bearish , but the real problem is that not all, but only a few volume candle matters ! And this tool will filter them for you.
This indicator works
on every timeframe (eg. 15m, 30m, 1h, 2h, 4h, 6h, 1D, ...), the higher, the better!
on cryptocurrencies (eg. XBTUSD, ETHUSD, ETHBTC, both USDT and BTC markets, ...)
on forex (eg. EURUSD, GPBUSD, JPYUSD, ...)
on stocks (eg. AMZN, FB, TSLA, GOOG, NFLX, ...)
on commodities (eg. GOLD, SILVER, OIL, ...)
This indicator has following options:
edit volume filter and period analysis
edit filter based on fixed or percentage volatility change
edit filter based on candle value size
show a suggestion of possible entries and stoploss
You can enhance your trading by using it together with my "Engulfing that matters", my "Pinbar that matters" and my "Breaker Blocks (BB) and Supply/Demand Order Blocks (OB)" indicators, so you can easily spot confluences and have more confidence in trades.
Here my Engulfing that matters indicator
Here my Pinbar that matters indicator
Here my Breaker Blocks (BB) and Supply/Demand Order Blocks (OB) indicator
Here below some examples on how to use the indicator.
BTCUSDT 1D
ETHUSD 4h
LINKBTC 1h
EURUSD 4h
AMZN 1h
XAUUSD 4h
Here below an example of suggested entries and stoploss
This is a premium indicator , so send me a private message in order to get access to this script .
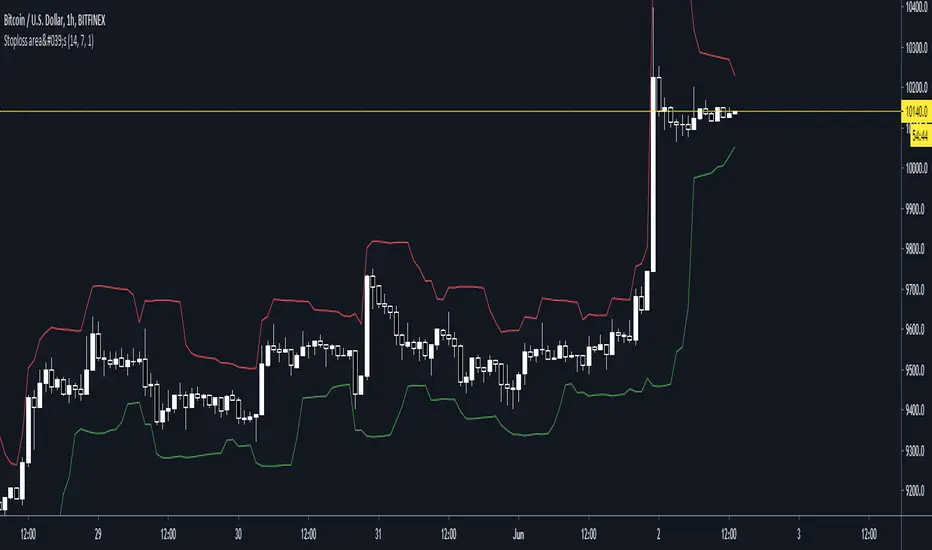
Trailing Stop LossTrailing stop loss indicator to determine when to exit a position.
Multiple trailing stop loss calculation techniques are implemented:
ATR: Determines stop loss using a gap from recent highest value, that gap is defined by the ATR value and a multiplier
MA: Just a simple moving average used as a stop-loss
Percentage: Uses a percentage of the price
The script also implements alerting to be notified when the stop loss price is reached.

Stoploss indicatorGood for setting trailing stops and stoplosses when your taking a scalp etc, most recommended for manual trailing stops
Nikesh Price CycleEvery Script has a pattern and it follows a cyclic movement which results into many small and big swings. We have tried to capture these cyclic pattern. Division line acts here as a pivot point which defines a holistic view of bulls and bear power. Price moving above division line indicates bullish trend and price moving below division line indicates bearish trend. Price scale bar defines trend momentum. when price crosses price scale bar with green scale bar colour it shows we should enter. we will keep on booking our profit on near next fib level. we will exit the trend once price candle crosses linear regression line. for safe entry in case of bulls entry-- price scale bar,linear regression line and mid avg term line should be below price candle. In case of bears entry--price scale bar,linear regression line and mid avg term line should be above price candle.


ATR Stop Loss LONG/SHORT by melihgulerYou can monitor the stop loss level according to ATR in 2 ways (Long/Short).

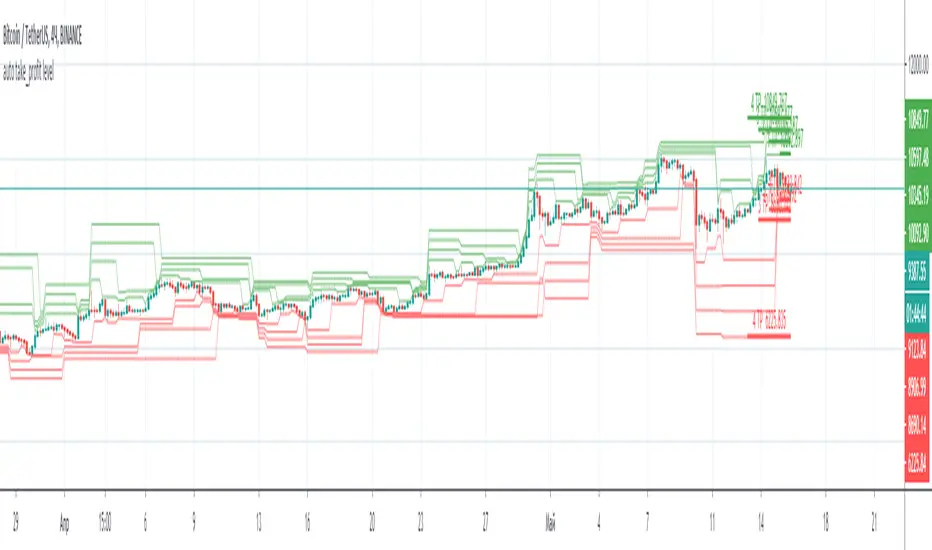
auto take_profit levelAutomatic indicator of take profit levels for any time frame.
It can be used as a visualization of resistance levels, when the lines are located next to each other, the price goes to the side where the levels are located more freely.
If you have an indicator with signals, you can set take profit by levels.
Moving Stop Loss (Most) by ceyhunATR is an indicator that has been removed and replaced with a moving average.Bar colors and infopanel have been added.
//Barcolor
Green = ExMov > Most and close > Most and low > Most
Blue = ExMov > Most and close > Most and low < Most
Red = Most > ExMov and close < Most and high < Most
Yellow = Most > ExMov and close < Most and high > Most
//It gives White color where there is deterioration.
//InfoPanel
Buy Price = Blue draws the circles at the purchase price.
Profit Long>20 = Risk level taken as a percentage, I got the highest 20%, you can determine as you wish.
Sell Price = Red draws the circles at the purchase price.
Profit Short>20 = Risk level taken as a percentage, I got the highest 20%, you can determine as you wish.
==Atr Original Code==
CDC ATR Trailing Stop V2.1 (2013)
==Most Code==
MOST by Anıl ÖZEKŞİ
Barcolor
Barcolor
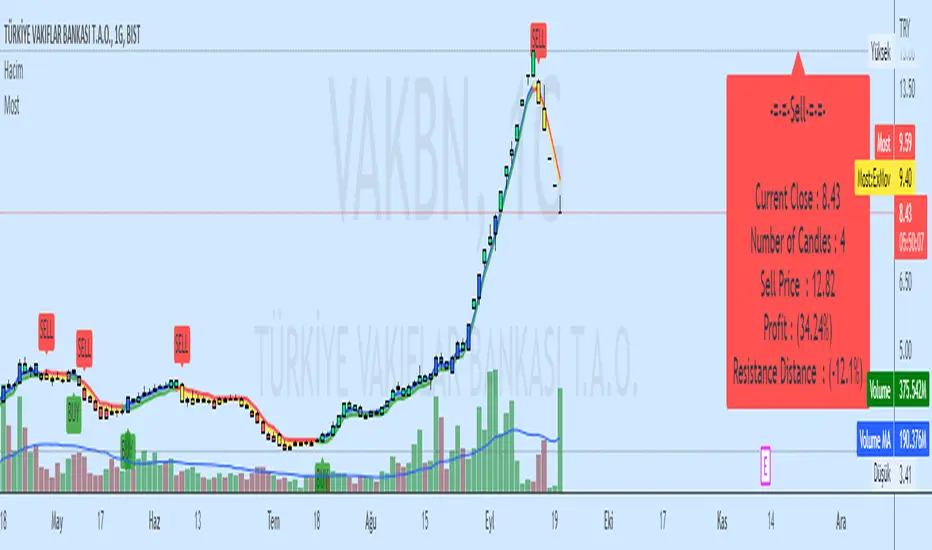
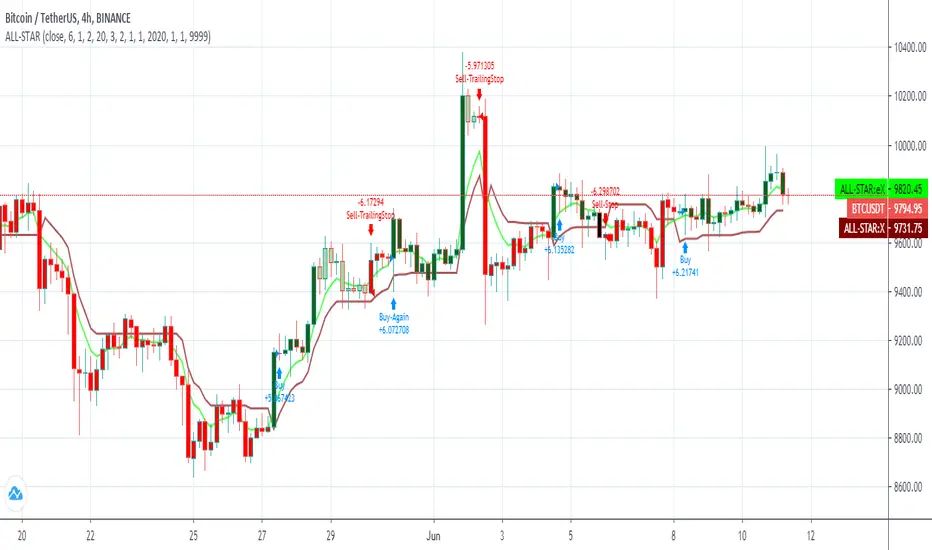
ALL-STAR STRATEGY TP-SL-TSHello!
This strategy combines multiple following stop and take profit strategies. Basically, after purchasing depending on the MOST Strategy, with the values you will determine from the settings section;
stop loss with percentage (settings > Manuel Stop Loss Ratio),
sell and take profit if it is at max profit level (settings > Take Profit Ratio),
activate the trailing stop after it exceeds a certain profit rate, and if it has dropped from this value by a certain rate, sell and take profit (settings > Trailing Stop Start Ratio) > (settings > Trailing Stop Ratio)
you can have your transactions done. In addition, the transaction, which is stopped according to the MOST strategy, also goes into a sell state.
The bars that are in the Sell state, switch to the Buy state, enter the trailing stop area, and are in the state of Buy despite the Most are shown in different colors.
Türkçe
Bu strateji birden fazla takip eden stop ve kar al stratejisini birleştirmektedir. Temelde MOST Stratejisine bağlı olarak alım yaptıktan sonra, ayarlar bölümünden belirleyeceğiniz değerler ile;
yüzde ile zarar durdur (ayarlar> Manuel Stop Loss Ratio),
max kar al seviyesine geldiyse sat ve kar al (ayarlar> Take Profit Ratio),
belirli bir kar oranını geçtikten sonra takip eden stop aktif et ve bu değerden belirli bir oranda düştü ise sat ve kar al (ayarlar> Trailing Stop Start Ratio) > (ayarlar> Trailing Stop Ratio)
işlemlerini yaptırabilirsiniz. Bunların yanında, MOST'a göre stop olan işlem de sat durumuna geçer.
Sat durumunda olan, Al durumuna geçen, Takip eden stop alanına giren, Most'a göre al durumunda olduğu halde kar al işleminden sonraki barlar farklı renklerle gösterilmiştir.
3 Day Trailing Stop RulePeter L. Brandt's 3 Day Trailing Stop Rule
This indicator implements Peter's 3DTSR on daily price movements.
A long exit signal following 3DTSR works as follows:
1. Identify the Highest High Day since the last 3DTSR Long Signal was triggered.
2. A close below the low of that High Hay triggers a Setup Day.
3. Any penetration of the low of the Setup Day triggers the rule - sell to close.
A short exit signal following 3DTSR works as follows:
1. Identify the Lowest Low Day since the 3DTSR was last triggered.
2. A close above the high of that Lowest Low Day triggers a Setup Day.
3. Any penetration of the high of the Setup Day triggers the rule - buy to close.
The signals can be used in reverse to enter positions.
Intraday
This indicator sources data from daily price bars so the integrity of the signals is maintained even when looking at intraday charts.
Settings
The long and short signals can be enabled or disabled in the settings.
The 3DTSR can look very busy on a daily chart so price cutoff point settings are available to hide any instances above or below a price.
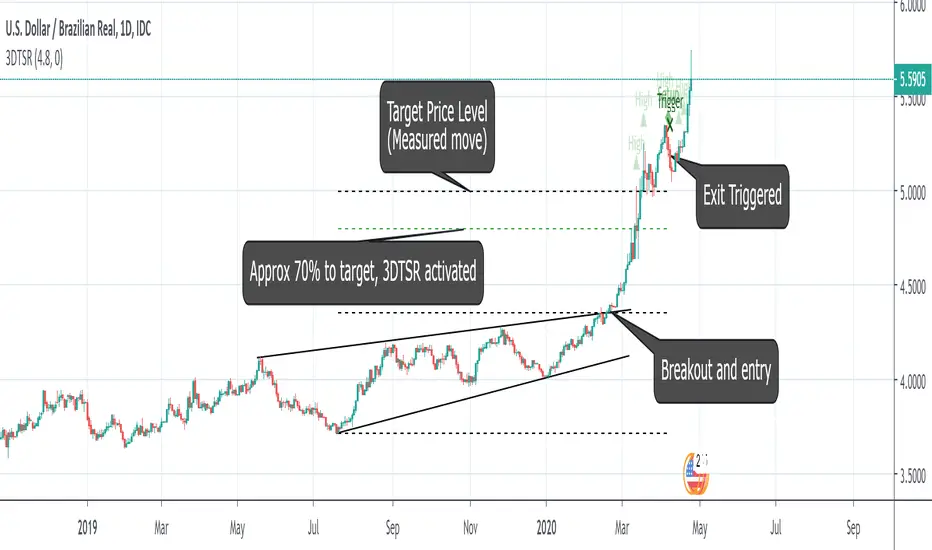
Example
In the example above, a long position is entered in USDBRL after a breakout.
The 3-Day Trailing Stop Rule becomes active when 70% to the price target. The cutoff setting is useful here to make the chart look less busy.
The Setup Day and subsequent Trigger day occur a few days later signaling an exit from the trade.
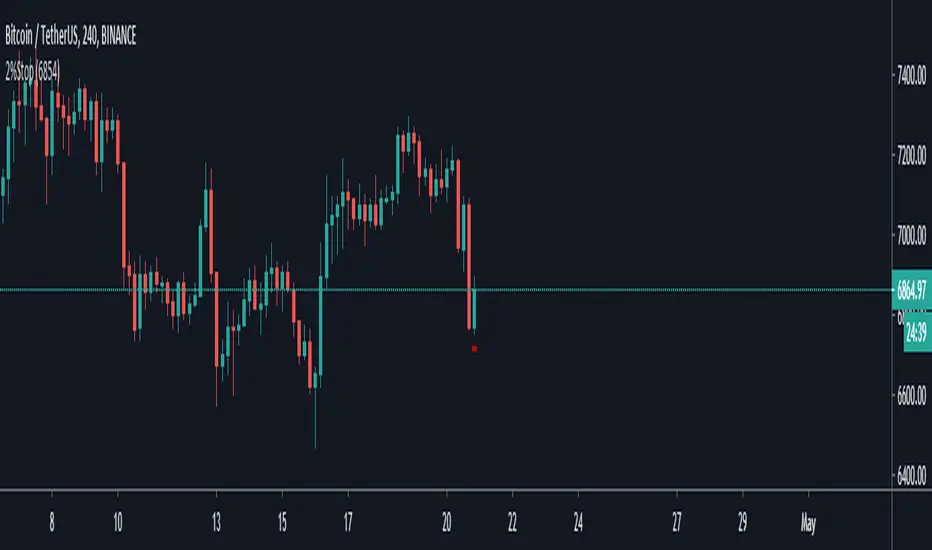
2% StopThis indicator is simply based on the 2% rule, you must insert the entry point (the price at what you bought) by clicking the gear on the top left.
If you see the chart different is becouse the default entry is set to 1 and but it fixes if you set the proper entry price.
a little bit about the 2% rule :
Following the 2% Rule will keep any loss in your account to a rela-
tively small, livable size.
The 2% Rule prohibits you from risking more than 2% of your account
equity on any single trade.
This Rule does
not limit your position size—it only limits your risk.
Of course, if you are planning to hold your position down to zero,
then its maximum size would have to be capped at 2%. On the
other hand, if you do a much more sensible thing and use a stop, your
risk per share will decrease, and your permitted size will increase.
The distance from your entry price to the stop level defines your
maximum dollar risk per coin.
The 2% Rule defines your maximum risk for the entire position.
Knowing the risk per share and the total permitted risk makes it
easy to calculate the maximum number of coins /shares you may trade.
Credit about this idea goes to Dr Elder Alexander.
High/Low stopFirst of all let me quote some important points :
• You need stops; a trade without a stop is a gamble.
• You need to know where you’ll put your stop before you enter
a trade.
• Everybody needs hard stops.
• Whenever you change a stop, you may move it only in the direc-
tion of the trade.
There is a variety of techniques available to traders who like to use
trailing stops:
• You can use a multibar low as a trailing stop; for example, you
can keep moving your stop to the lowest low of the last three
bars (but never against your trade).
• You can trail prices with a very short moving average and use its
level for a trailing stop.
• You can use a Chandelier stop—every time the market makes a
new high, move the stop within a certain distance from the top—
either a specific price range or a number based on an ATR (aver-
age true range). Any time your stock makes a new high, you place
your stop within that distance from the top, like hanging a chan-
delier (this method is described in Come into My Trading Room).
• You can use a Parabolic stop .
• You can use a SafeZone stop .
• You can use a Volatility-Drop stop (described below, for the first
time in trading literature).
• You can use a Time Stop to get out of your trade if it does not
move within a certain time. For example, if you enter a day-trade
and the stock does not move within 10 or 15 minutes, it is clearly
not doing what you expected and it is best to scratch that trade.
If you put on a swing trade which you expect to last several
days, but then a week goes by and the stock is still flat, it is
clearly not confirming your analysis and the safest action would
be to get out.
This is a summary taken from Dr Elder book and this indicator i coded from one of his book where he briefly mention this trailing stop technique but don't dive a lot into it, but still i found to be very effective.
You can use even the short stop (the green dots) as an entry point.

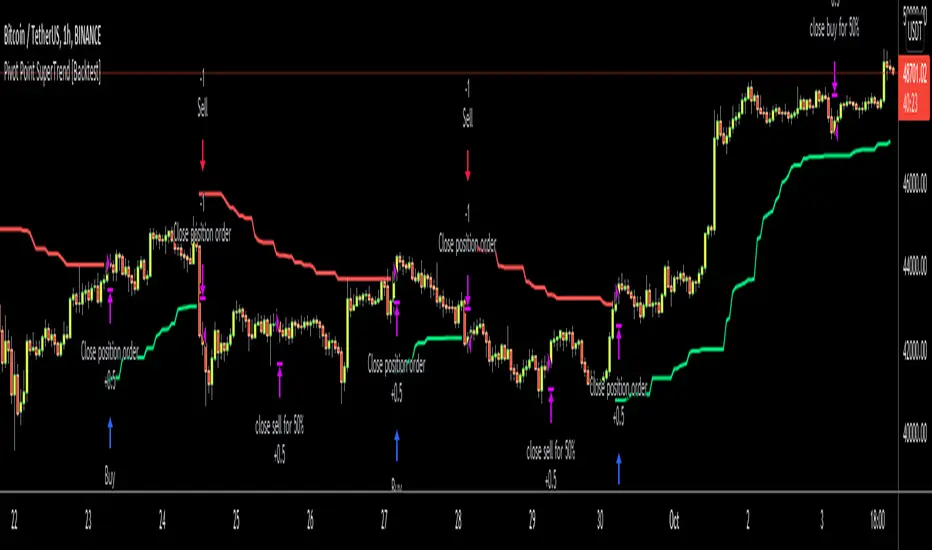
Pivot Point SuperTrend [Backtest]Hello All,
This is backtesting result of following indicator/strategy. I didn't work on adding other indicators. maybe in the future I can try to combine this with other indicators.
You can visit following link to see "Pivot Point SuperTrend" . by using this backtesting tool, you can test&find better options
There is option "Use Center Line to Close Entry for 50%" . by default it's not enabled. if you enable this option, pivot point center line may push you to close your entry for 50% (can be used as early stoploss/take profit line if you think it's risky)
Enjoy!
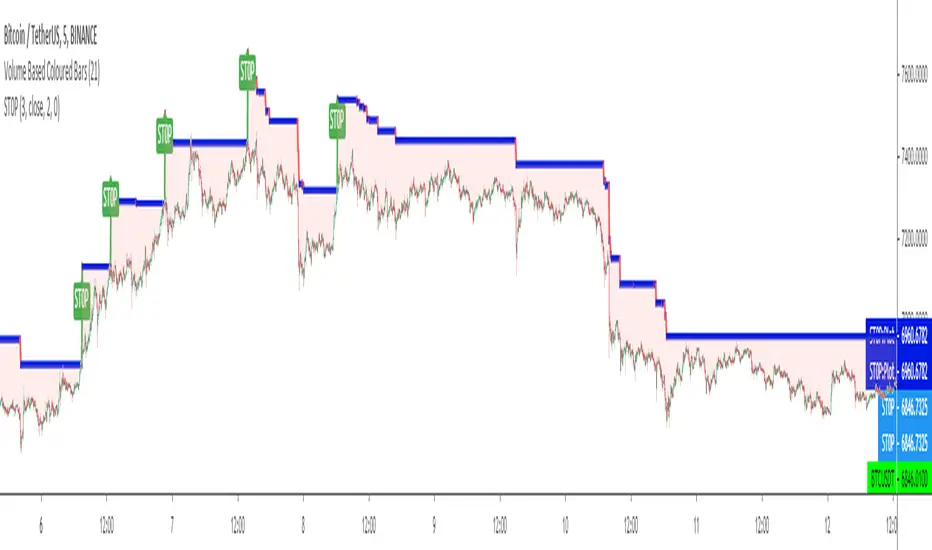
ST0PST0P is a kind of a TRAILING STOP LOSS INDICATOR in which users can set up LONG or SHORT trade versions and also can set up a STOP LOSS level by percent % or unit difference.
It tries to solve the problem of stop loss indicators' default BUY or SELL settings and non adjustable stop levels of % and difference change in price levels.
(Will try to make updates to add user defined start bars.)
Kıvanç Özbilgiç
SECRET EESSecret EES is a Pivot Based indicator that shows Entry Price, Target Price, and Stoploss.
This is not exact Pivot Points or CPR. These ranges are corrected for better accuracy and better results.
The chart is divided into Three Zones - No trade Zone, Long Zone, and Short Zone.
Each line indicates the Entry, Exit, and Stoploss for at least one of the zones.
Works Good in Equity.
It also works on Index Charts.
Recommended time frame 15 mins.
Only for Intraday Trading.
THIS IS NOT REGULAR PIVOT POINTS. PLEASE USE CAREFULLY.

TITAN StrategyTitan Strategy it's a Volatility & price action indicator giving you the exact point of exit or stop or reversal
with 2 different lengths represent as 2-time frames to drive the trend and reversals during the bear market and the bull market
with one adjustable level of taking profit and one adjustable stop loss level.
Grate for swing trading and Bullrun recognition and scalp those short trade into the bear market
and there its 2 more timeframes or lengths for the short environments where titan will scalp short into the average true range
default settings are at 4% stop loss and 4% take profit
How to use :
Buy Signal: long condition
Sell Signal: Short condition
If you like to know how to apply to the service please send me a private msg
we have a full pdf guide that comes with indicator its will be provided to you for mentoring propose
thx for your time and support
