Moving Average profit targets with var sizeProfit target:
Profit targets are those scenarios where the system expects to be greater than the actual return at the end of the transaction: they may be short-term benefits, such as a favorable price shock model.
In short-term transactions, profit objectives are essential. Price fluctuations make any favorable event likely to turn around in an instant. Moreover, profit objectives are more difficult to integrate into the longer-term trading system, because they are afraid of losing larger profits at risk, so they will replace them with smaller but more frequent gains. As a follower of the trend, once you make a profit and stop earning, but the trend direction is still intact, you need to find a way to re-enter the transaction to avoid losing the rare but very large market situation.
Profit target is best calculated based on price volatility (V), and the most commonly used method:
For Long, the system buy point (E), needs to be multiplied by the average true volatility or annualized volatility :E+f×V.
The net value multiplier f used to calculate the profit level is usually obtained through data mining.
Stoploss

GMS: Mean Reversion StrategyThis is based on my GMS: Mean Reversion Indicator ()
Features:
- % Based Profit Target and Stop Loss
- SMA Trend Filter
- Can choose trade exit based off a moving average or linear regression curve
- Filter for long only trades, short only trades, or both at the same time.
Source code is open, so feel free to take a look!
I hope it helps,
Andre

RSI and Smoothed RSI Bull Div Strategy [BigBitsIO]This strategy focuses on finding a low RSI value, then targeting a low Smoothed RSI value while the price is below the low RSI in the lookback period to trigger a buy signal.
Features Take Profit, Stop Loss, and Plot Target inputs. As well as many inputs to manage how the RSI and Smoothed RSI are configured within the strategy.
Explanation of all the inputs
Take Profit %: % change in price from position entry where strategy takes profit
Stop Loss %: % change in price from position entry where strategy stops losses
RSI Lookback Period: # of candles used to calculate RSI
Buy Below Lowest Low In RSI Divergence Lookback Target %: % change in price from lowest RSI candle in divergence lookback if set
Source of Buy Below Target Price: Source of price (close, open, high, low, etc..) used to calculated buy below %
Smoothed RSI Lookback Period: # of candles used to calculate RSI
RSI Currently Below: Value the current RSI must be below to trigger a buy
RSI Divergence Lookback Period: # of candles used to lookback for lowest RSI in the divergence lookback period
RSI Lowest In Divergence Lookback Currently Below: Require the lowest RSI in the divergence lookback to be below this value
RSI Sell Above: If take profit or stop loss is not hit, the position will sell when RSI rises above this value
Minimum SRSI Downtrend Length: Require that the downtrend length of the SRSI be this value or higher to trigger a buy
Smoothed RSI Currently Below: Value the current SRSI must be below to trigger a buy

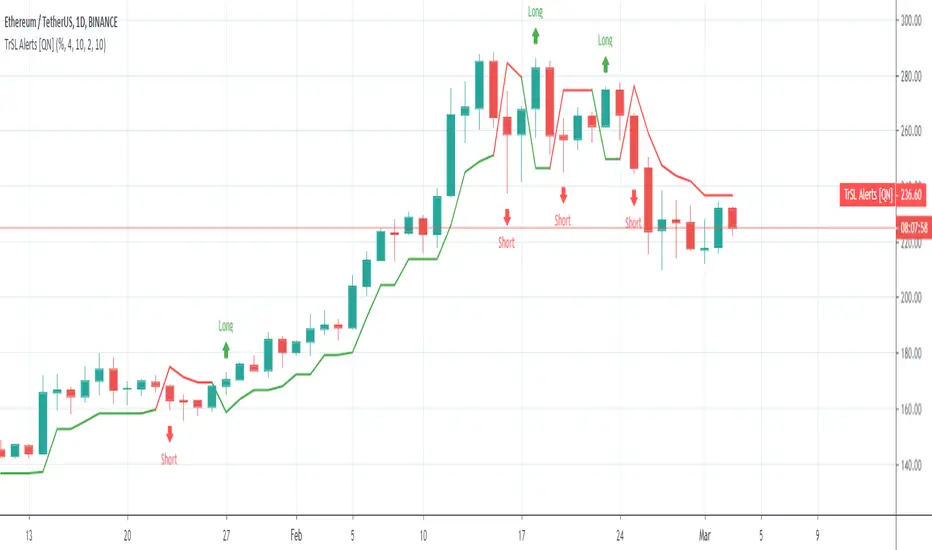
Trailing SL Alerts [QuantNomad]It's alerts version of my Trailing SL strategy:
Use "Once Per Bar" param when creating alerts.
Profit and Stoploss CalculatorThis script is designed to display three stop loss areas to assist either with automation of risk management or identify and alert when price is in a range of a trade for risk to reward ratio.
In this version there are three stop losses and 1 PT. Mainly because i will most likely only be using 1 of the SL to pair with the PT.
Stoploss areas are displayed on both sides of the price for long and short calculations along with the two profit factors but the settings in the indicator it self apply to both sides in terms of percentage.

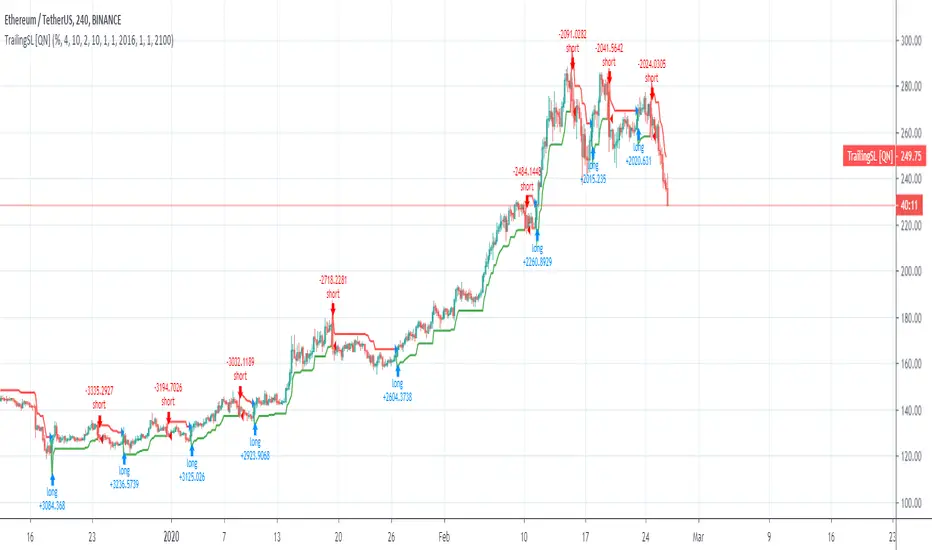
Trailing SL Strategy [QuantNomad]I'm a big fan of simple strategies.
This one is a very simple one. So it consists only from one Trailing SL. When SL is hit, the position is reversed and SL is tracked for a new position.
You can choose one of 3 types of SL:
% of your price
ATR - it is calculated as current ATR * multiplier
Absolute
As you can see even this simple strategy can show pretty good results.
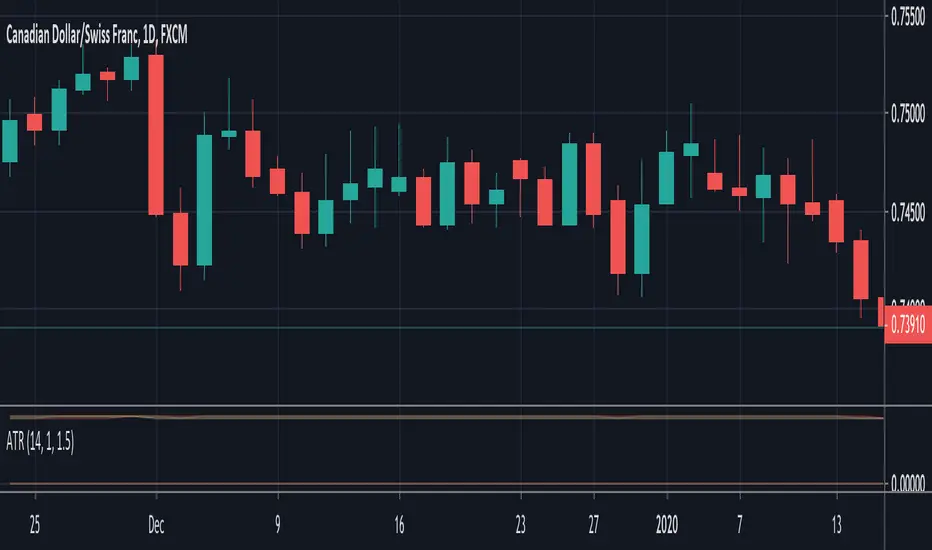
ATR based Stop and Take-Profit levels in realtime Little tool to quickly identify stops and take-profit levels based on Average True Range. User can change ATR multipiers, as well as the ATR length used. Green and red lines show these levels; plot is visible over last 8 bars only to reduce clutter. Label showing the current ATR, up above the last bar

ATR SL/TP Calculator
Hello traders!
With this script you will able to calculate easier SL and TP using the ATR Value according with your strategy.
Script plots two circles below and above the candle that is calculated using H/L of the candle +/- ATR Value.
You can also modify the ATR Period and other plotting options clicking on the settings icon.
Ciao Traders, in questi ultimi giorni non ho pubblicato analisi ma spero che gradirete questo script che vi faciliterà di molto il lavoro quando applicherete strategie basate sull'ATR per il calcolo degli stop o dei profit.
Grazie a questo script riuscirete a calcolare più facilmente lo SL ed il TP utilizzando il valore dell'ATR applicato al Massimo o al Minimo di quella candela.
Lo script visualizzerà due cerchi, uno sopra e uno sotto la candela che rappresentano il Massimo/Minimo più/meno il valore dell'ATR.
Potrete modificare il periodo dell'ATR e lo stile semplicemente cliccando sull'icona delle Impostazioni.

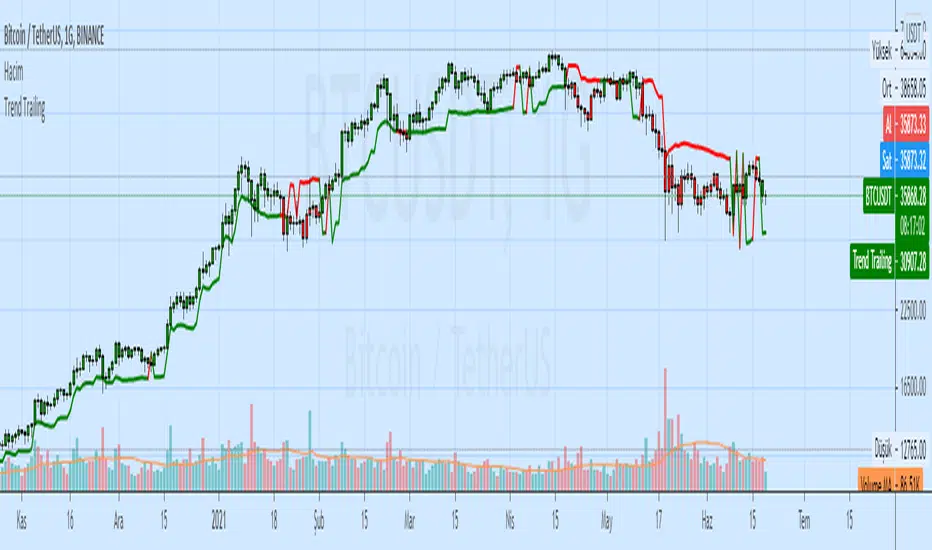
Trend TrailingAndrew Abraham
It can be used as:
- stop loss indicator
- indicator of support and resistance
- buy and sell signals
ATR x TP & SLSimple script based on ATR to calculate your Take Profit and Stop Loss
Input variables:
ATR Period ( Default: 14 )
TP Multiplier ( Default: 1*ATR )
SL Multiplier ( Default: 1.5*ATR )
SFL ATR BandsMany traders use ATR as a way to determine stop loss placement. It usually works like this:
- Stop loss for a short trade = high of last candle + ATR value
- Stop loss for a long trade = low of last candle – ATR value
This is an indicator that allows you to do just that: it gives you an easy way to view current and historical volatility using ATR-based price bands .
Features
The indicator is configurable with the following settings:
ATR period
ATR multiplier
ATR applied to highs/lows OR the close price
Bands offset
Only show for the last X candles
How To Use This Indicator
Since this indicator shows average volatility bands, it is a good measure of how much the price moves. So we can use ATR bands in a number of ways:
it’s an easy way to see where you can place your stop loss
you can use a multiple of ATR as your trade target
you can trail your stops alongside the ATR bands

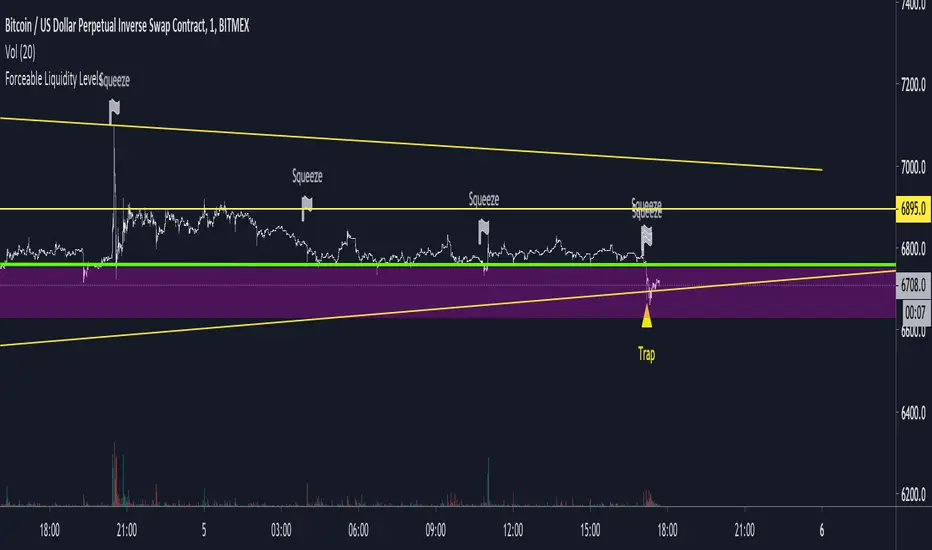
Untapped Forceable LiquidityUses likely stop placements and liquidation points to visualize where there may be forceable buy or sell orders on the chart.
Good for catching wicks for entries or to see whether the bulls or the bears are in control. For example, a wick down into a liquidity point and a close back above it may be seen as bullish as the sell pressure was overwhelmed by the bulls.
Anyways, I like to use it for game theorizing for trend analysis.
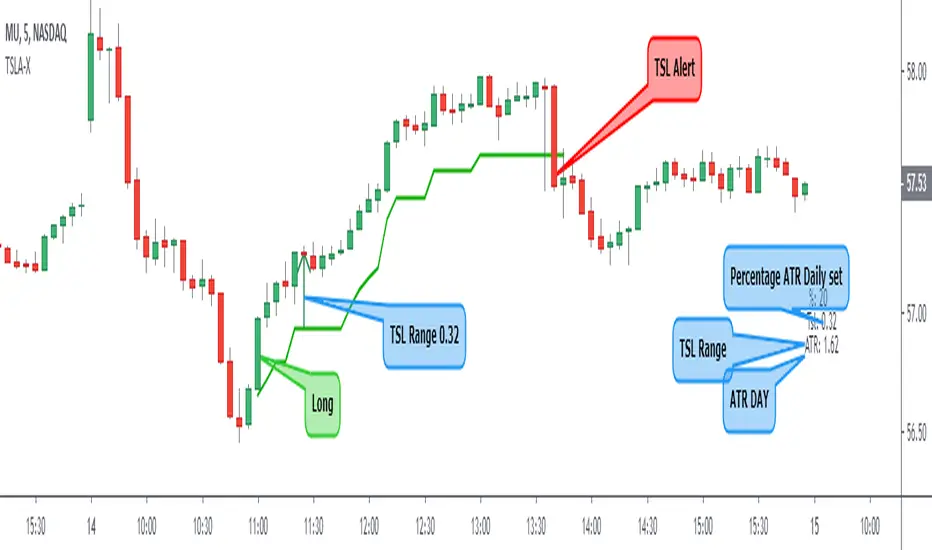
Trailing Stop Loss ATR + AlertI share this TSL indicator with alert (I use it only for Stocks), the configuration is very simple, you must select if it is a Short or Long operation, time at which the operation was opened,% of the daily ATR for TSL. It also contains:
- Alert
- Panel Info
Ori Double-Sided Trailing Stoploss SystemGenerally trailing stoplosses are one sided. Trailing uptrend or downtrend. Also there are continuous trailing indicators that uses same settings for both uptrend and downtrend. It is good for improving the original approach to complete the system but not enough. Seperating values for uptrend and downtrend opening much more possibilities. It is better for sticking to trend and also better for showing your bias towards one side with different stoplevels. There are different options to build the system. You can calculate the stoploss from a moving average. Aka reference ma. Also calculating stoploss method can differ. You can use percentage, atr, standart deviation and ori. Ori is calculating highest and lowest level in a period and dividing it to the period. Others are classic. There is options for their settings. Also there is gap between uptrend stoploss and downtrend stoploss at switch areas, there is an option to decrease this gap in settings. Also you can use reference ma for switching between trends but it is also being used in calculating stoploss level so you may want a different switch mechanism. Aka seperate signal line. Other options are for visual settings such as candle colors. There is an indicator that i wrote "Ori Double-Sided MOST". That one is using reference ma also for signal line. There is no gap reducing and using percentage for calculating. It is easier to use but with less option. You can also improve that indicator in this indicator with more indicators.

W5T Roller CoasterOur new Roller Coaster indicator is perfect for trading Stocks, Futures, Forex, Commodities, & Cryptocurrencies.
The Roller Coaster is a Stochastic/MACD Cross with Special EMA Points of Control for both Long and Short trades.
Our algorithm works everything out behind the scenes, keeping your chart clean.
With the purchase of our indicator, you will have access to:
Entry Price
Stop Loss Price
Trade Management
Trailing Stop Positions
Get in early on a Trend, or Trade Long & Short as an instrument moves with a range
Check out our signature to learn more!

Calculator (weighted) - evoA tool to calculate the average price and position size.
The "Risk Amount" input means the amount of dollars you lose if the trade gets stopped out (it should be based on a small percentage of your account).
TIPS
- If you use the weights to calculate an average price, make sure it adds up to 100% in total or you will get a weird number.
- Keep an eye on the risk amount if you take a trade, if I ever update the script it might set back to default which will change your position size.
- I tested it all but you might trade in a different way than me, so do your own calculation for every new thing you try with it.
If you find any bug please tell me so that no one ends up with a weird calculation or position size.

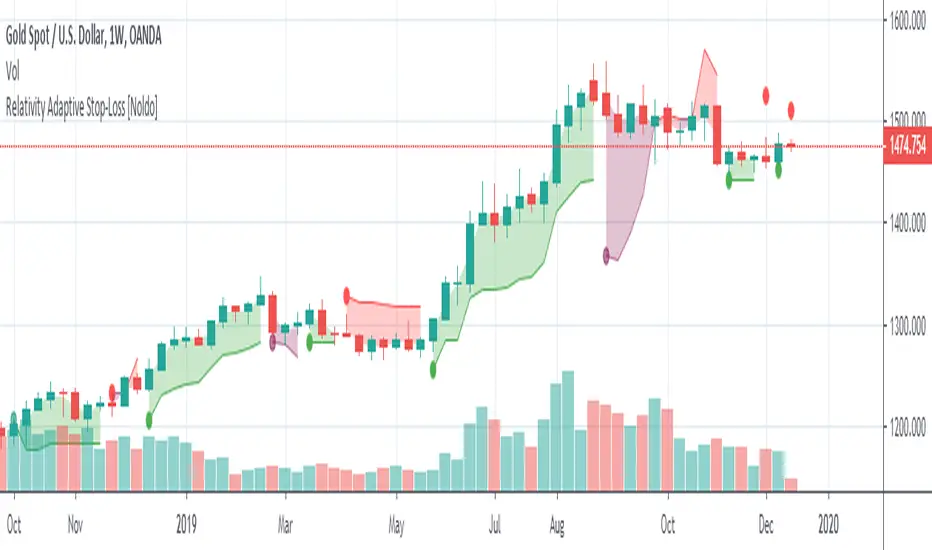
Relativity Adaptive Stop-LossRelativity Adaptive Stop-Loss is a stop-loss technique that uses the Relativity Autonomous Distribution Blocks algorithm.
For detailed info about Relativity Autonomous Distribution Blocks :
*** Features
This structure is different from standard stop-losses.
The base frame is based on "Market Adaptive Stop-Loss" script.
For detailed information about Market Adaptive Stop-Loss:
This script uses the Relativity Autonomous Distribution Blocks as cross method.
Tradeable / Non Tradeable Region Detector :
This script separates tradeable and non-tradeable regions with a coloring method.
Plotting Rules :
* Maroon : Uncorfirmed Short Positions
* Teal : Unconfirmed Long Positions
* Green : Confirmed Long Positions
* Red : Confirmed Short Positions
This script can be used in only 1W time frame. (TF = 1W )
Does not repaint on 1W and larger time frames. ( Source = close )
*** Settings :
The only option here is the ATR multiplier.
The default use value of this ATR multiplier, which is of the standard of stop-loss, is 2.You can set it from the menu.
No alert is set.
Because the positive and negative regions are the same as Relativity Autonomous Distribution Blocks.
Since the traders can trade according to the support and resistance outside the definite regions, the unnecessary signal was confused and the alerts were removed.
*** USAGE
The Stop-Loss indicator can slide on the chart.
So you have to make sure you put it in right place.
Using this script in a new pane below will radically solve slip problems.
Stop-Loss values do not slip definitely.The values can select from the alignment.
NOTE :
Some structures (Market Adaptive Stop-Loss) and design in this script are inspired by everget's Chandelier Exit script :
Best regards.
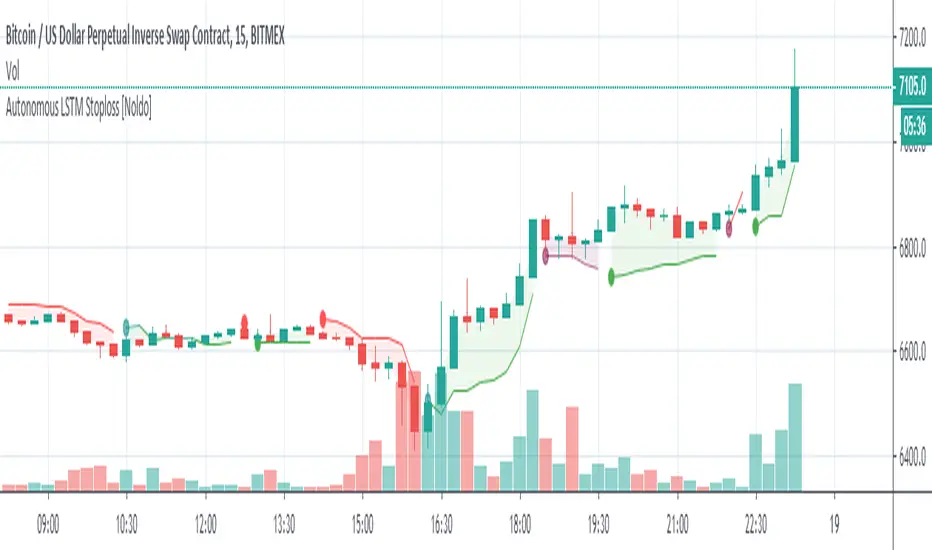
Autonomous LSTM Stop-LossStructure
Autonomous LSTM Stop-Loss is a stop-loss technique that uses the Autonomous LSTM algorithm.
For detailed info about Autonomous LSTM :
*** Features
This structure is different from standard stop-losses.
The base frame is based on "Market Adaptive Stop-Loss" script.
For detailed information about Market Adaptive Stop-Loss:
This script uses the Autonomous LSTM as cross method.
Tradeable / Non Tradeable Region Detector :
This script separates tradeable and non-tradeable regions with a coloring method.
Plotting Rules :
* Maroon : Uncorfirmed Short Positions
* Teal : Unconfirmed Long Positions
* Green : Confirmed Long Positions
* Red : Confirmed Short Positions
This script can be used in all time frames.
Does not repaint. ( Source = close )
*** Settings :
The only option here is the ATR multiplier.
The default use value of this ATR multiplier, which is of the standard of stop-loss, is 2.You can set it from the menu.
No alert is set.
Because the positive and negative regions are the same as Autonomous LSTM.
Since the traders can trade according to the support and resistance outside the definite regions, the unnecessary signal was confused and the alerts were removed.
*** Usage
The Stop-Loss indicator can slide on the chart.
So you have to make sure you put it in place.
Since this is a region scan from the OHLC levels, indicator contains small blue dots to the ohlc levels and made it serve as a guide.
However, since we cannot know the OHLC values precisely, it is best to use them as follows:
Because it is often forgotten to put it in place:
(OHLC : Average of Open, High, Low, and Closing prices for each period)
Using this script in a new pane below will radically solve slip problems.
Stop-Loss values do not slip definitely.The values are selected from the alignment.
NOTE :
Some structures (Market Adaptive Stop-Loss) and design in this script are inspired by everget's Chandelier Exit script :
Best regards.
[fikira] Harmonic Patterns (Gartley)When using "Harmonic Patterns", always look at the bigger picture, please do not depend solely on the "Pattern".
Use other indicators,... to confirm what you think is going on!
That said, it is quite useful!
Here we have "The Gartley", bullish and bearish.
The "Pattern" is created by checking 5 consecutive (pivot) points, starting with X, A, B, C, and ending with point D.
At point D all 5 points are compared, calculated and verified.
When confirmed, a "Label" will be plotted at point D, together with the "Entry", "Take Profit" and "Stop Loss" price.
The "Entry", "Take Profit" and "Stop Loss" lines will be plotted as well at point D.
Lastly, a "Drawing" automatically will be displayed which makes the "Pattern" visible.
Please do mind, the "Drawing" is calculated differently, the "Drawing" sometimes can be displayed incorrectly
when prices are too close to each other (for example low Satoshi price changes).
THE "ENTRY" , "TAKE PROFIT", "STOP LOSS" PRICES AND LINES ARE NOT AFFECTED AT ALL BY THIS, THEY WILL SHOW CORRECTLY!
- 1 "TP point" can be changed ("TP Level 0.618")
- "Labels", "Lines", "Drawings" can be disabled/enabled
- "Labels" can be made smaller or bigger ("Size Label")
- "Labels" can be placed further or closer to the bar ("Distance TP Label" > higher = closer, lower = further)
- "Lines" can be made thicker or thinner ("TP Linewidth")
- "Drawings" can be made thicker or thinner ("Drawings Linewidth")
- "Drawings" are created by comparing with 100 bars back in history (default), should it be (very rarely) a triangle is displayed flat on the left side,
possibly the first point(s) is/are further than 100 bars ago, in this case increase "Period Drawings" above 100.
- When a lot (really a lot!) of "Patterns" appear on the chart, the first ones will not be displayed anymore, first the "Drawings", then the "Lines"
The last (present) ones will always be displayed in total without a problem!
- If you want to see "Patterns" with less correct measurement, change "Error Marge" 0.9 - 1" and "Error Marge" 1 - 1.1"), this gives max. about 10% extra margin
Thank you very much!

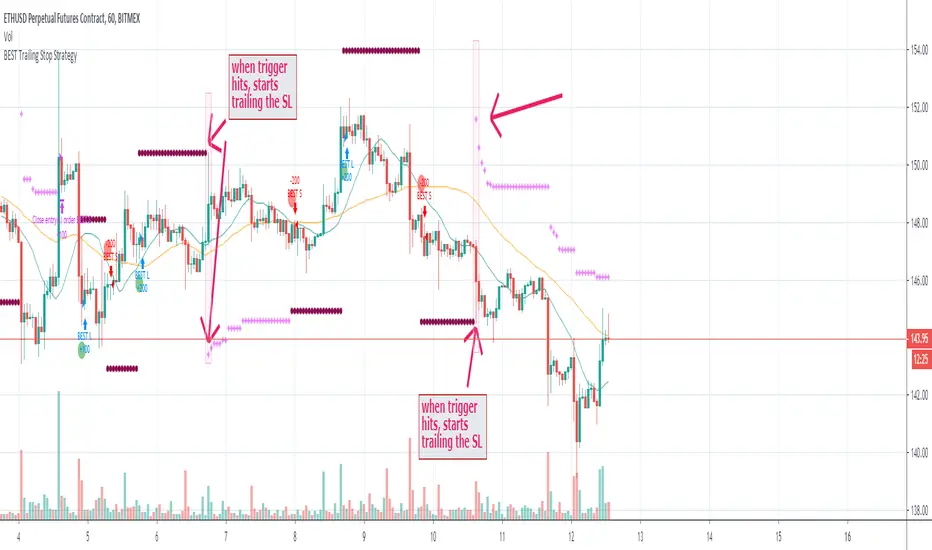
BEST Trailing Stop StrategyHello traders
Here we go again.... with the second strategy snippet.
Reminder: the first snipper was a Trailing Profit strategy script
What's on the menu?
A trailing stop is designed to protect gains by enabling a trade to remain open and continue to profit as long as the price is moving in the investor's favor.
The order closes the trade if the price changes direction by a specified percentage or dollar amount.
Trigger me I'm famous
I developed many trading strategies in my career and often I've been asked to trigger a trailing-stop once a certain % move has been made.
On the screenshot below, the SL trigger is plotted in maroon.
Once the price goes past that level for the first time, I'll start trailing the trailing stop level.
In other words, when we see a price makes an interesting move in percentage value - we decide to trail the stop for at least not losing any more
All the BEST
Dave
Maximum True RamgePlots the the highest true range for the entire dataset.
Beneficial for determine an emergency stopp loss.

Guppy CBLThis is the Count Back Line script from the book Guppy Trading by Daryl Guppy.
It is usually used as a stop loss line, but can also be used to find entries.
Hope someone finds it usefull, if you find anything that is wrong with it, please let me know and I will try to fix it.
This is my first PineScript, hope it is working as intended.

Juicy SAR and RSI StrategyThis strategy uses the SAR indicator to determin trend, and a stochastic rsi to give entrypoints. You can costomize both of these indicators in the script. The also show stop losses. we have also coded in alerts. This indicator works best on wavy markeds.
