I'd like to learn more about Pine Profiler
What is the Pine Profiler, and how do I use it?
The Pine Profiler is a powerful utility that analyzes the executions of all significant code lines and blocks in a Pine script and displays helpful performance information next to each line inside the Pine Editor. By inspecting the Profiler's results, programmers can gain a clearer perspective on a script's overall runtime, the distribution of runtime across its significant code regions, and the critical portions that may need extra attention and optimization.
To profile a script with Pine Profiler, follow these steps:
- Open the source code of the script in your Pine Editor. If this script is read-only, make a copy of it.
- Add the script to the chart.
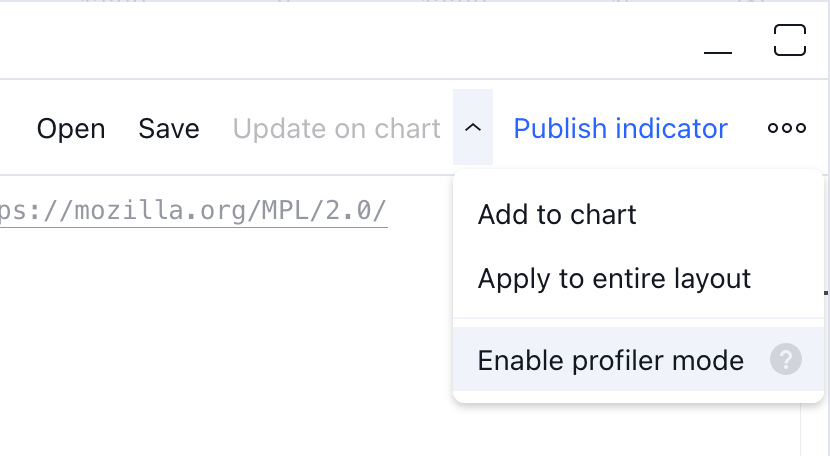
- Click on the now active "Enable profiler mode" button in the dropdown next to the "Add to chart/Update on chart" option in the top-right corner:
Once enabled, the Profiler collects information from all executions of the script's significant code regions and displays approximate runtime percentages to the left of the code lines inside the Pine Editor.
Hovering over the left margin next to the lines in the Pine Editor will highlight an analyzed code region and reveal a small window with additional performance information, including the line numbers of the analyzed code, the time spent on that code compared to the script's total runtime, and the code's total number of executions:

The fields the window will show depend on the analyzed code. If the profiled code is a single line, it will display three fields: "Line number", "Time", and "Executions". The results shown for the line at the start of a loop or conditional structure will show a "Code block range" field instead of "Line number", and it will include an additional "Line time" field.
Note: The Pine Profiler wraps each significant line and code block with the extra calculations required to track and display performance results. Consequently, the sum of the percentages shown for all lines in the script will not sum up to 100%, and the sum of all the profiled regions' time results will be less than the script's total runtime.
When a script contains at least four significant lines of code, the Profiler will include "flame" icons to the left of the top three code regions with the highest impact on runtime performance. If a high-impact code is outside the lines visible inside the Pine Editor, a "flame" icon and a number will appear at the top or bottom of the left margin. Clicking that icon will vertically scroll the Editor's view to show the nearest high-impact line:
To learn more about the Profiler's features, how to interpret its results, and some tips on optimizing Pine Script™ code, see the Profiling and optimization page in our Pine Script™ User Manual.