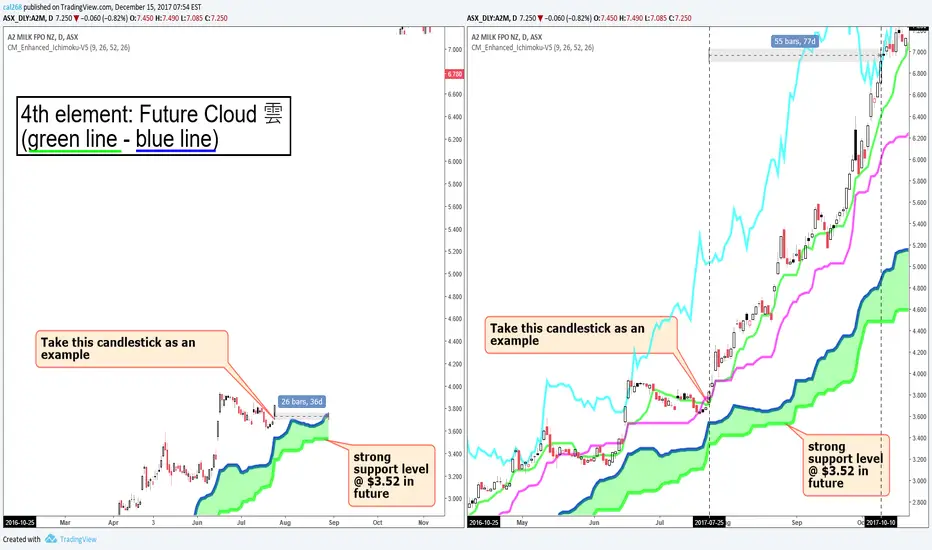
Future cloud is shifted forward 26 periods
I hide the right part of the price actions on the left chart to show you the future cloud ends 26 days periods forward. Please note that some brokers' Ichimoku indicator doesn't include this function.
By adding the 1st, 2nd & 3rd elements into the right chart, we have a complete Ichimoku chart.
As you see the Tenkan-sen & Kijun-sen overlap nearly 5 days after 2017-07-25. Tenkan-sen finally takes off. Also, the chinkou span is above price.
These are the evidences to show A2M is trending upward BULLISH.
Until 2017-10-10, chinkou span stuck in the price.
By using this strategy, A2M rose from $3.8 to $6.9 in 55 bars
Bài đăng liên quan
Thông báo miễn trừ trách nhiệm
Thông tin và ấn phẩm không có nghĩa là và không cấu thành, tài chính, đầu tư, kinh doanh, hoặc các loại lời khuyên hoặc khuyến nghị khác được cung cấp hoặc xác nhận bởi TradingView. Đọc thêm trong Điều khoản sử dụng.
Thông báo miễn trừ trách nhiệm
Thông tin và ấn phẩm không có nghĩa là và không cấu thành, tài chính, đầu tư, kinh doanh, hoặc các loại lời khuyên hoặc khuyến nghị khác được cung cấp hoặc xác nhận bởi TradingView. Đọc thêm trong Điều khoản sử dụng.