Apple has arrived at a rare point where Natural Law and fundamentals speak in unison.
The geometry of its long-term cycle and the internal condition of its business now deliver the same message: the arc that carried Apple through its 2020–2025 ascent has reached its structural boundary.
This is the moment where the cycle turns — the moment the Apple begins to fall.
1. Geometry: The 1×2 Monthly Angle Has Been Hit
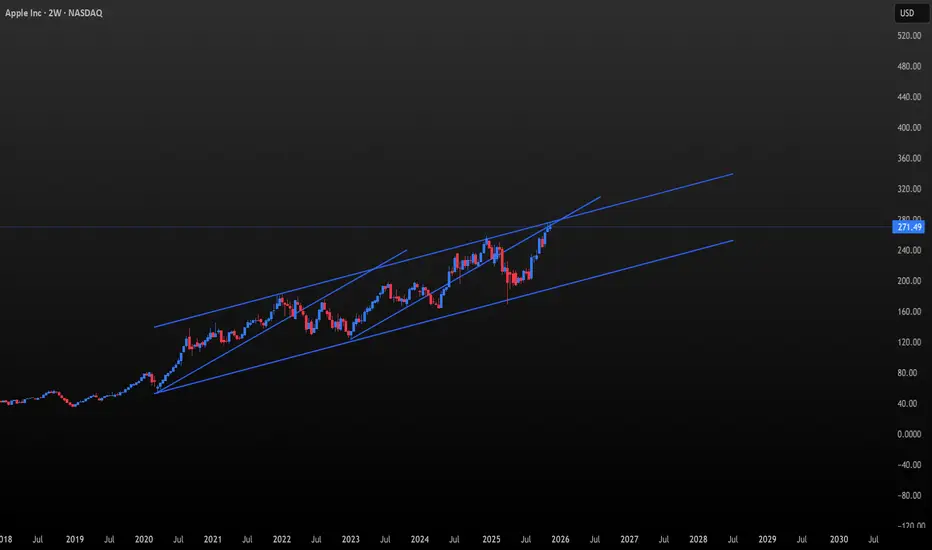
Apple has been riding a clean, disciplined 1×2 monthly trend since the March 23, 2020 low.
Price has now risen to the top rail of that 1×2 channel, the same line that capped major moves in the past.
2. The Weekly Angle (2023-2025) Has Also Hit Its Own Ceiling
A faster internal angle begins from the January 3, 2023 low.
This weekly angle represents Apple’s internal rhythm — the speed of its secondary cycle.
Apple is now touching both:
the top of the long-term monthly angle, and
the top of the short-term accelerated weekly angle
at the same time.
These two angles intersect the first week of 2026,
Please see Monthly Version of chart Below:

A. Speed & Acceleration — The Internal Engine Stalls
The internal motion beneath Apple’s advance is no longer confirming the new highs.
Speed has weakened into the rally, forming a clear lower high even as price presses into the top of the 1×2 monthly angle.
This is the signature of a late-cycle move — higher prices carried by diminishing force.
Acceleration reveals the same condition.
It peaked earlier in the cycle and is now fading, unable to match the strength of prior expansions.
When acceleration rolls over while Speed is already declining, the trend has lost its ability to compound momentum.
Together, Speed and Acceleration show a market moving upward while its engine slows beneath it.
This is the exhaustion phase: motion compresses, angles converge, and the structure prepares to turn.
Please see Daily Chart

B. Daily Motion — The Fast Angle Breaks
On the daily chart, the internal structure has already failed.
The steep 1×1 angle — where each trading day rises one dollar — has broken decisively.
This is the fastest rhythm Apple can sustain, and losing it confirms a short-term top.
Speed follows the same message.
It has slipped beneath the median line, signaling that the drive powering this advance has weakened even as price tests multi-year resistance.
Acceleration is the most urgent tell.
It is sharply negative at the highs, a signature that momentum has collapsed beneath the surface.
Acceleration always turns first; price only acknowledges it later.
Together, the break of the 1×1 angle, the median failure in Speed, and the deeply negative Acceleration show a market losing force as it presses into long-term resistance.
The short-term engine has stalled at the exact moment the monthly cycle reaches its ceiling.
Please see Timing Chart:

Apple’s major swings have not been random.
The timing chart shows a consistent rhythm: the dominant changes in trend occur in January and December, forming a repeating cadence across the 2020–2025 cycle.
January 2022 — Major top
January 2023 — Major low
December 2024 — Major Top
Dec [2025]/Jan [2026] — **Forecasted Top
This creates a temporal cycle where Apple’s trend turns at the opening and closing of the Gregorian calendar — a natural point where momentum resets and the prior cycle completes.
Fundamentals Now Confirm What Geometry Already Shows
Price is not just rising into resistance —
it is rising into resistance while the fundamentals weaken.
a. Revenue Growth Has Stalled
Apple’s total revenue has been flat to slightly negative for nearly two years.
iPhone sales are no longer growing
Services growth has slowed
Mac and iPad units are in multi-year decline
This is the key disconnect:
**Price is making new highs
The business is not.
b. Valuation Has Doubled While Growth Has Halved
Apple now trades at:
31–34× forward earnings
Versus a historical long-term range of 16–20×
Apple is being valued like a high-growth AI company,
even though its earnings are stagnating.
This kind of valuation expansion always shows up as price hugging the upper rail of the long arc.
c. No Real AI Cycle (Yet)
Apple is pricing in an AI future it has not yet earned:
No major AI product cycle
No cloud AI leadership
No LLM ecosystem
No new growth vector
The chart reflects pure thematic flow, not fundamental acceleration.
With new leadership at the helm of Apple and a replacement from TIm cook is found. the stock may go though an adjustment period as well, as Apple tries to re fidn its identify again
d. Buybacks Are Manufacturing the Slope
Apple has spent $600+ billion on buybacks.
That is what creates the smooth, steady 1×2 slope —
but when buybacks meet revenue stagnation, price eventually reaches a point where geometry = fundamental limit.
We are exactly at that point.
e. Leadership Transition — A Coming Shift
Apple is approaching a leadership transition.
Tim Cook’s successor has not yet been named, but the change is forthcoming — and with it comes an inevitable period of adjustment.
As Apple prepares for a new era of leadership, the company will need to reaffirm its identity and strategic direction.
Markets tend to price this uncertainty early, especially when it coincides with the completion of a major structural cycle.
A shift at the top reinforces the broader message of the chart:
Apple is entering a phase of transition — in leadership, in momentum, and in market cycle.
5. When Natural Law and Fundamentals Agree, the Move Is Significant
Price is not hitting resistance in isolation.
It is hitting resistance with weakening internals:
Slowing revenue
Stretched valuation
Compressed consumer demand
No new product cycle
Buybacks masking the slowdown
Leadership Transition
SUMMARY
Apple has reached a structural and fundamental limit.
The long-term 1×2 monthly angle is touched.
The 2023 weekly angle converges at the same point.
$270 natural resistance is met precisely as time and price square.
Internally, revenue growth has stalled, valuation has stretched beyond its cycle, consumer demand continues to soften, and new leadership at the helm of Apple.
In short, Apple stands at the threshold of the 2026 Bear Cycle.

Nana Hermes —
All Things Move by Measure.
The geometry of its long-term cycle and the internal condition of its business now deliver the same message: the arc that carried Apple through its 2020–2025 ascent has reached its structural boundary.
This is the moment where the cycle turns — the moment the Apple begins to fall.
1. Geometry: The 1×2 Monthly Angle Has Been Hit
Apple has been riding a clean, disciplined 1×2 monthly trend since the March 23, 2020 low.
Price has now risen to the top rail of that 1×2 channel, the same line that capped major moves in the past.
2. The Weekly Angle (2023-2025) Has Also Hit Its Own Ceiling
A faster internal angle begins from the January 3, 2023 low.
This weekly angle represents Apple’s internal rhythm — the speed of its secondary cycle.
Apple is now touching both:
the top of the long-term monthly angle, and
the top of the short-term accelerated weekly angle
at the same time.
These two angles intersect the first week of 2026,
Please see Monthly Version of chart Below:
A. Speed & Acceleration — The Internal Engine Stalls
The internal motion beneath Apple’s advance is no longer confirming the new highs.
Speed has weakened into the rally, forming a clear lower high even as price presses into the top of the 1×2 monthly angle.
This is the signature of a late-cycle move — higher prices carried by diminishing force.
Acceleration reveals the same condition.
It peaked earlier in the cycle and is now fading, unable to match the strength of prior expansions.
When acceleration rolls over while Speed is already declining, the trend has lost its ability to compound momentum.
Together, Speed and Acceleration show a market moving upward while its engine slows beneath it.
This is the exhaustion phase: motion compresses, angles converge, and the structure prepares to turn.
Please see Daily Chart
B. Daily Motion — The Fast Angle Breaks
On the daily chart, the internal structure has already failed.
The steep 1×1 angle — where each trading day rises one dollar — has broken decisively.
This is the fastest rhythm Apple can sustain, and losing it confirms a short-term top.
Speed follows the same message.
It has slipped beneath the median line, signaling that the drive powering this advance has weakened even as price tests multi-year resistance.
Acceleration is the most urgent tell.
It is sharply negative at the highs, a signature that momentum has collapsed beneath the surface.
Acceleration always turns first; price only acknowledges it later.
Together, the break of the 1×1 angle, the median failure in Speed, and the deeply negative Acceleration show a market losing force as it presses into long-term resistance.
The short-term engine has stalled at the exact moment the monthly cycle reaches its ceiling.
Please see Timing Chart:
Apple’s major swings have not been random.
The timing chart shows a consistent rhythm: the dominant changes in trend occur in January and December, forming a repeating cadence across the 2020–2025 cycle.
January 2022 — Major top
January 2023 — Major low
December 2024 — Major Top
Dec [2025]/Jan [2026] — **Forecasted Top
This creates a temporal cycle where Apple’s trend turns at the opening and closing of the Gregorian calendar — a natural point where momentum resets and the prior cycle completes.
Fundamentals Now Confirm What Geometry Already Shows
Price is not just rising into resistance —
it is rising into resistance while the fundamentals weaken.
a. Revenue Growth Has Stalled
Apple’s total revenue has been flat to slightly negative for nearly two years.
iPhone sales are no longer growing
Services growth has slowed
Mac and iPad units are in multi-year decline
This is the key disconnect:
**Price is making new highs
The business is not.
b. Valuation Has Doubled While Growth Has Halved
Apple now trades at:
31–34× forward earnings
Versus a historical long-term range of 16–20×
Apple is being valued like a high-growth AI company,
even though its earnings are stagnating.
This kind of valuation expansion always shows up as price hugging the upper rail of the long arc.
c. No Real AI Cycle (Yet)
Apple is pricing in an AI future it has not yet earned:
No major AI product cycle
No cloud AI leadership
No LLM ecosystem
No new growth vector
The chart reflects pure thematic flow, not fundamental acceleration.
With new leadership at the helm of Apple and a replacement from TIm cook is found. the stock may go though an adjustment period as well, as Apple tries to re fidn its identify again
d. Buybacks Are Manufacturing the Slope
Apple has spent $600+ billion on buybacks.
That is what creates the smooth, steady 1×2 slope —
but when buybacks meet revenue stagnation, price eventually reaches a point where geometry = fundamental limit.
We are exactly at that point.
e. Leadership Transition — A Coming Shift
Apple is approaching a leadership transition.
Tim Cook’s successor has not yet been named, but the change is forthcoming — and with it comes an inevitable period of adjustment.
As Apple prepares for a new era of leadership, the company will need to reaffirm its identity and strategic direction.
Markets tend to price this uncertainty early, especially when it coincides with the completion of a major structural cycle.
A shift at the top reinforces the broader message of the chart:
Apple is entering a phase of transition — in leadership, in momentum, and in market cycle.
5. When Natural Law and Fundamentals Agree, the Move Is Significant
Price is not hitting resistance in isolation.
It is hitting resistance with weakening internals:
Slowing revenue
Stretched valuation
Compressed consumer demand
No new product cycle
Buybacks masking the slowdown
Leadership Transition
SUMMARY
Apple has reached a structural and fundamental limit.
The long-term 1×2 monthly angle is touched.
The 2023 weekly angle converges at the same point.
$270 natural resistance is met precisely as time and price square.
Internally, revenue growth has stalled, valuation has stretched beyond its cycle, consumer demand continues to soften, and new leadership at the helm of Apple.
In short, Apple stands at the threshold of the 2026 Bear Cycle.
Nana Hermes —
All Things Move by Measure.
Thông báo miễn trừ trách nhiệm
Thông tin và các ấn phẩm này không nhằm mục đích, và không cấu thành, lời khuyên hoặc khuyến nghị về tài chính, đầu tư, giao dịch hay các loại khác do TradingView cung cấp hoặc xác nhận. Đọc thêm tại Điều khoản Sử dụng.
Thông báo miễn trừ trách nhiệm
Thông tin và các ấn phẩm này không nhằm mục đích, và không cấu thành, lời khuyên hoặc khuyến nghị về tài chính, đầu tư, giao dịch hay các loại khác do TradingView cung cấp hoặc xác nhận. Đọc thêm tại Điều khoản Sử dụng.