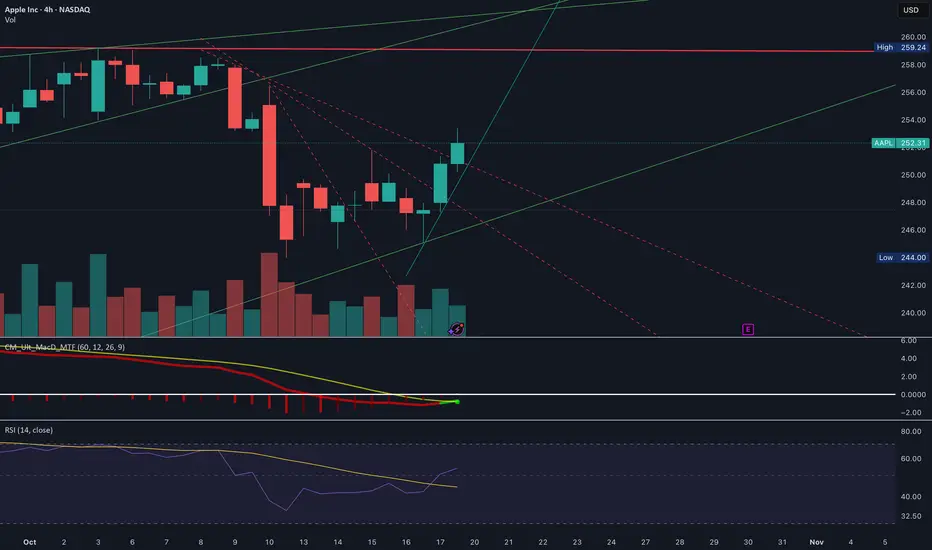
On the 4-hour chart, Apple began a noticeable downward trend around October 8. That trend appears to have shifted around October 16, when the stock hit a low of $245. Since then, it has rebounded to approximately $252.
The strength of this bounce suggests the possibility of continued upward momentum in the short term, potentially lasting through the week leading up to earnings on October 30. Traders may want to watch for support near $245–$248 and resistance near $255–$257, which could indicate the next potential price moves.
The strength of this bounce suggests the possibility of continued upward momentum in the short term, potentially lasting through the week leading up to earnings on October 30. Traders may want to watch for support near $245–$248 and resistance near $255–$257, which could indicate the next potential price moves.
Thông báo miễn trừ trách nhiệm
Thông tin và các ấn phẩm này không nhằm mục đích, và không cấu thành, lời khuyên hoặc khuyến nghị về tài chính, đầu tư, giao dịch hay các loại khác do TradingView cung cấp hoặc xác nhận. Đọc thêm tại Điều khoản Sử dụng.
Thông báo miễn trừ trách nhiệm
Thông tin và các ấn phẩm này không nhằm mục đích, và không cấu thành, lời khuyên hoặc khuyến nghị về tài chính, đầu tư, giao dịch hay các loại khác do TradingView cung cấp hoặc xác nhận. Đọc thêm tại Điều khoản Sử dụng.