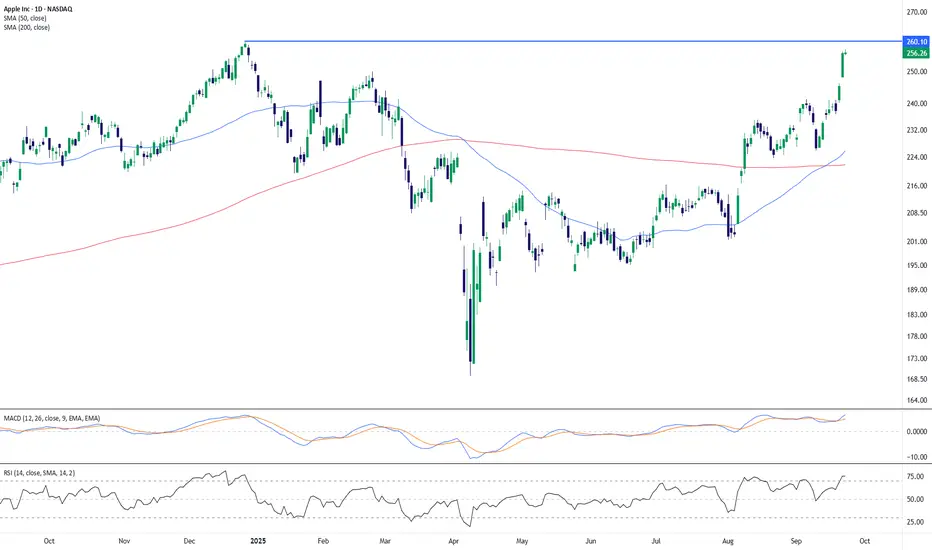
Apple’s share price has staged a sharp rebound in recent weeks, climbing above both the 50-day (225.78) and 200-day SMA (221.80). The sustained move higher has carried price into the 256–260 zone, where it is now testing a major horizontal resistance level established earlier this year.
Momentum indicators reflect the strength of the rally but also highlight stretched conditions. The RSI sits at 75, signaling overbought territory, while the MACD remains firmly above its signal line, showing ongoing bullish momentum. These readings suggest strong buying pressure, though the risk of a pause or pullback near resistance should not be overlooked.
A confirmed breakout above 260 would mark a significant technical shift, potentially resuming the broader uptrend, while failure to clear this level could see consolidation or a retracement back toward the short-term moving averages.
-MW
Thông báo miễn trừ trách nhiệm
Thông tin và ấn phẩm không có nghĩa là và không cấu thành, tài chính, đầu tư, kinh doanh, hoặc các loại lời khuyên hoặc khuyến nghị khác được cung cấp hoặc xác nhận bởi TradingView. Đọc thêm trong Điều khoản sử dụng.
Thông báo miễn trừ trách nhiệm
Thông tin và ấn phẩm không có nghĩa là và không cấu thành, tài chính, đầu tư, kinh doanh, hoặc các loại lời khuyên hoặc khuyến nghị khác được cung cấp hoặc xác nhận bởi TradingView. Đọc thêm trong Điều khoản sử dụng.