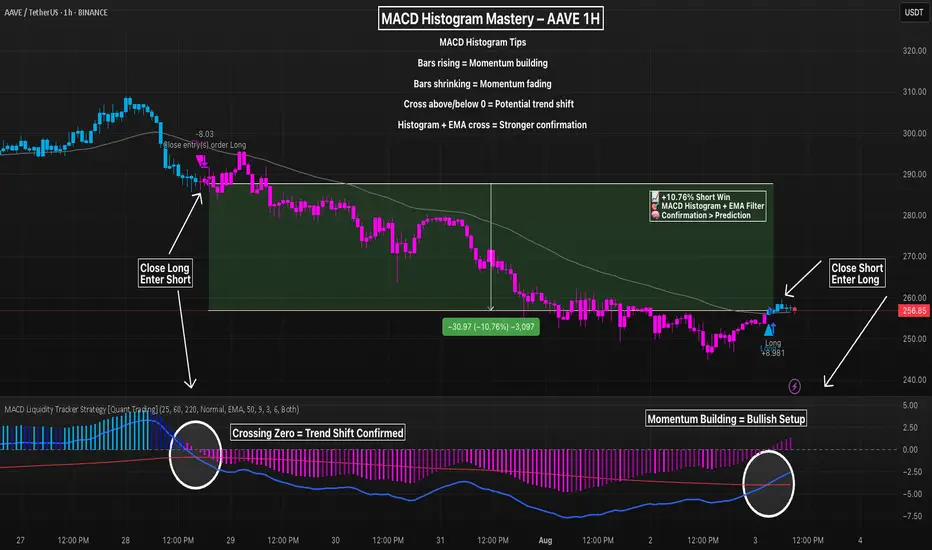
The MACD histogram isn’t just noise — it’s a leading signal for momentum shifts when interpreted correctly. On this AAVE 1H chart, a textbook transition plays out:
– Rising histogram fades → crosses below 0
– EMA filter confirms trend shift
– Strategy flips short at the peak, locks in a +10.76% move
The recent long trigger occurs only after the histogram begins rising, crosses above zero, and price breaks back above the 50/9/3 EMA filter.
💡 Histogram Tips:
– Rising bars = bullish momentum building
– Shrinking bars = momentum weakening
– Crossing the zero line = potential trend reversal
– Best results come when histogram + EMAs align
⚙️ Settings Used:
MACD: 25 / 60 / 220
EMA Filter: 50 / 9 / 3
Entry Mode: Both (Histogram + Crossover Confluence)
📈 Use histogram transitions as an early signal — but always confirm with trend filters to avoid fakeouts.
Explore 5,000 Strategies at quanttradingpro.com
Search for the most profitable, lowest risk by symbol!
Search by indicators like Supertrend, Ichimoku, macd.
Join our discord discord.gg/2systG9frc
We provide education & tools.
Search for the most profitable, lowest risk by symbol!
Search by indicators like Supertrend, Ichimoku, macd.
Join our discord discord.gg/2systG9frc
We provide education & tools.
Thông báo miễn trừ trách nhiệm
Thông tin và các ấn phẩm này không nhằm mục đích, và không cấu thành, lời khuyên hoặc khuyến nghị về tài chính, đầu tư, giao dịch hay các loại khác do TradingView cung cấp hoặc xác nhận. Đọc thêm tại Điều khoản Sử dụng.