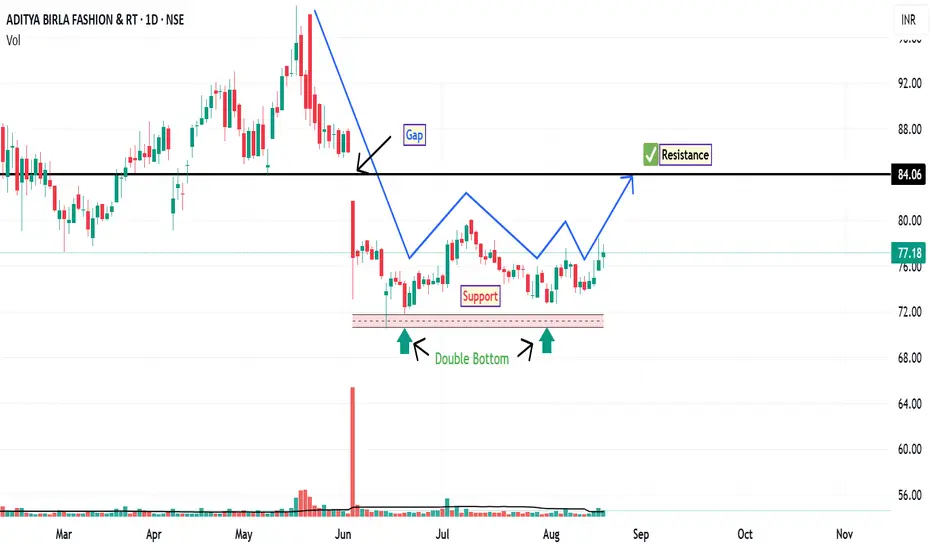
Following a gap-down opening on June 4, ABFRL entered a consolidation phase, trading within a well-defined supply and demand zone. This range-bound movement suggests a period of accumulation or indecision among market participants. During this consolidation, the stock has formed a double bottom pattern on the daily chart—a classical reversal structure that often indicates a potential shift from a downtrend to an uptrend, provided confirmation follows.
An inverted hammer appeared near the second bottom, signaling potential buying interest at lower levels. This was followed by a bullish pin bar, reinforcing the possibility of a short-term reversal. These candlestick formations, especially when occurring near support zones, can be interpreted as early signs of bullish momentum returning—though follow-through price action is essential.
If bullish momentum sustains than the stock may attempt to fill the gap left from the June 4 session. The gap resistance level is around ₹84, which could act as a near-term target for traders monitoring this setup.
Disclaimer: This analysis is for educational and informational purposes only. It does not constitute investment advice or a recommendation to buy, sell, or hold any security. Always conduct your own research or consult a licensed financial advisor before making investment decisions.
Đóng lệnh: đạt mục tiêu
Resistance reached. Trade closed. I will update the new idea once stock show bounce back signal.Thông báo miễn trừ trách nhiệm
Thông tin và ấn phẩm không có nghĩa là và không cấu thành, tài chính, đầu tư, kinh doanh, hoặc các loại lời khuyên hoặc khuyến nghị khác được cung cấp hoặc xác nhận bởi TradingView. Đọc thêm trong Điều khoản sử dụng.
Thông báo miễn trừ trách nhiệm
Thông tin và ấn phẩm không có nghĩa là và không cấu thành, tài chính, đầu tư, kinh doanh, hoặc các loại lời khuyên hoặc khuyến nghị khác được cung cấp hoặc xác nhận bởi TradingView. Đọc thêm trong Điều khoản sử dụng.