Key Intraday Support & Resistance Levels (1-Day Timeframe)
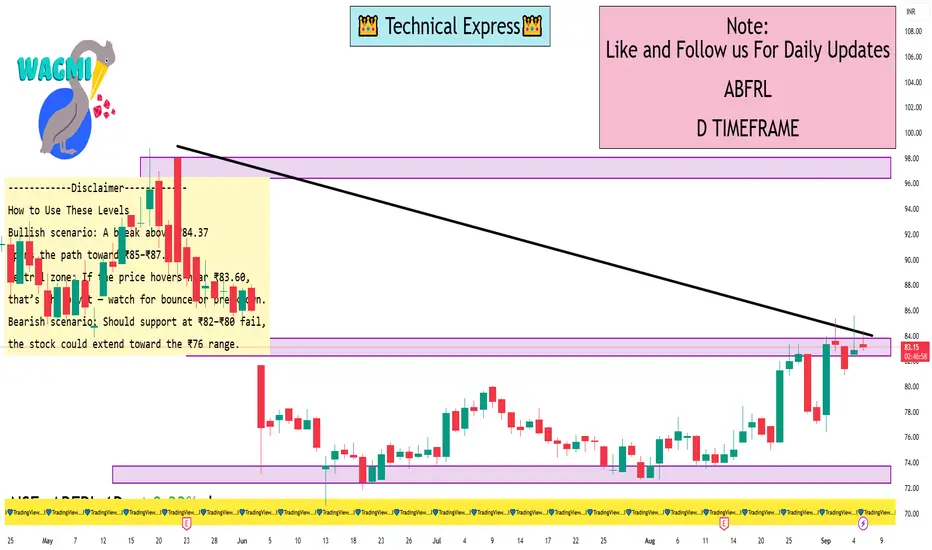
Here’s a breakdown of the technical levels for ABFRL on a daily (1-day) timeframe:
Pivot Points & Fibonacci Levels (TopStockResearch as of Sept 5, 2025)
Standard daily pivots:
Support: S1 = ₹83.59, S2 = ₹81.59, S3 = ₹80.29, S4 = ₹78.29
Pivot: ₹84.89
Resistance: R1 = ₹86.89, R2 = ₹88.19
Camarilla pivots confirming nearby support/resistance zone
MunafaSutra Intraday Levels
One source reports:
Resistance: ₹78.09
Short-term support/resistance: ₹80.24 / ₹76.48
Another indicates:
Resistance: ₹77.42
Support/resistance: ₹78.26 / ₹75.82
These shorter-term numbers appear based on earlier data and may have shifted slightly. The pivot-based levels from TopStockResearch are likely more up-to-date and relevant for today’s intraday outlook.
Fibonacci Retracement Levels (from recent uptrends)
Retracement (support) zones from trend beginnings (e.g., June 13–Sept 4):
Near support areas: ₹79.85, ₹78.07, ₹76.30, ₹74.10
Projection (resistance) levels: ₹86.43, ₹88.63, ₹90.40, ₹92.18, ₹94.38
Gap Resistance & Candlestick Patterns
A gap resistance zone exists around ₹84, which may act as a near-term target if bullish momentum continues. Recent candlestick activity (inverted hammer, bullish pin bar) hints at potential short-term reversal strength
I built a Buy & Sell Signal Indicator with 85% accuracy.
📈 Get access via DM or
WhatsApp: wa.link/d997q0
Contact - +91 76782 40962
| Email: techncialexpress@gmail.com
| Script Coder | Trader | Investor | From India
📈 Get access via DM or
WhatsApp: wa.link/d997q0
Contact - +91 76782 40962
| Email: techncialexpress@gmail.com
| Script Coder | Trader | Investor | From India
Bài đăng liên quan
Thông báo miễn trừ trách nhiệm
Thông tin và các ấn phẩm này không nhằm mục đích, và không cấu thành, lời khuyên hoặc khuyến nghị về tài chính, đầu tư, giao dịch hay các loại khác do TradingView cung cấp hoặc xác nhận. Đọc thêm tại Điều khoản Sử dụng.