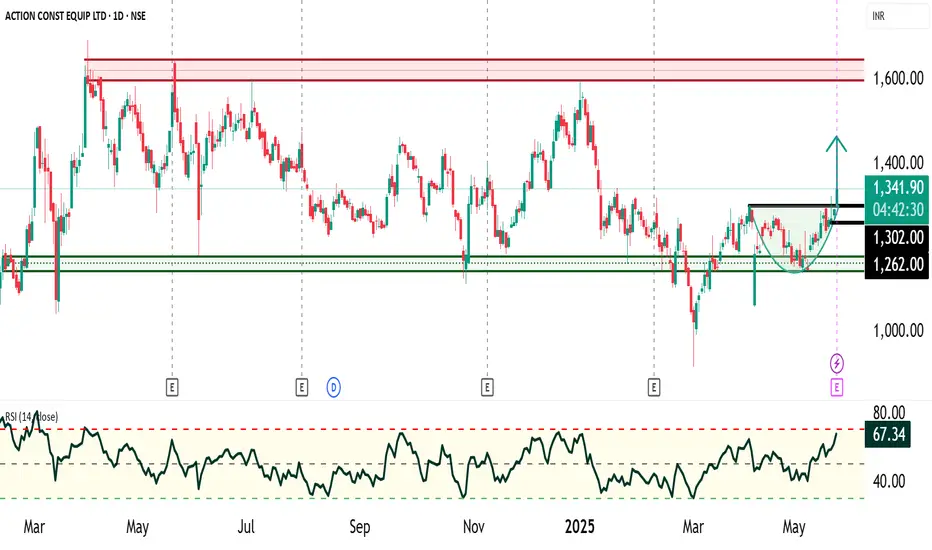
ACE Construction Ltd has been consolidating in a broad sideways range between ₹1,150 to ₹1,600 since February 2024. The price action has clearly defined support and resistance levels, with ₹1,150–₹1,200 acting as a strong accumulation zone and ₹1,550–₹1,600 serving as a firm resistance, where selling pressure consistently emerges.
Technical Pattern Observed (Hourly Timeframe): A Rounding Bottom pattern has been identified on the hourly chart, which is a bullish reversal pattern, indicating a shift from bearish to bullish sentiment.
Neckline Breakout Level: ₹1,300 (confirmed)
Breakout Confirmation: Price closed above neckline with volume support
Target Estimation (Measurement Rule):
Stop Loss: ₹1,260 (last swing high before breakout, risk-managed level)
Momentum & Trend Indicators:
Fundamental Context: ACE Construction Ltd remains **fundamentally strong** with robust financials and growth visibility. The current price level provides an **attractive valuation**, further supporting the bullish technical setup.
Conclusion: The current technical setup presents a high-probability bullish opportunity in ACE Construction Ltd. The completion and breakout of the rounding bottom pattern, supported by bullish momentum indicators and favorable valuation, make a strong case for upward price movement towards ₹1,450–₹1,550 in the near term.
Technical Pattern Observed (Hourly Timeframe): A Rounding Bottom pattern has been identified on the hourly chart, which is a bullish reversal pattern, indicating a shift from bearish to bullish sentiment.
Neckline Breakout Level: ₹1,300 (confirmed)
Breakout Confirmation: Price closed above neckline with volume support
Target Estimation (Measurement Rule):
- Target 1: ₹1,450
- Target 2 (Final): ₹1,550
Stop Loss: ₹1,260 (last swing high before breakout, risk-managed level)
Momentum & Trend Indicators:
- Multi-EMA Bullish Crossover: Multiple exponential moving averages have aligned in a bullish formation, signaling trend continuation.
- Relative Strength Index (RSI): Currently above 60, reflecting strengthening momentum and buyer dominance.
Fundamental Context: ACE Construction Ltd remains **fundamentally strong** with robust financials and growth visibility. The current price level provides an **attractive valuation**, further supporting the bullish technical setup.
Conclusion: The current technical setup presents a high-probability bullish opportunity in ACE Construction Ltd. The completion and breakout of the rounding bottom pattern, supported by bullish momentum indicators and favorable valuation, make a strong case for upward price movement towards ₹1,450–₹1,550 in the near term.
Thông báo miễn trừ trách nhiệm
Thông tin và ấn phẩm không có nghĩa là và không cấu thành, tài chính, đầu tư, kinh doanh, hoặc các loại lời khuyên hoặc khuyến nghị khác được cung cấp hoặc xác nhận bởi TradingView. Đọc thêm trong Điều khoản sử dụng.
Thông báo miễn trừ trách nhiệm
Thông tin và ấn phẩm không có nghĩa là và không cấu thành, tài chính, đầu tư, kinh doanh, hoặc các loại lời khuyên hoặc khuyến nghị khác được cung cấp hoặc xác nhận bởi TradingView. Đọc thêm trong Điều khoản sử dụng.