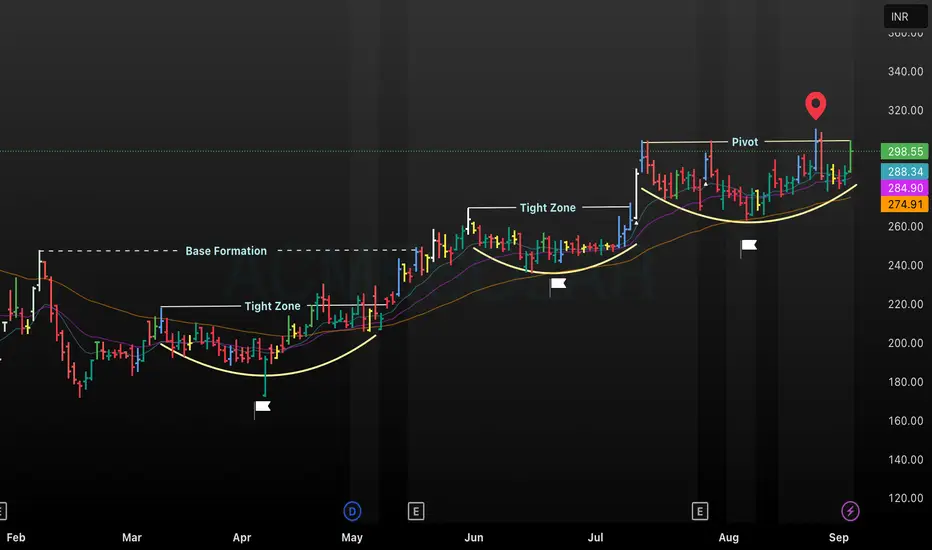
This chart of ACME shows price action over several months, highlighting key technical levels and zones. A clear base formation is established early, followed by successive tight zones indicating consolidation phases, which often precede breakouts. The pivot level mark signals a critical resistance point, with price action approaching and ultimately breaking out above it. Multiple moving averages are shown for trend context, and all major formations are annotated for quick identification, supporting both educational and trading analysis.
Thông báo miễn trừ trách nhiệm
Thông tin và các ấn phẩm này không nhằm mục đích, và không cấu thành, lời khuyên hoặc khuyến nghị về tài chính, đầu tư, giao dịch hay các loại khác do TradingView cung cấp hoặc xác nhận. Đọc thêm tại Điều khoản Sử dụng.
Thông báo miễn trừ trách nhiệm
Thông tin và các ấn phẩm này không nhằm mục đích, và không cấu thành, lời khuyên hoặc khuyến nghị về tài chính, đầu tư, giao dịch hay các loại khác do TradingView cung cấp hoặc xác nhận. Đọc thêm tại Điều khoản Sử dụng.